Here are the 10 notable moments over the past 50 years when the U.S. 10 year bond yield had entered Monthly overbought territory while also being at a certain percentage above its 50 month moving average and also trading up to 2 standard deviations above its rolling monthly mean.
And today many are still betting that yields rise (and bond prices fall)…..
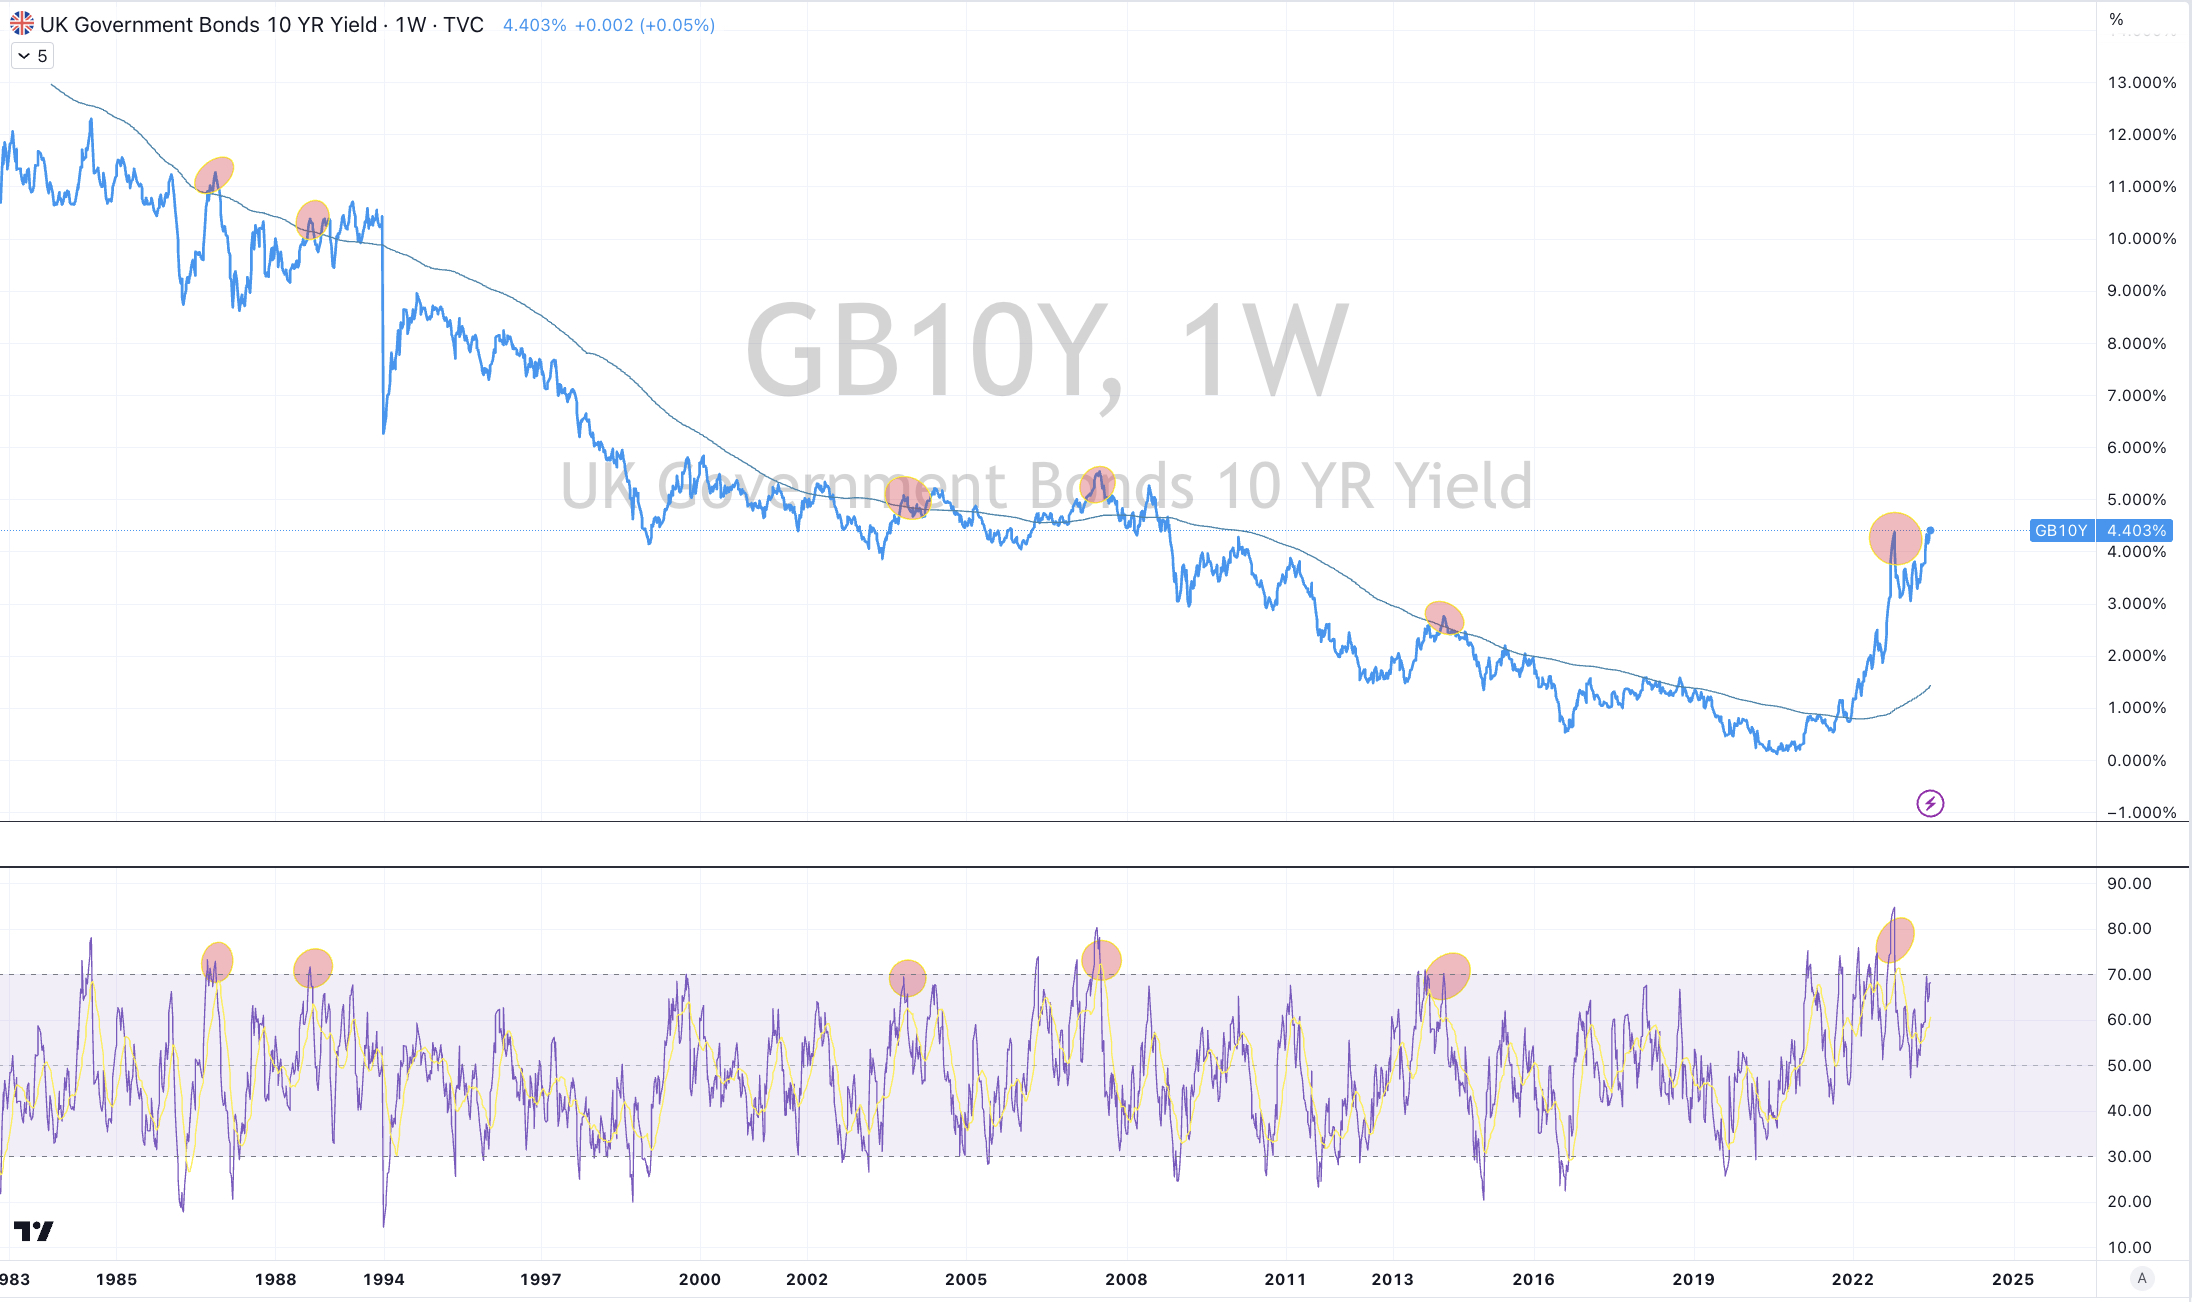
British 10 year government bond yields are seldom this distance above its 200 week moving average while simultaneously registering a weekly overbought reading.
Forgetting Bank of England policy rate setting, I can see these 10’s back down around 2.40% over the coming 9-15 months.
Demand destruction commensurate with decline in GDP will aide this thesis.
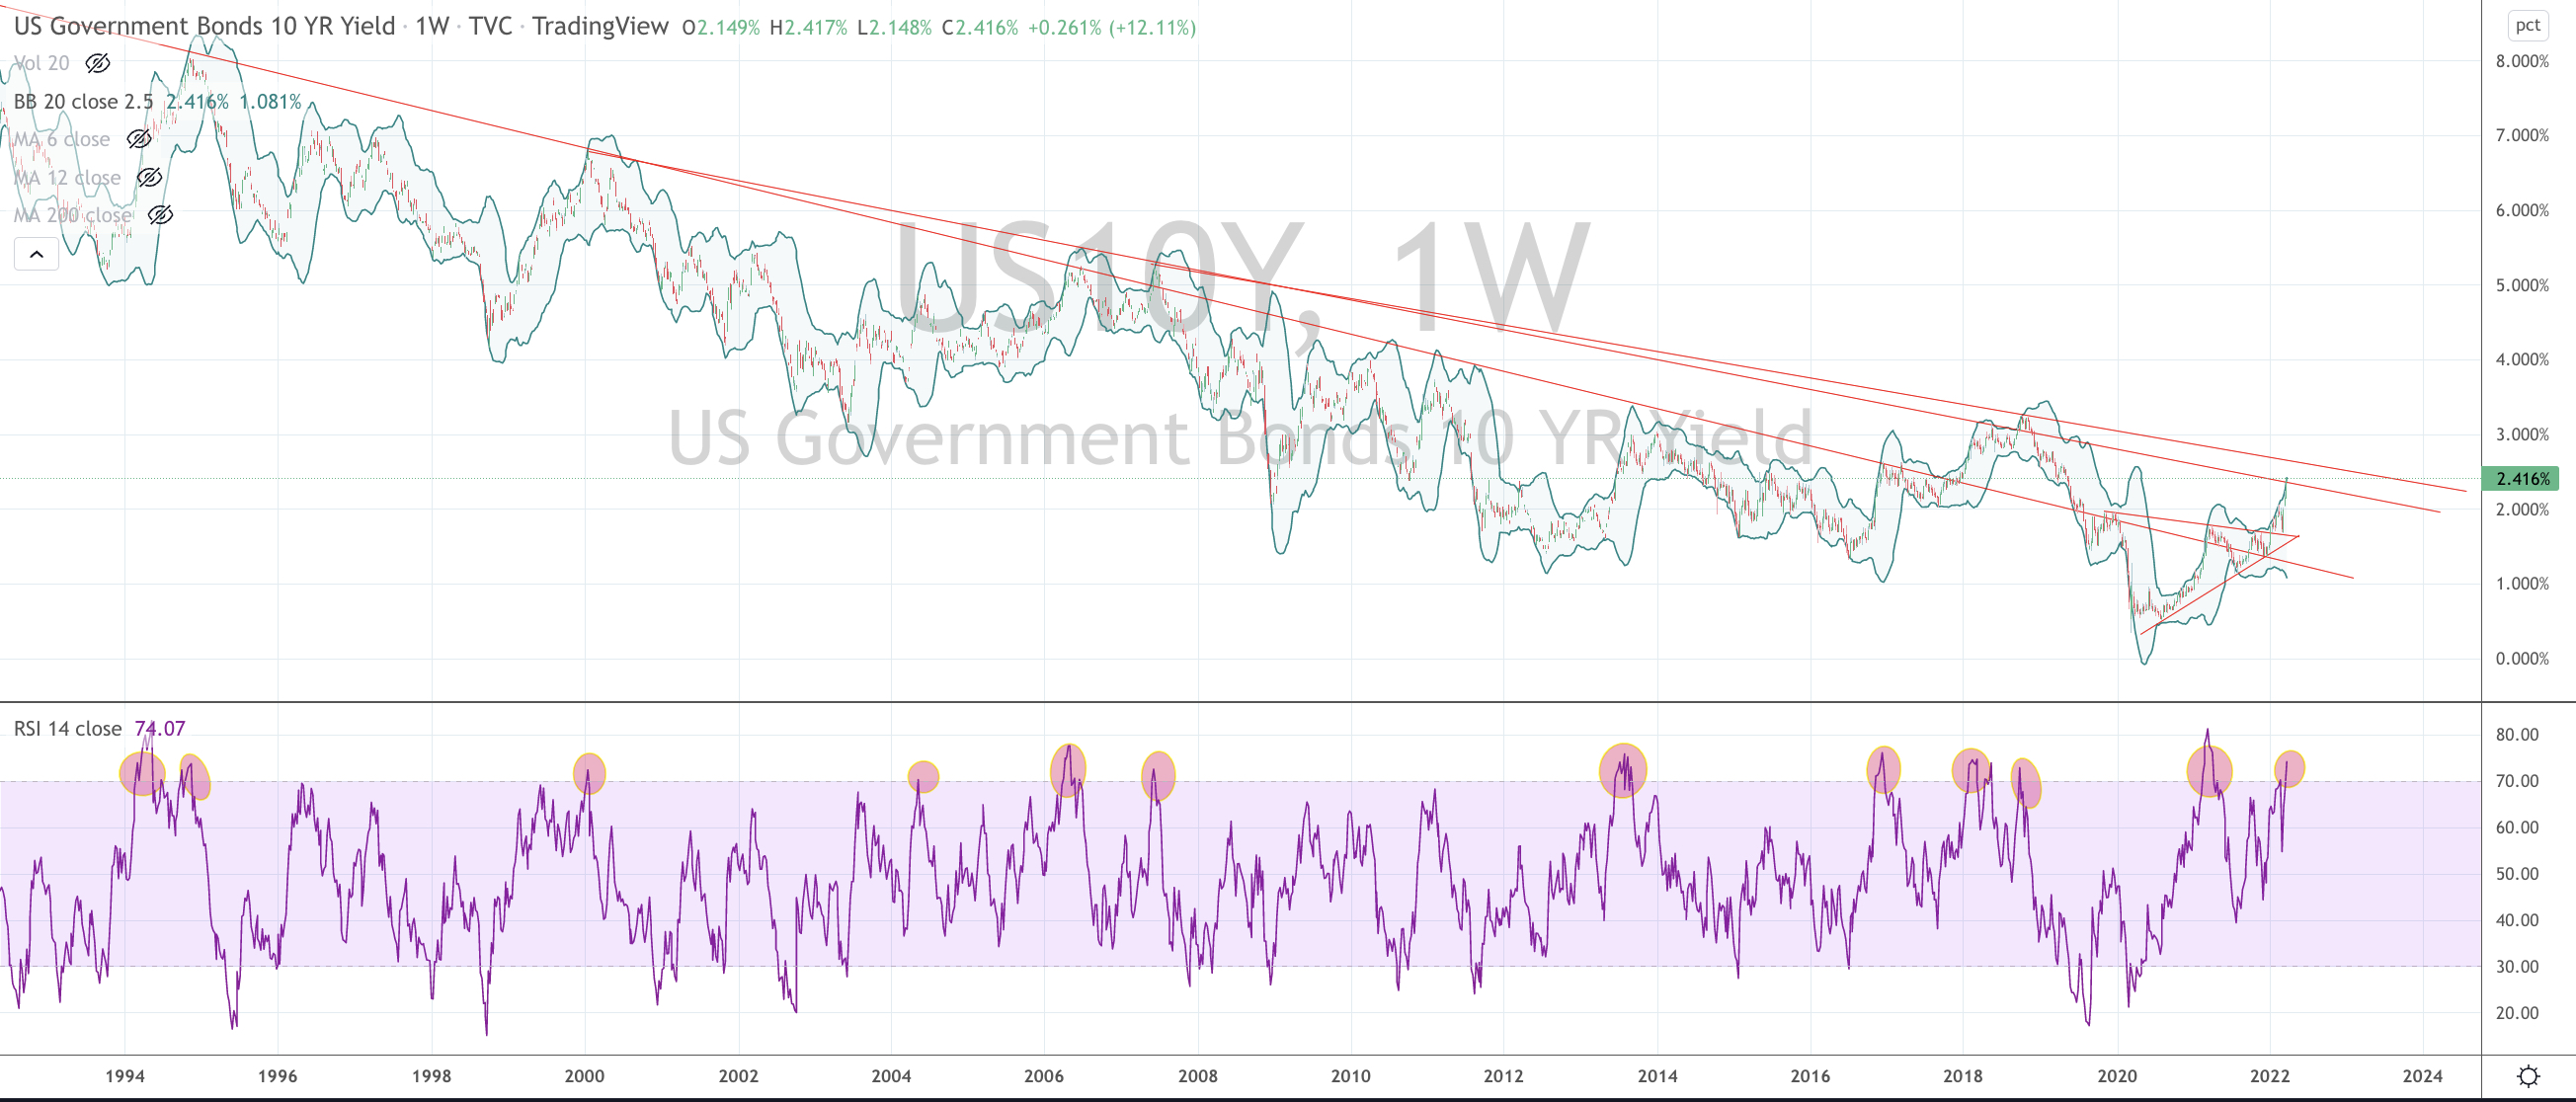
U.S. 10 year bond yield are at ‘overbought extremes’.
At 2.41%, it’s kinda done or at the least, at the upper end of being so.
I’ll give a move to 2.6% (that downward sloping resistance line in the chart below) but I’ll say that you don’t want to be shorting bonds at these levels.
Beyond the subjective notion that short bonds is a crowded trade and the chart below showing a unison registration of a 70 RSI reading (it’s 12th visit in 30 years) with a 2.5 weekly standard deviation above the mean, my other work tells me that the 10’s are the most stretched since October 2018.
In fact, other than 2018 and now, we haven’t seen the 10’s this ‘stretched’ at any other time in 40 years of data.
Additionally, the U.S. 10 year bond yields have doubled in 8 months and quadrupled in 18 months.
If you think 2.4% is low compared to where we once came from, the quantum of this ‘recent’ move should count for something.
p.s. once again, tune in to the noise amongst the market pundits, chat rooms and the media again. ‘Today’s’ hyper-ventilation is now about falling bond market yields.
Similar to recent moments seen in Nickel, Oil, Crypto, Wheat, Chinese equities etc etc, consider the opposite side of what the crowd is crowing about.
It’s funny, I just can’t seem to remember ‘them’ saying anything when interest rates were 1%……