Watch out for the rip

It’s Friday, which means the Thursday (U.S. time) edition of the American Association of Individual Investors (AAII) Survey has been released.

History of survey results link here

https://www.aaii.com/sentimentsurvey/sent_results

and the respondents are more bearish than last week’s result.

and the bullish/bearish spread is negative at (1.5%).

It’s the highest bearish reading since Nov 2, 2023, when the bullish/bearish spread was also negative.

The most recent moment that the bullish/bearish spread was negative was in the April 25, 2024 release.

I have highlighted those 2 moments in the attached S&P 500 price chart.

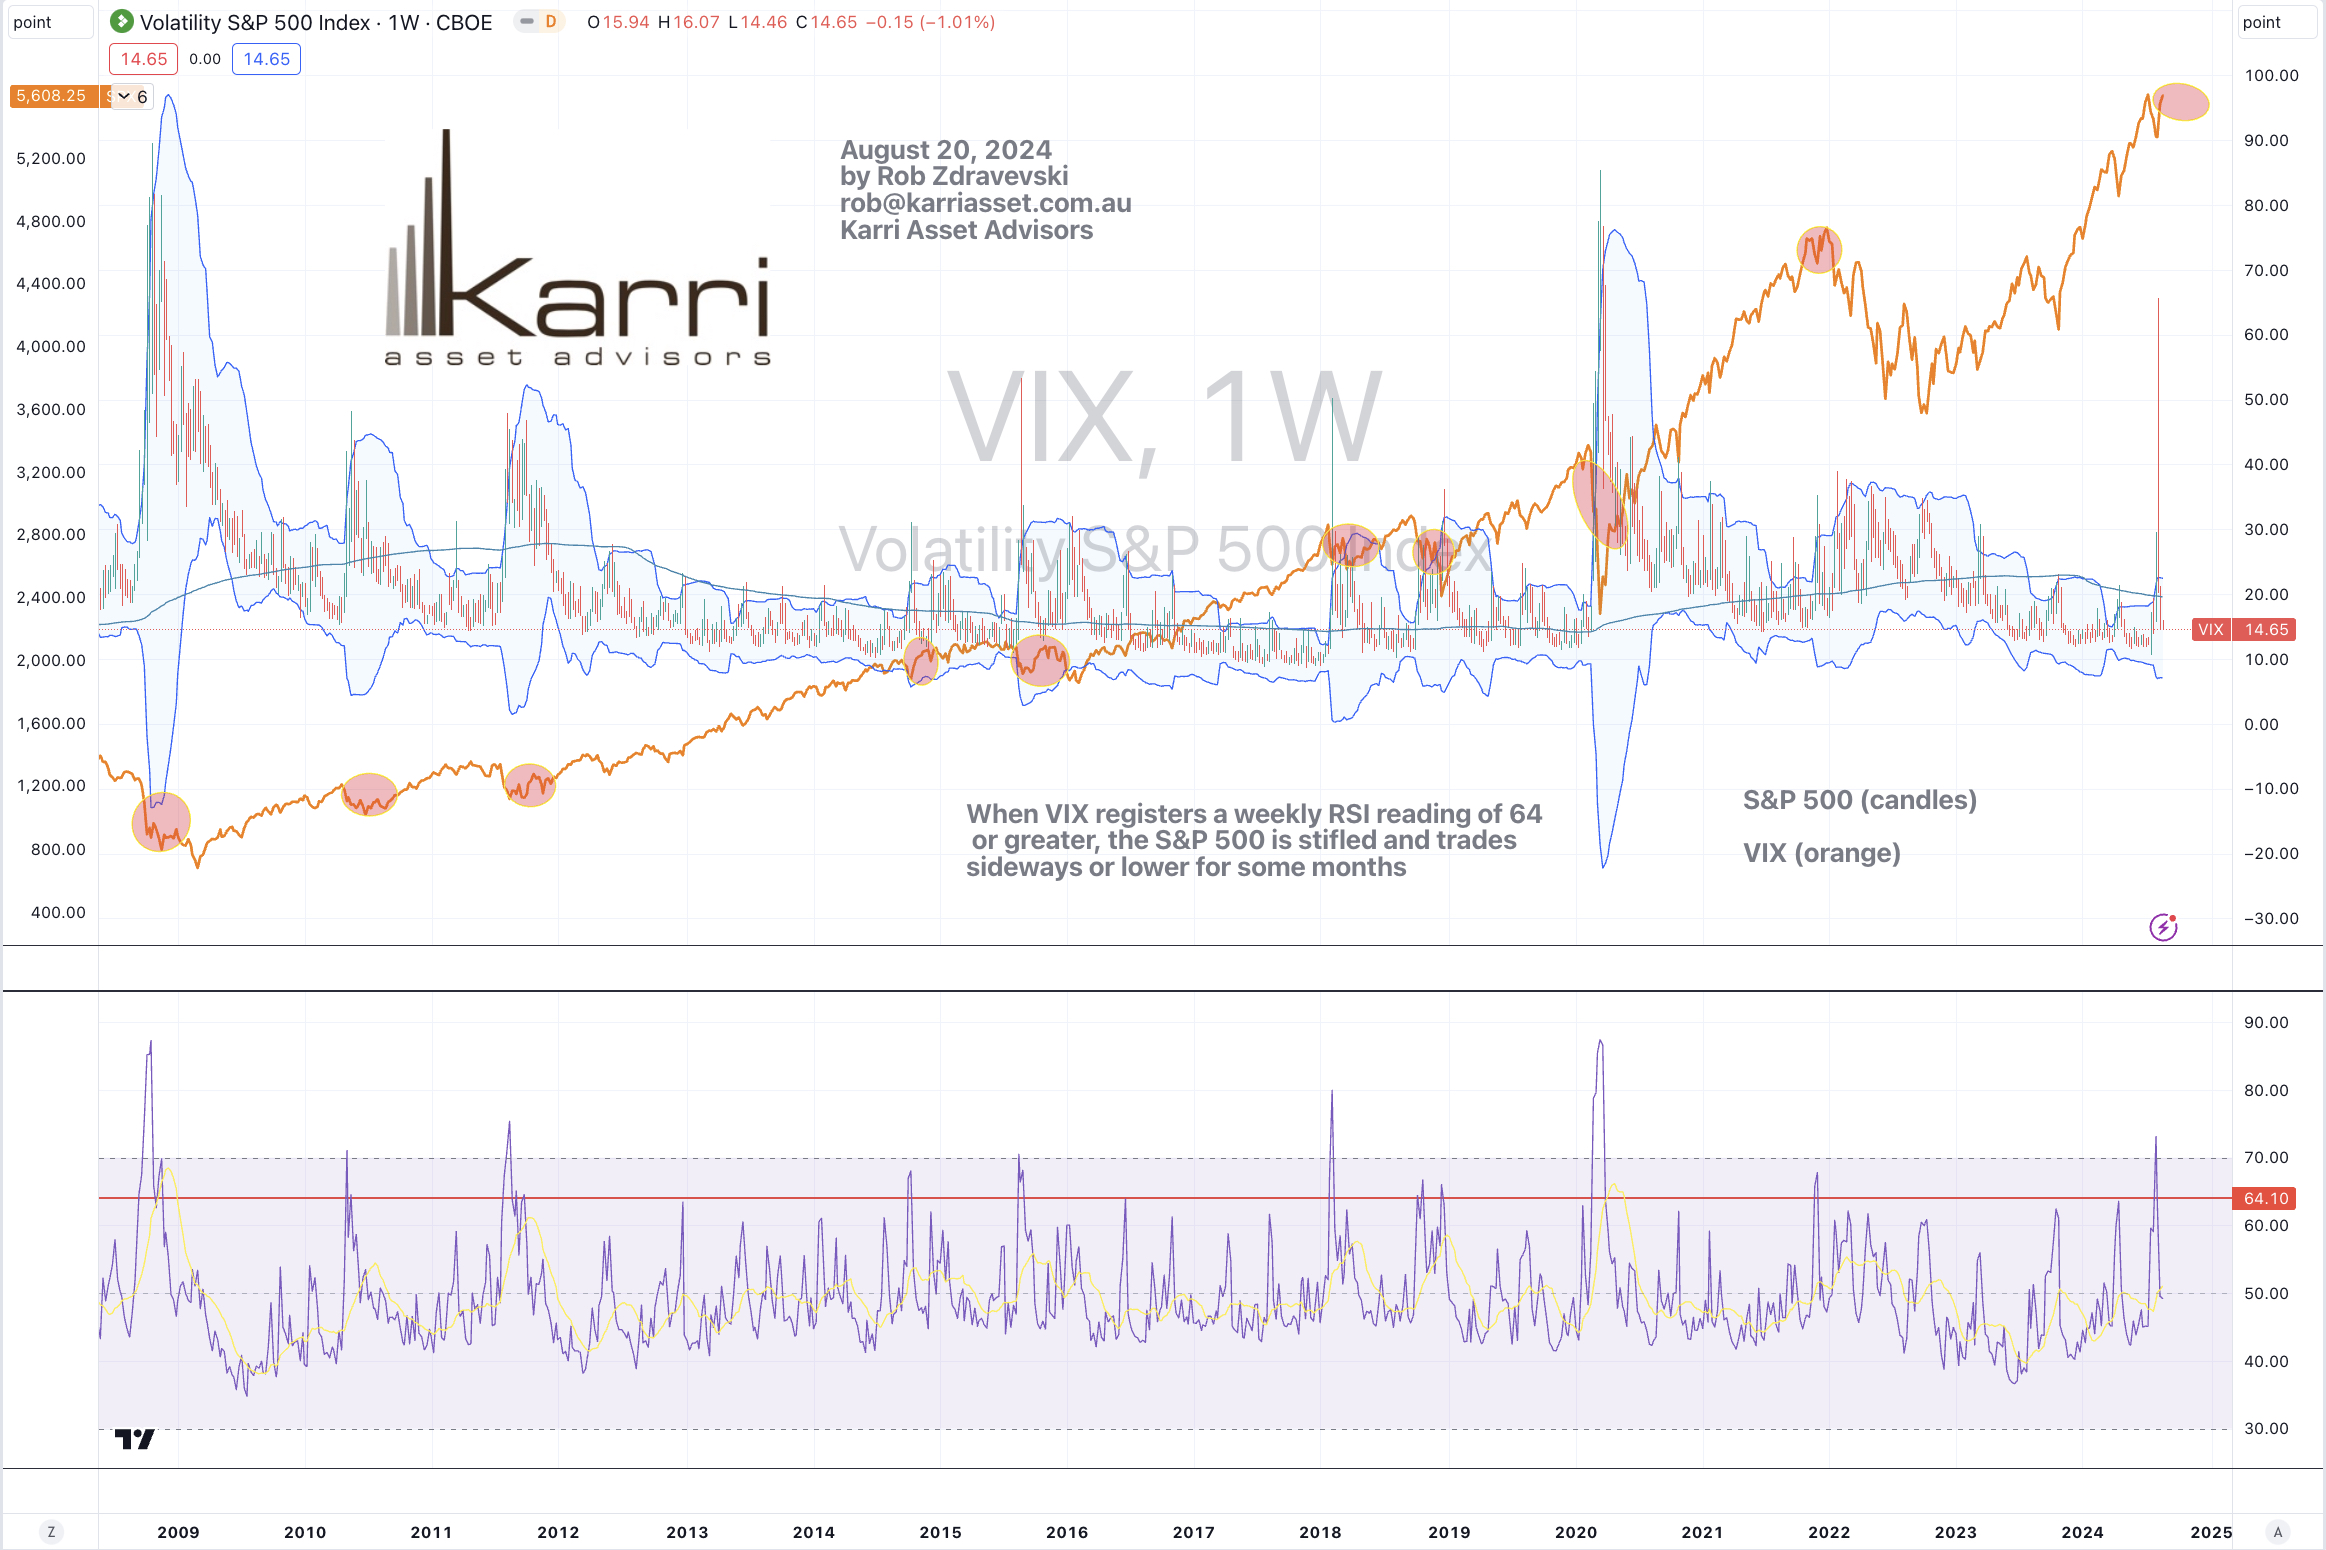
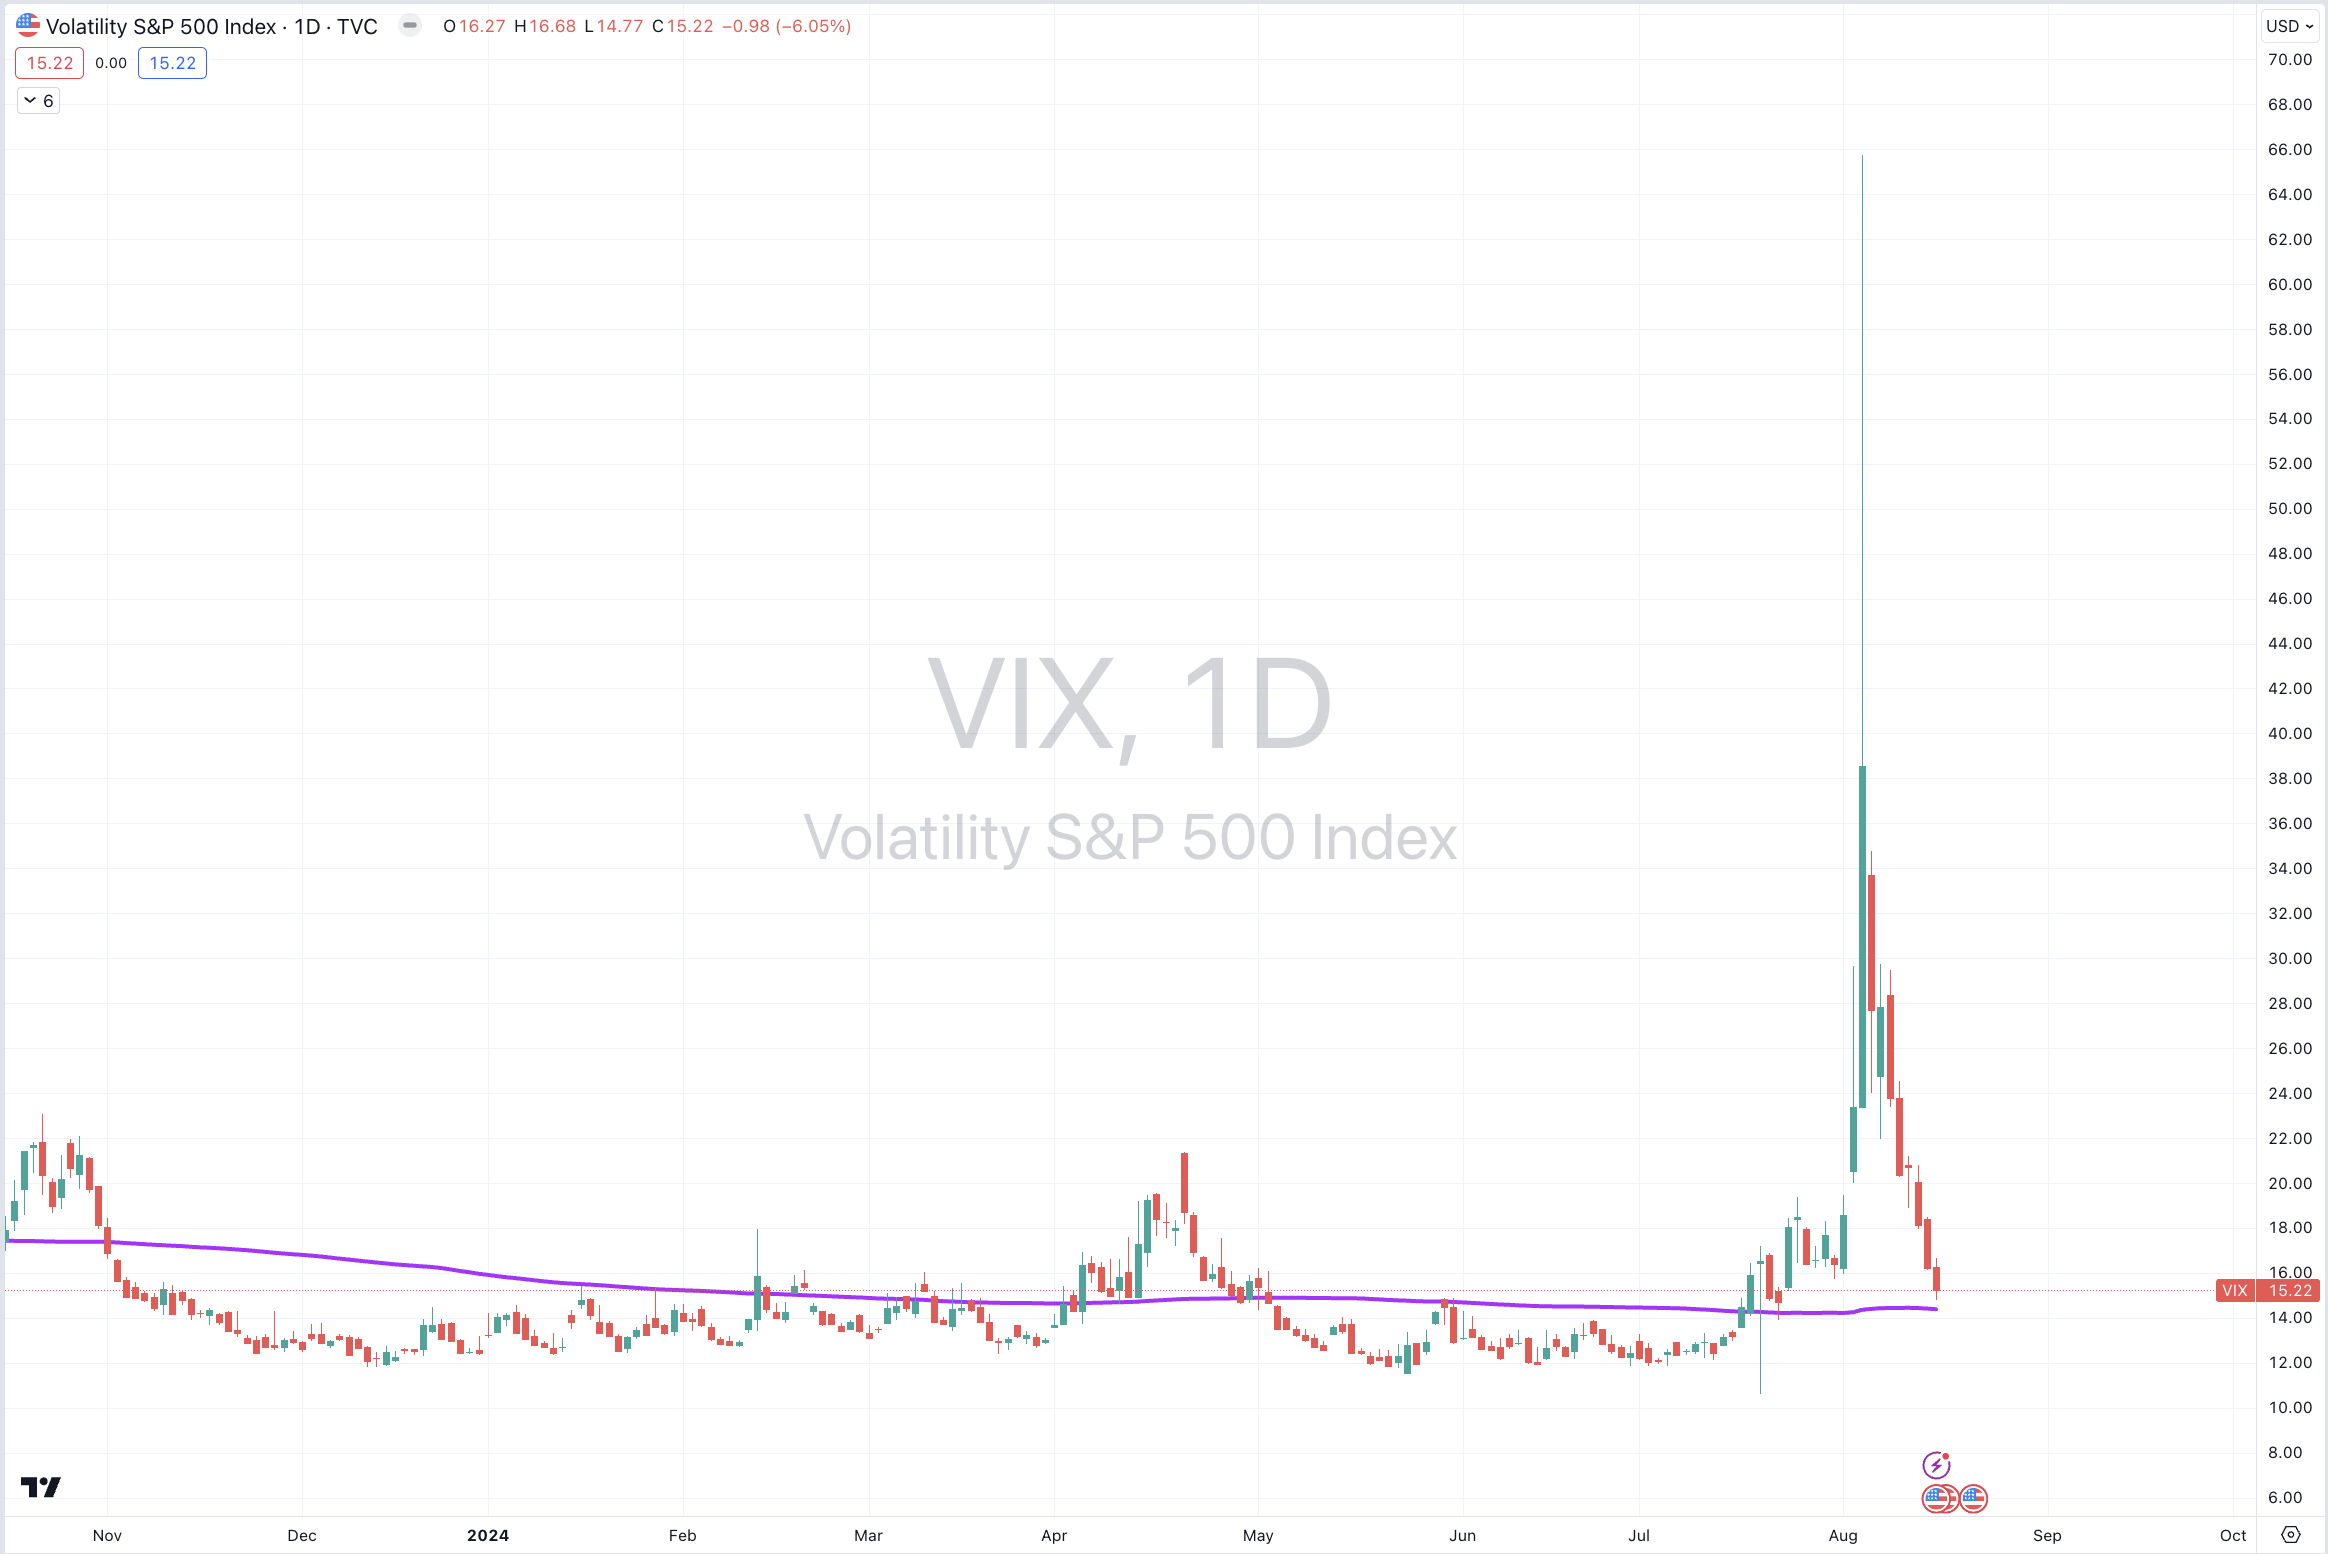
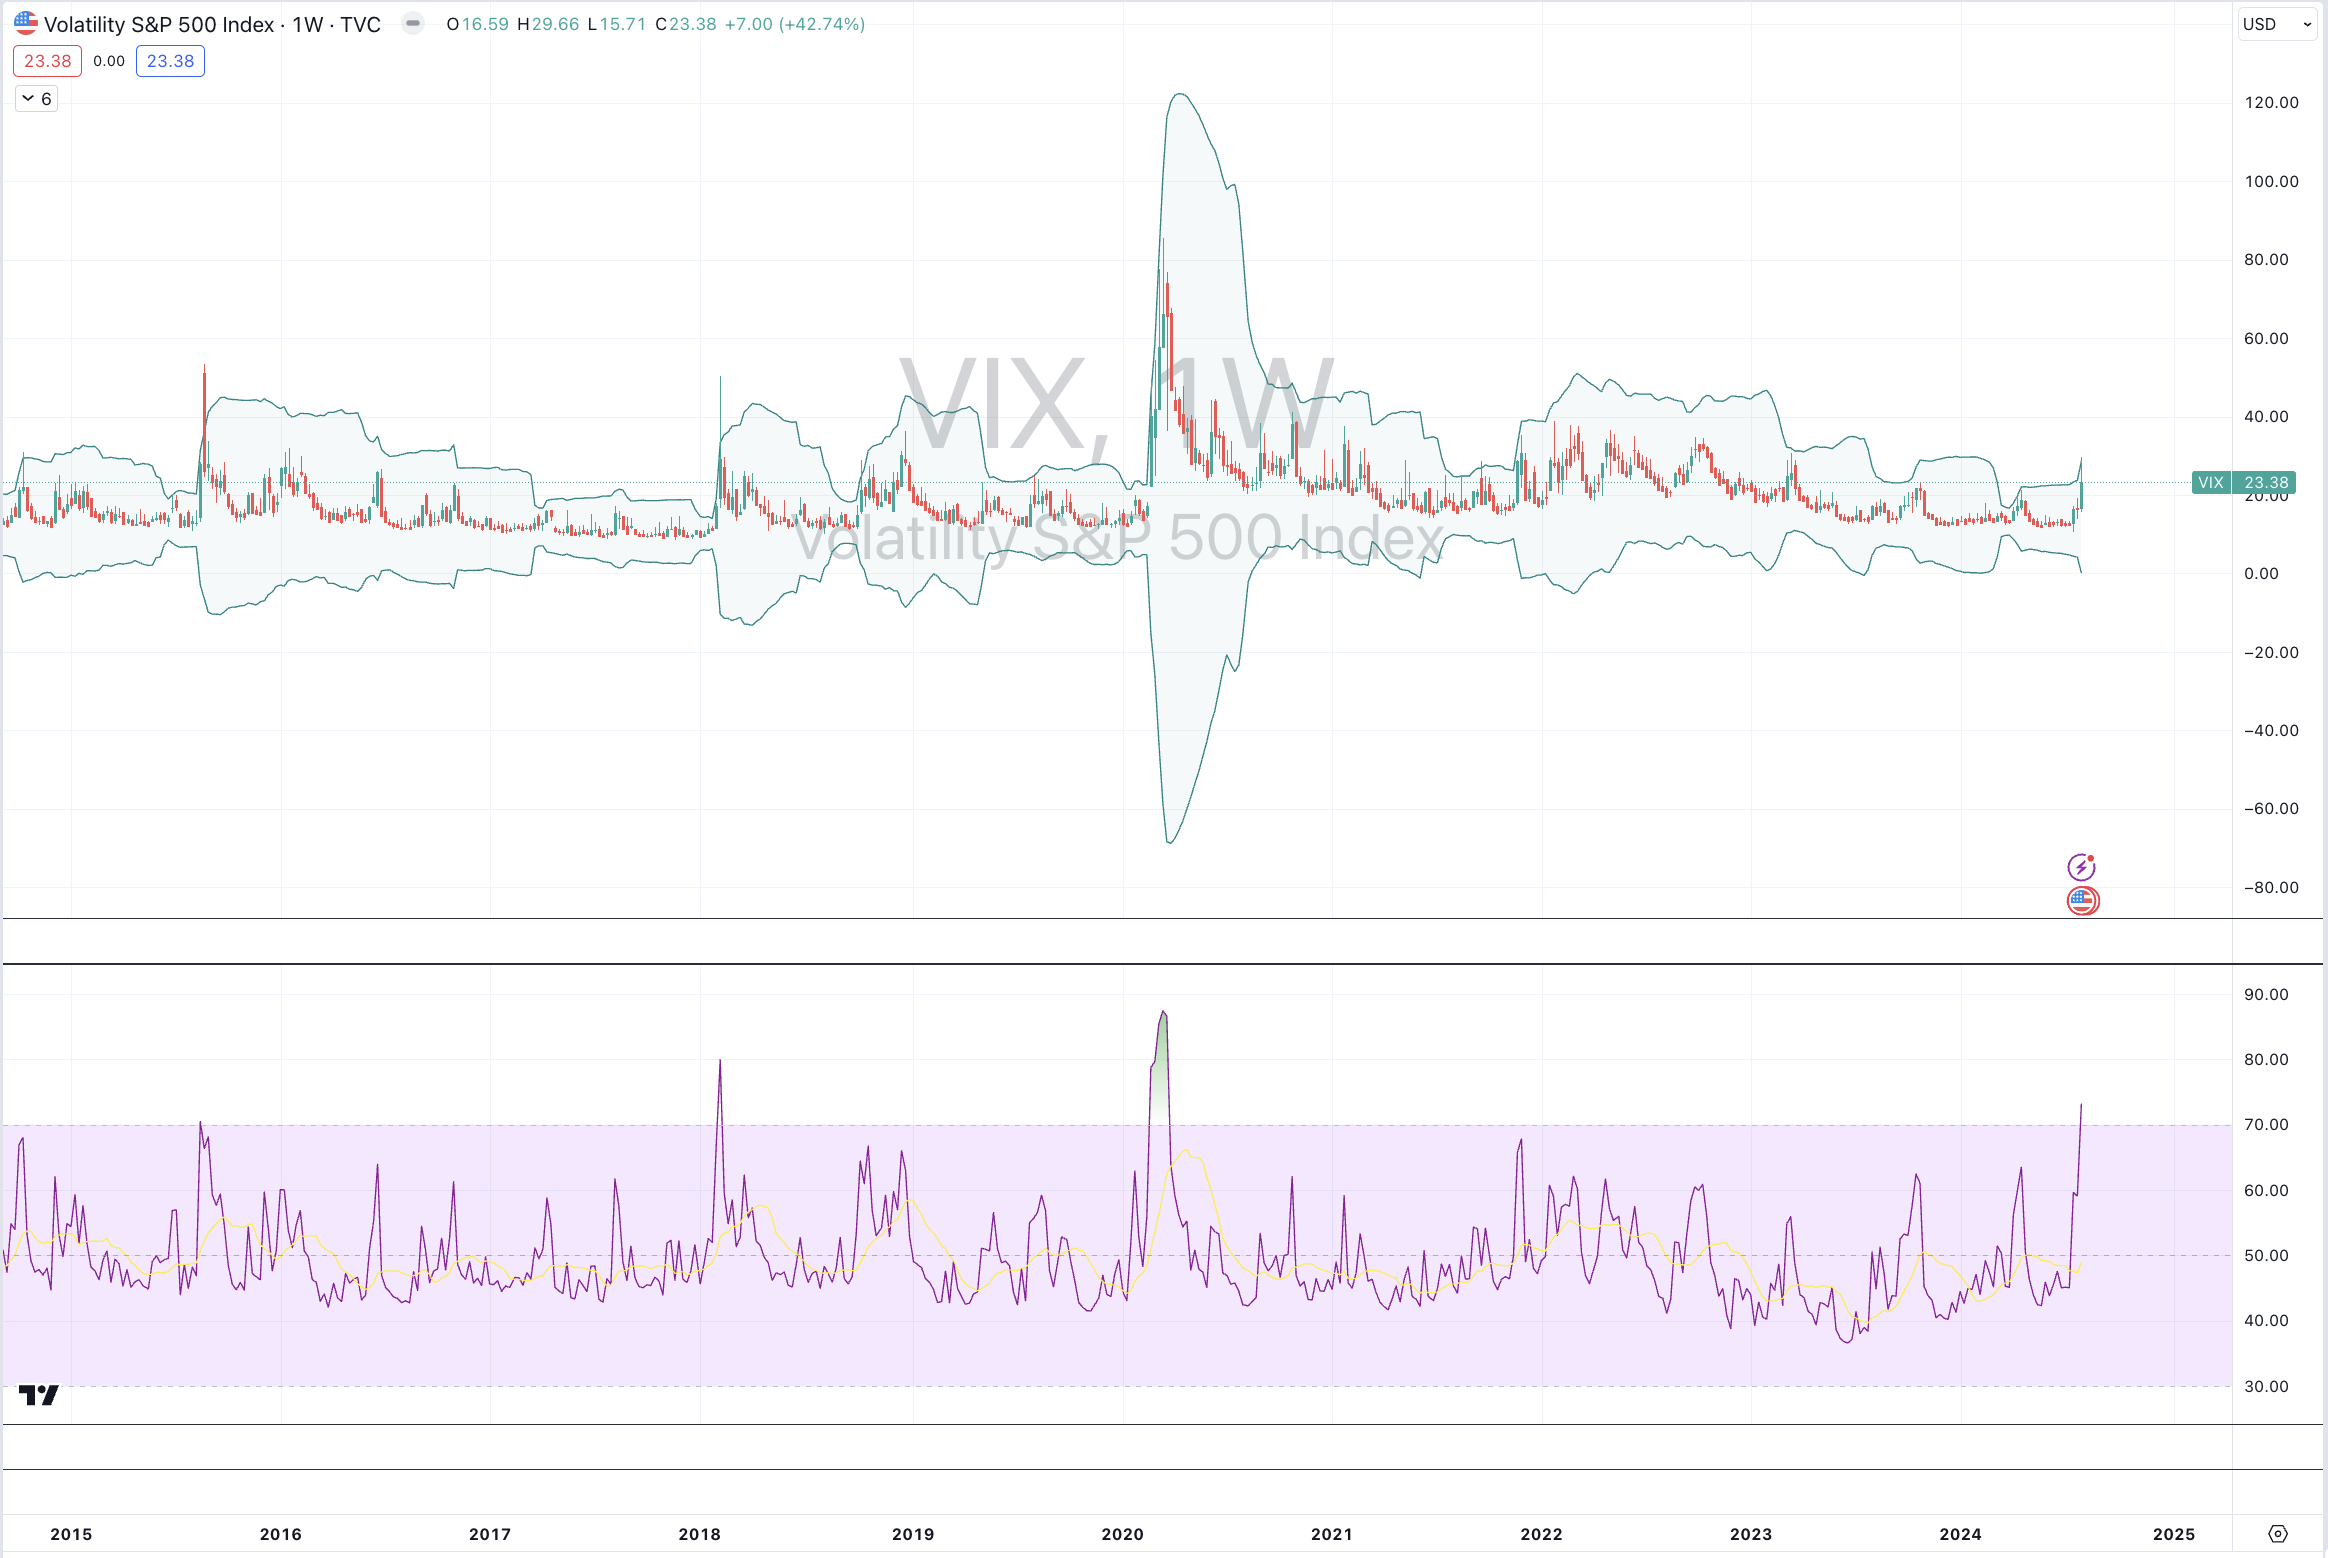
This is in keeping with my other commentary that while we are late in this particular equity ‘party’ and the VIX is subdued, it looks like equities will ‘rip’ higher.

Like any place where waves are prevalent, you need to watch out for the rips.

November 29, 2024

rob@karriasset.com.au

Screenshot
Screenshot

S&P 500 advance to dissipate

The S&P 500’s climb up the wall of worry is over.

My story link mentions the advance ends when the VIX registers a weekly reading of 64 or greater.

It did that last week.

The study below circles the S&P 500 when that weekly VIX vol64 occurs. It then trades sideways to lower, for many following months.

Not to worry, the ‘market’ will change its shape and weight will be re-distributed.

August 20, 2024

by Rob Zdravevski

rob@karriasset.com.au

Screenshot

more VIX quips

and just like that, the #VIX is back to 15.

A new complacency to ensue?

perhaps, but I’m reminded that parabolas mean revert quickly.

August 16, 2024

Screenshot

Rolling with the VIX

To support a case for a tactical bounce in the equity markets,

I have used red to highlight the data when the AAII investor sentiment survey has had the narrowest spread between bullish and bearish respondents,

Screenshot

And I have circled those corresponding moment in the accompanying S&P 500 chart.

Screenshot

So that all looks lovely when many of the bulls disappear.

Although, ‘bounces’, by nature are short-term.

For the strategic equity allocators, this note supported the ‘grind’ higher for the S&P 500

But that was back then and we are now deeper into this grind.

My final line in that note said, “It’s not the safest of markets”.

August 12, 2024

by Rob Zdravevski

rob@karriasset.com.au

A VIX extreme

It is the 4th time in 10 years that the VIX Index has simultaneously registered a weekly overbought signal and traded to 5 standard deviations above its 20 week moving average.

Tune in Rob !

5 standard deviations is quite something.

As a cross reference, here is a note from April 2023 titled, “the VIX does matter”.

#crescendo

August 5, 2024

by Rob Zdravevski

rob@karriasset.com.au

Screenshot

An expected move in the VIX

I think there is a change of direction approaching in the #VIX.

Subjectively, it seems there is complacency in equity #risk or at least expected volatility.

Factually, weekly bollinger bands are at their narrowest since February 2007.

This is when I look at putting on my #hedges or ‘fade exposure’.

You remove hedges at the other end of the pendulum.

March 11, 2024

by Rob Zdravevski

rob@karriasset.com.au

Buyers of Swiss Francs are being defensive, consider the antithesis

For the strategic asset allocators;

When the circles represent an overbought condition for CHF/AUD on a Monthly basis, the rectangles on the main chart indicate an opportune moments for accumulating equities.

In this scenario, the S&P 500 is represented by the orange line.

November 29, 2023

by Rob Zdravevski

rob@karriasset.com.au

Reading the VIX and its RSI

The VIX is now trading at 14. Whilst this is towards the lower end of its 30 history, it has spent plenty of time around this price.

I find the current RSI reading of 37.50 much more interesting, as shown in the lower chart.

37.50 seems to be around where it extends itself while the circles denote 2 occasions where it traded to 33 in May 2003 and 34.8 in July 2009.

Note that the VIX has never been oversold on a weekly basis

Hmmmm…..

June 7, 2023

by Rob Zdravevski

rob@karriasset.com.au

Low Bitcoin volatility leads to a violent move

I am studying Bitcoin volatility and have found that the its 30 day historical volatility has fallen to its lowest level in my 10 years of data.

6 out of 7 times when its fallen to similar levels Bitcoin has rallied notably.

Last night, Bitcoin rose 3% or $300. It is currently trading at $10,878.

And Bitcoin’s correlation to the S&P 500 is ‘growing’.

The weekly chart below paints a clearer picture.

October 9, 2020
by Rob Zdravevski
rob@karriasset.com.au