When the circles represent an overbought condition for CHF/AUD on a Monthly basis, the rectangles on the main chart indicate an opportune moments for accumulating equities.
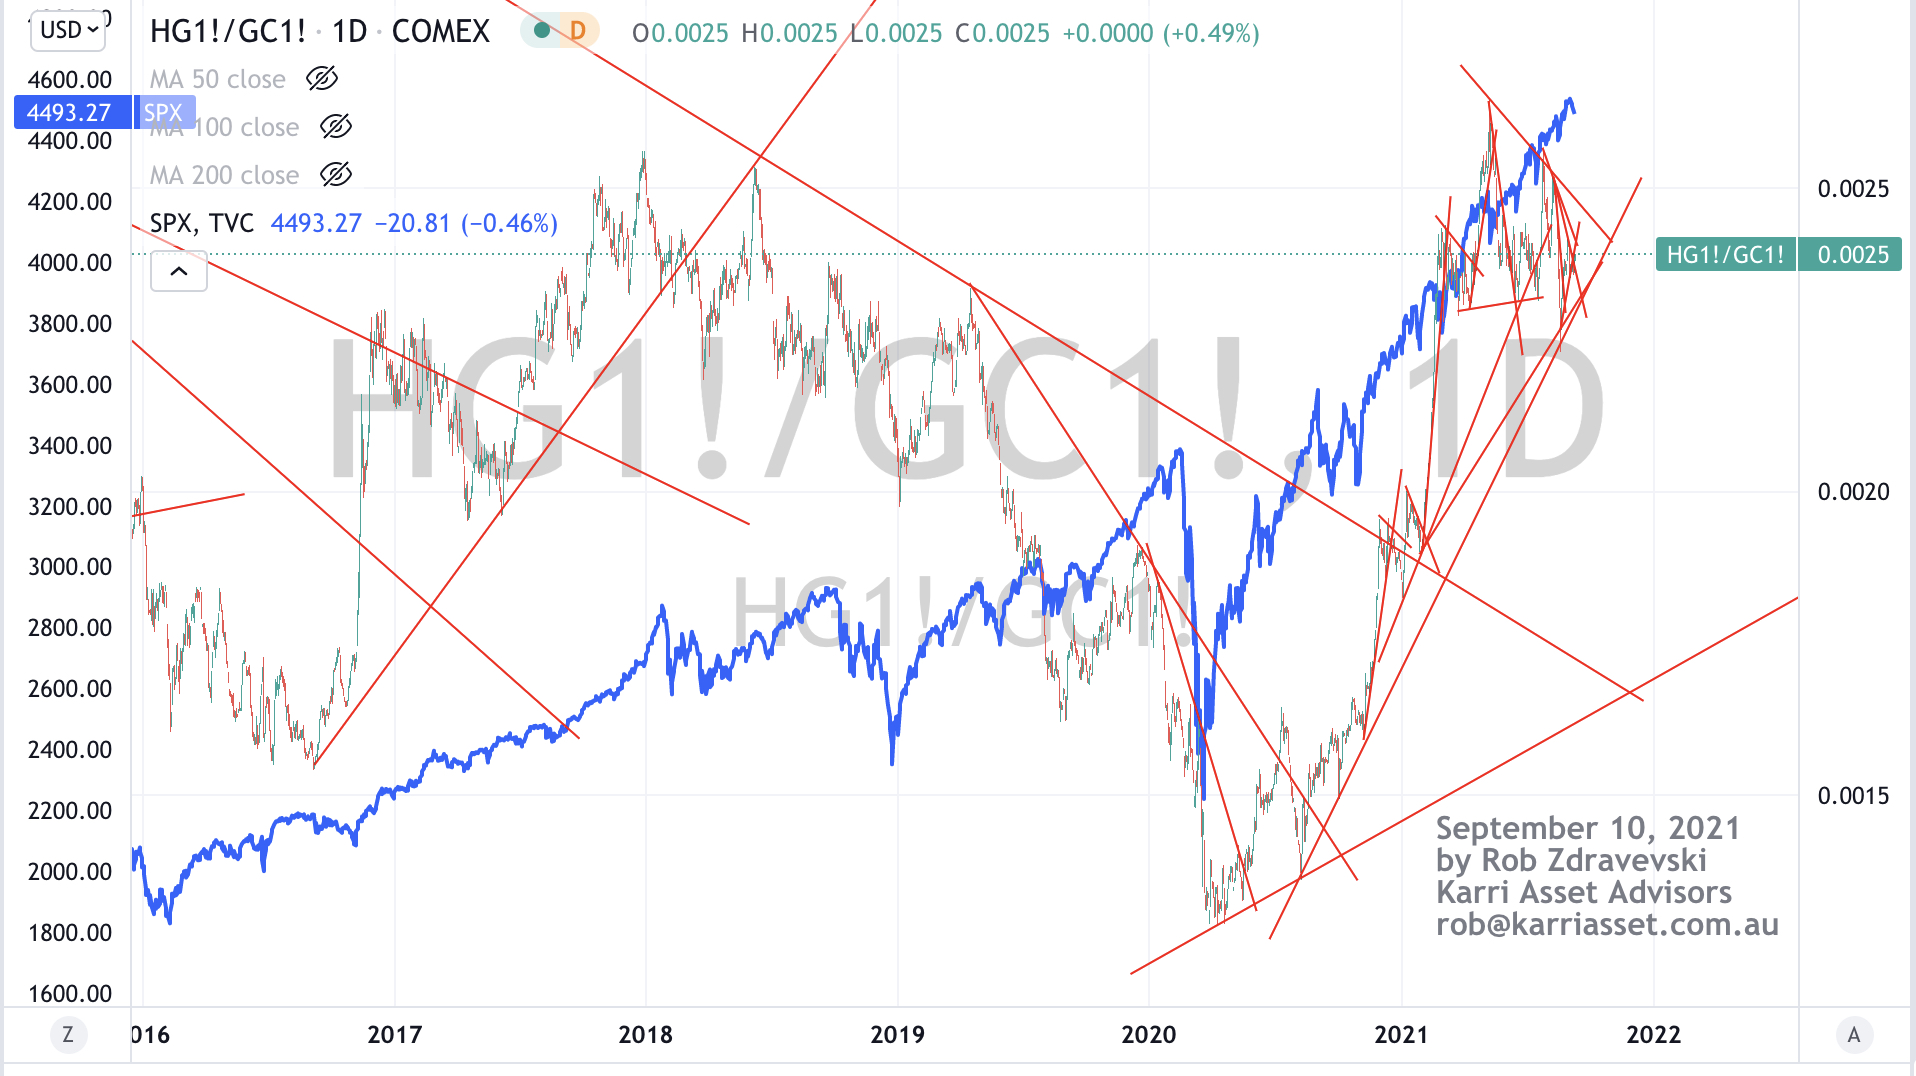
In this scenario, the S&P 500 is represented by the orange line.
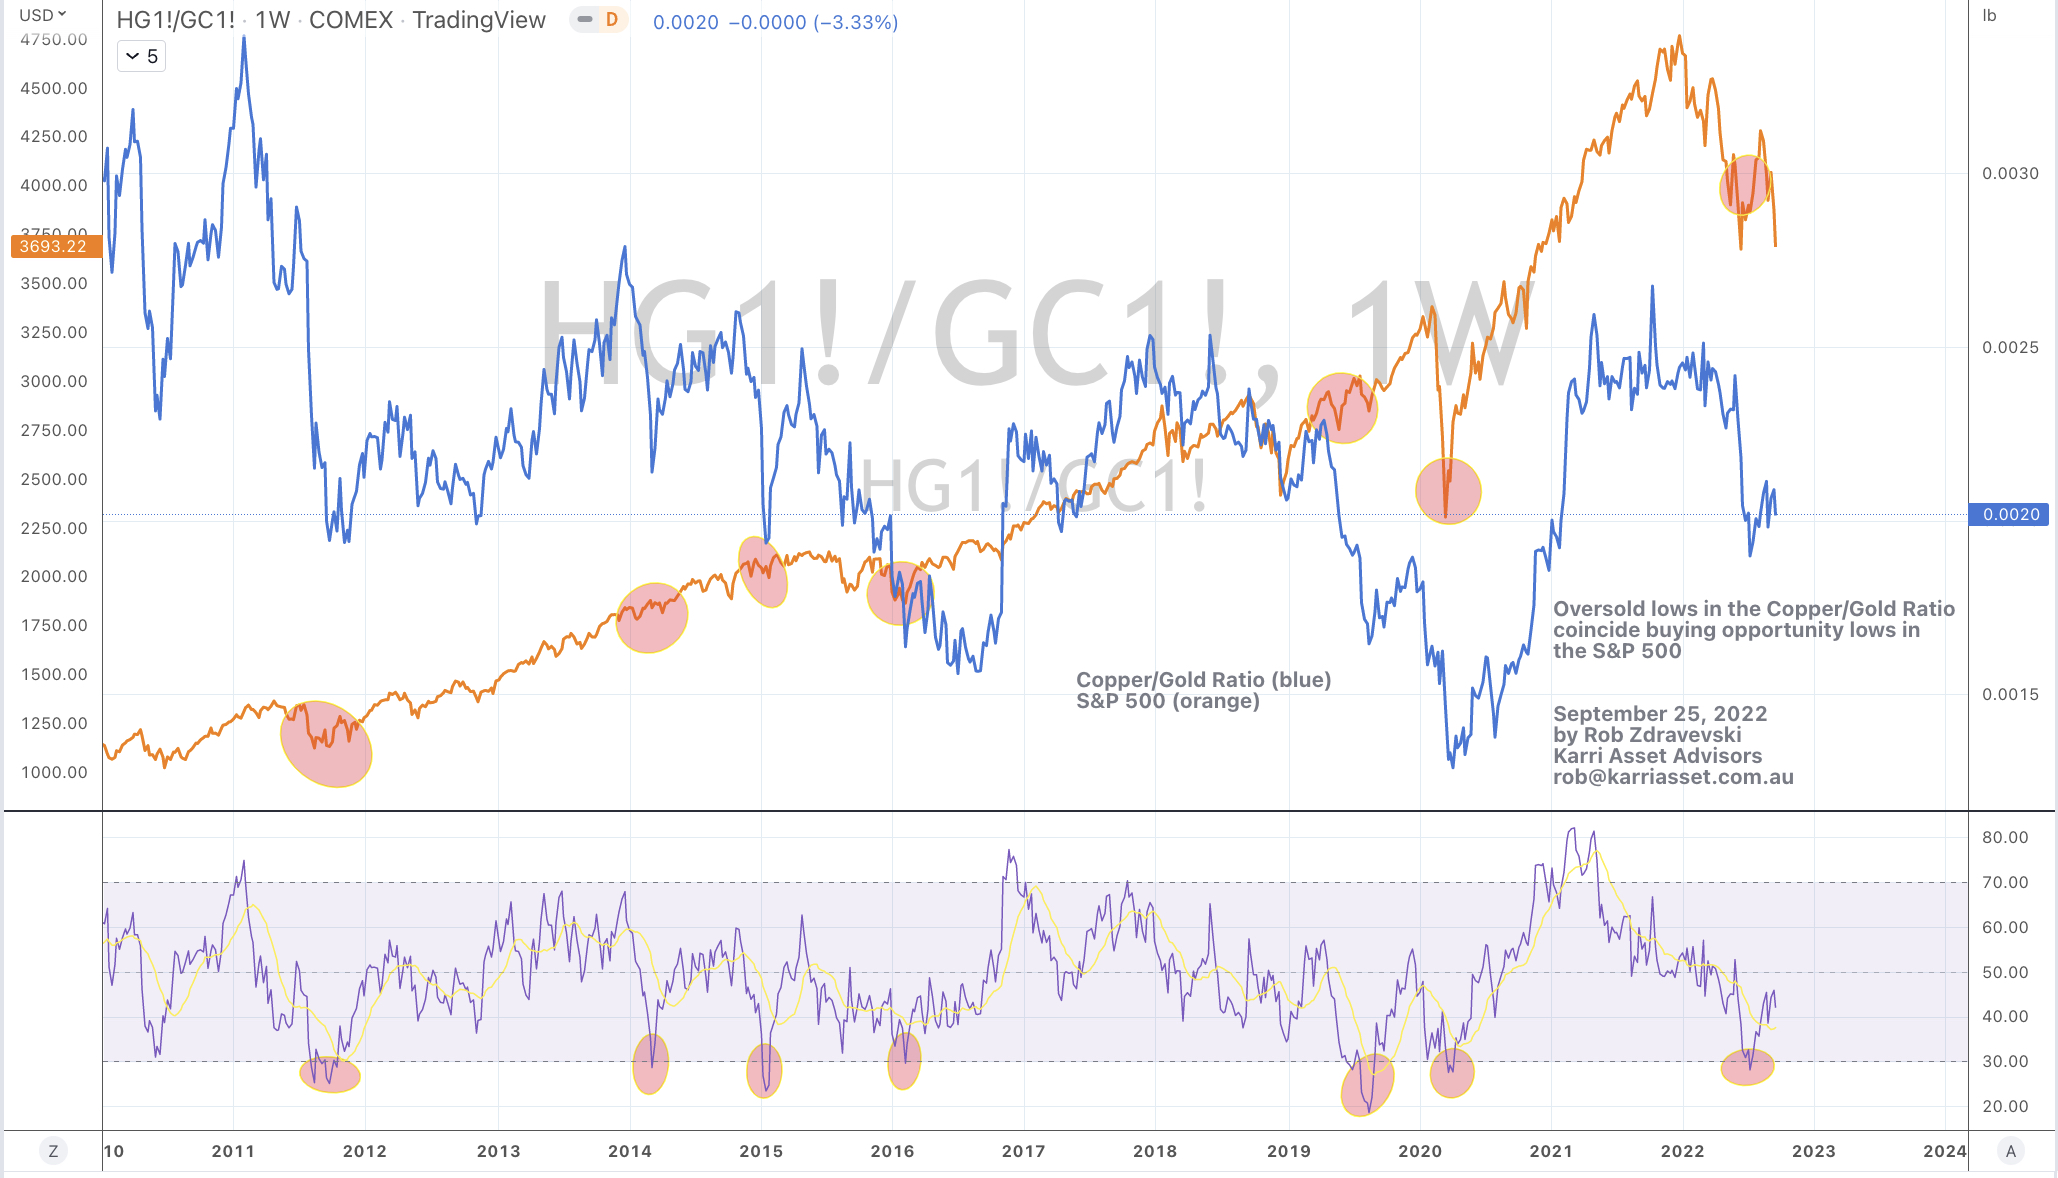
In early July 2022, the Copper/Gold Ratio registered its 7th weekly oversold reading within 12 years.
This occasion coincides with a notable low, or at least safer, longer term buying opportunity in stocks…..or as the chart below implies, in the S&P 500 Index.
In other posts I have mentioned how the monitoring of this ratio is also helpful in tracking the direction of interest rates.
In the meantime, I’ll watch if the Copper/Gold ratio re-visits the oversold region in the coming 3-8 weeks.
The vertical lines show the significance when the Japanese 10 year bond yield is (on a weekly chart) simultaneously OVERSOLD and trading 2.5 standard deviations and BELOW its rolling weekly mean.
Around the same time, the S&P 500 also registers a notable low.
There have been 9 such moments over the past 15 years when probability suggests nibbling and adding to your holdings.
BoJ and Fed news this week will be helpful shaping the JGB yield but this study suggests the S&P 500 low isn’t there yet. This doesn’t necessarily mean a lower low, but rather a ‘notable’ low.
Bitcoin’s price action, trend and sentiment suggests it tests somewhere around the US$16,000 mark. +/- $600.
A drop in Bitcoin’s 30 day volatility precedes a trough in the price of BTC/USD which precedes ‘one more decline’ in the S&P 500 before itself finds a floor.
This would put my S&P 500 target around 3,645.
A bottoming process which builds into a rally in these two markets would cause much damage to all those huddled on the other side of the boat.
p.s. The direction Bitcoin also has reasonably good correlation with the Australian Dollar and commodity prices.