What if the unemployment rate doubles?

I’m conditioning myself to see U.S. #unemployment rate between 5.5% – 6% within 30 months.

Opining that it should hold the current 3.7% levels is fighting against (my work on) probability and more so when you consider the quantum change seen in interest rates.

I’ll give you a floor of 3.3%.

What if the #unemploymentrate nearly doubles?

What do various capital markets look like with a 6% U.S. unemployment rate?

In business, wage pressure would certainly ease.

It’s not a very sharp outlook for residential real estate, especially if you lose your job.

February 25, 2024

by Rob Zdravevski

rob@karriasset.com.au

Screenshot

Macro Extremes (week ending December 8, 2023)

A weekly Macro, Cross Asset review of prices trading at extremes which may generate future investment ideas and opportunities.

The following assets (on a weekly timeframe) either registered an Overbought or Oversold reading and/or have traded more than 2.5 standard deviations above or below its rolling mean.

Extremes “above” the Mean (at least 2.5 standard deviations

SHY – 1-3 year Treasury ETF

Baltic Dry Index

Coffee

Silver

Gold

IBEX

Overbought (RSI > 70)

Cocoa

Iron Ore

Uranium

The Overbought Quinella – Both Overbought and Traded at > 2.5 standard deviations above the weekly mean)

U.S. Midwest Hot Rolled Coil Steel 

India’s NIFTY and SENSEX equity indices

Extremes “below” the Mean (at least 2.5 standard deviations)

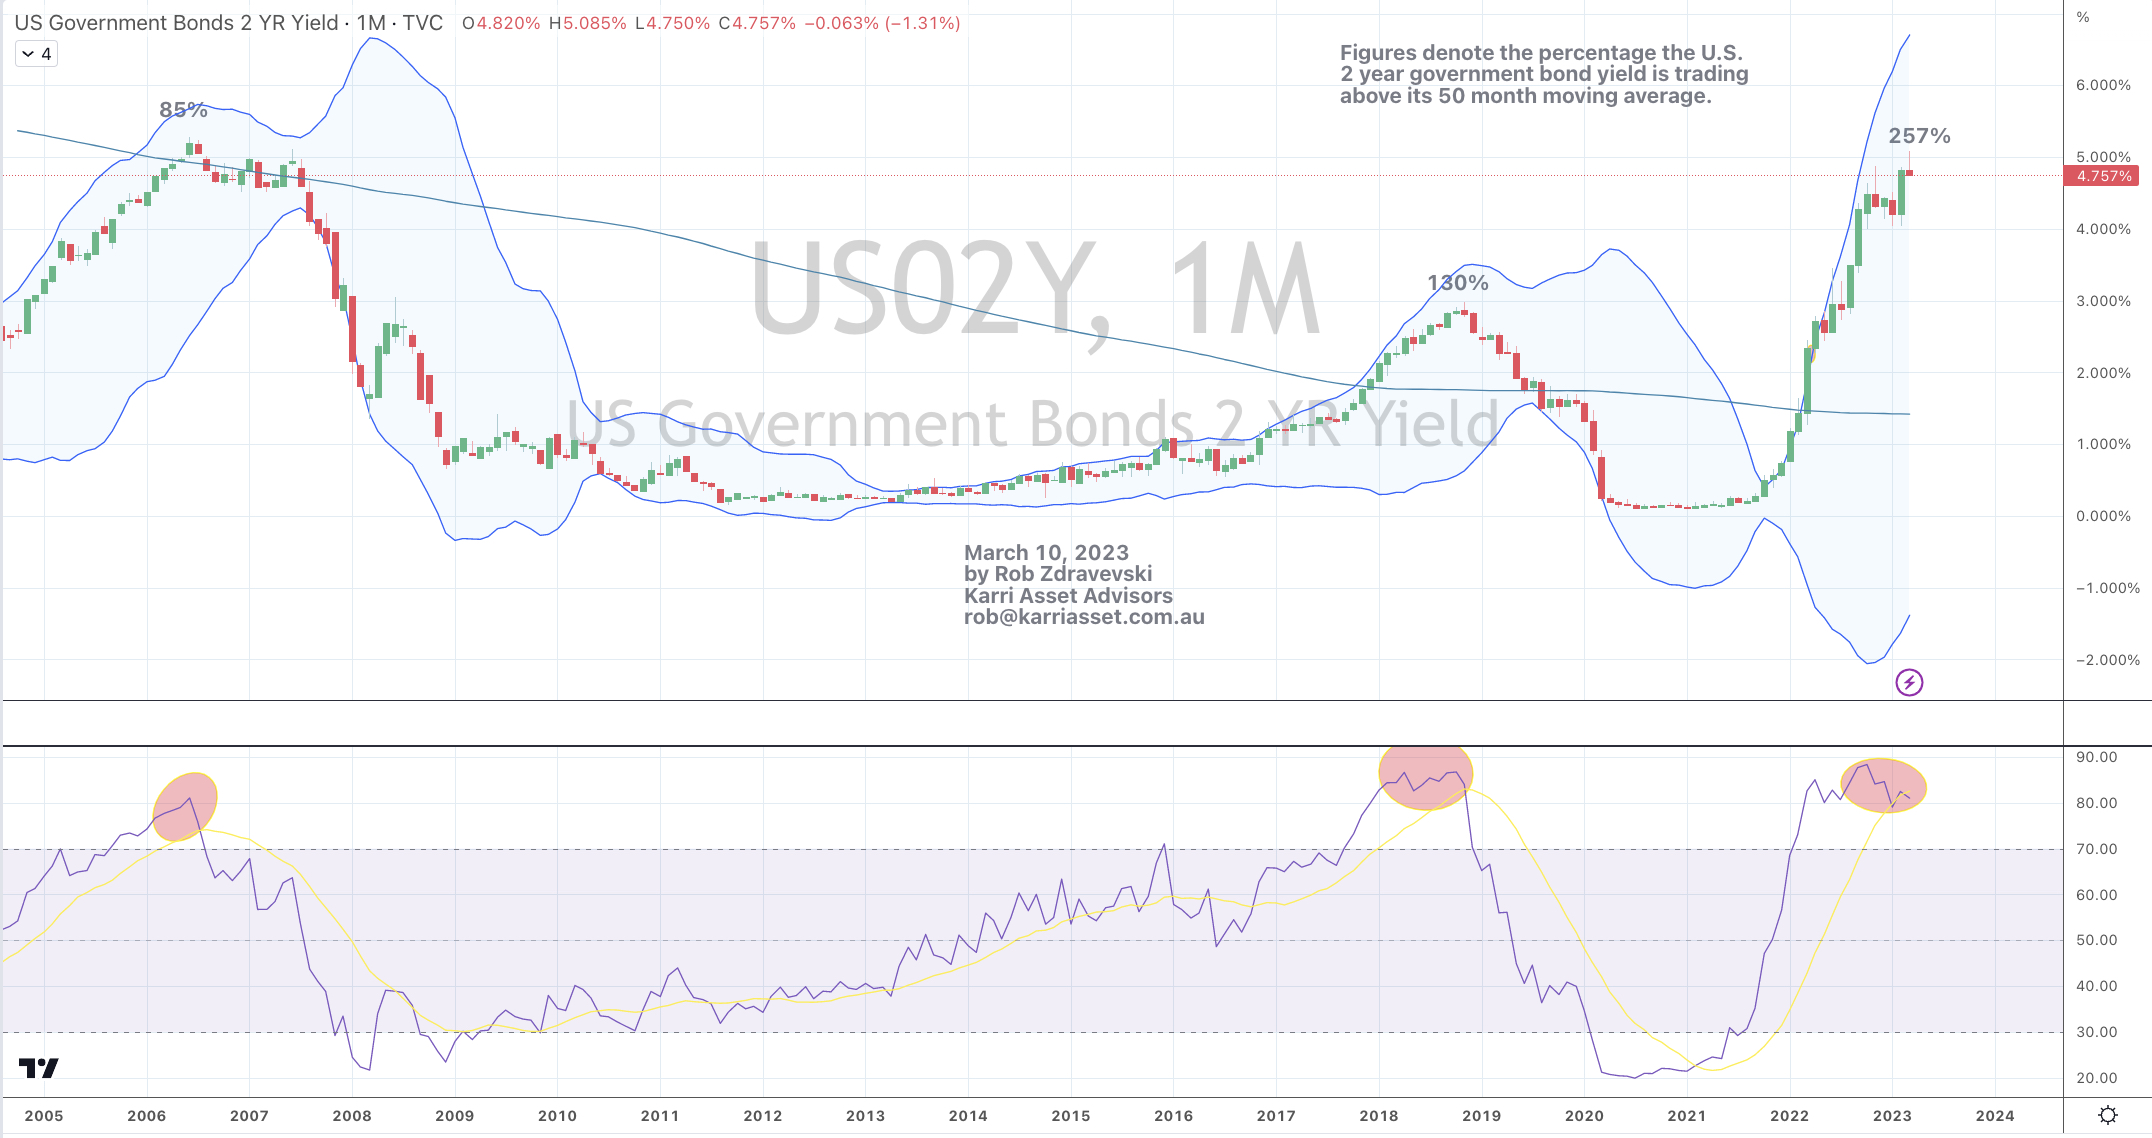
German and U.S. 2 year government bond yields 

German 5 year government bond yield

British, French, Greek, German, Spanish, Swiss and Portuguese 10 year government bond yields

U.S. 10 year break-even inflation yield rate

Bloomberg Commodity Index

S&P Goldman Sachs Commodity Index

Thomson Reuters CRB Index

Cattle

Natural Gas

Brent Crude Oil

EUR/JPY

GBP/JPY

Oversold (RSI < 30)

Chilean 2 year government bond yield

Lithium Hydroxide

Palladium

CSI 300 Index

The Oversold Quinella – Both Oversold and Traded at < 2.5 standard deviations below the weekly mean)

JKM LNG 

Notes & Ideas:

Government bond yields again fell everywhere, with the exception of British 2’s and 3’s, Japanese bond yields and U.S. ‘shorter’ duration collection of the 2’s, 5’s, 7’s and 10’s.

The U.S. 20’s and 30 year bond yields fell. Not long ago, the consensus called yields ‘higher for longer’ but only when they reached the 5% level.

You kinda wish they could make that call when yields were marching higher through the 2% mark. 

The TLT (20+ year) ETF stock price has risen 13.4% over the past 7 weeks. Prior to this advance, that ETF appeared as an ‘oversold extreme’.

The BoA 5-7 year corporate bond yield is hovering at the same yield as July 24, 2023.

The Canadian 10’s are yield at their lowest level since July 10, 2023, British 10’s are back to May 2022 levels and German 10’s are at their lowest since April 10, 2023. 

Japanese 10’s had a bullish outside reversal week.

Chilean 2 year yields have fallen for 6 consecutive weeks, while South Korean 10’s have declined for 7 straight weeks.

Equities were mainly higher for the week extending most gains from the preceding 2 weeks.

Most indices end the week with return of between 1% – 1.6%.

U.S. Banks had another big week.

The KRE Regional Banks index has risen 23% over the last 6 weeks.

Chinese indices dominated the losers for the week, again with the CSI 300 appearing in this week’s oversold list and now at the same price as seen in February 11, 2019.

The Hang Seng is at its lowest price since July 10, 2023

Germany’s DAX is at an all-time high but not yet overbought.

The following indices have risen for 6 consecutive weeks; AEX, DAX, DJ Industrials, Nasdaq Composite and Nasdaq 100, KOSPI, Sensex, Copenhagen and the S&P 500

India’s SENSEX seems to be amongst the most extended of bourses, as it trades at 31% above its 200 week moving average.

Brazil’s BOVESPA broke its 6 winning streak while the TAEIX’s 5 consecutive weeks of advance came to an end. 

And Mexico’s IPC Index extends its weekly winning streak to 7.

Commodities were mostly lower. The major losers over the week are listed below.

Coal, Steel, Tin, Cocoa and Wheat were the few which rose.

In fact, Newcastle Coal has risen 18% in the past fortnight.

U.S. MidWest Hot Rolled Coil Steel added to recent gains.

The Baltic Dry Index took a breather from its massive rally.

During its 7 week losing streak, WTI Crude Oil has sunken 19%.

Brent Crude reached an oversold extreme this week for the first time since March 2023.

Heating Oil has declined 6.5% in the past 2 weeks.

Dutch TTF Gas has fallen 32% over the past 6 weeks.

Natural Gas has slumped 30% over the past 5 weeks.

This week, the broader commodity indices reached an oversold extreme.

And relatively versus equities they are too.

Gold eased following last week’s media and LinkedIn hype

Silver, dramatically more so.

Following last week’s registration of an overbought extreme, Gold in USD fell 3.3% for the week. Silver as priced in USD tanked 10%. Not exactly the attributes of something being a store of value.

Mean reversing beckons for some commodity prices.

Orange Juice has fallen 10% in the past 2 weeks.

Uranium remains overbought for a 17th consecutive week.

Lithium Hydroxide prices are now oversold for 22 consecutive weeks.

Iron Ore broke its 7 winning streak as it fell 0.2% for the week.

While Cocoa has locked in weekly gains in 9 of its past 10, rising 25% over that time.

Amongst currencies, the Australian Dollar lower, taking a break from recent advances.

The Loonie was mostly higher against its pairs, the Euro was mixed and the GBP was weaker.

The USD was former everywhere except against the Yen,

Because the Japanese Yen rose strongly against all others.

#riskoff

The larger advancers over the past week comprised of;

Rotterdam Coal 2.7%, Cocoa 1.7%, Cotton 2.5%, HRC 4.1%, Tin 2.2%, Newcastle Coal 14.2%, Rubber 2.1%, Wheat 4.8%, DAX 2.2%, KRE Regional Bank Index 3.2%, FTSE 260 1.6%, NIFTY 3.5%, Stockholm 2.8%, SENSEX 3%, SMI 1.7%, ASX Materials 2% and the ASX 200 rose 1.7%.

For some other comparisons for the week, , the S&P Small Cap 600 advanced 1.3%, Russell 2000 climbed 1%, Nasdaq Composite rose 0.7% and S&P 500 closed 0.2% higher.

The group of decliners included;

Aluminium (3%), Bloomberg Commodity Index (3.6%), Baltic Dry Index (21.9%), WTI Crude (4.2%), Copper (2.2%), Heating Oil (3.2%), JKM LNG (1.7%), Coffee (3.9%), Cattle (2.3%), Lithium (4.9%), Natural Gas (8.3%), Nickel (1.6%), Orange Juice (5.8%), Palladium (5.8%), Platinum (1.7%), Gasoline (3.4%), Sugar (6.9%), SPGSCI (3.1%), CRB (2.9%), Dutch TTF Gas (11.3%), Brent Crude (4.1%), Gasoil (4%), Silver in AUD 8.3%), Silver in USD (9.7%), Gold in AUD (1.8%), Gold in CAD (2.6%), Gold in USD (3.3%), Oats (7.6%), Soybeans (1.6%), Shanghai (2.2%), CSI 300 (2.4%), China A50 (2.7%), DJ Transports (1.6%), HSCEI (2.8%), Hang Seng (3%) and the Nikkei 225 fell 3.4%

December 10, 2023

by Rob Zdravevski

rob@karriasset.com.au

The probability against higher interest rates

Here are the 10 notable moments over the past 50 years when the U.S. 10 year bond yield had entered Monthly overbought territory while also being at a certain percentage above its 50 month moving average and also trading up to 2 standard deviations above its rolling monthly mean. 

And today many are still betting that yields rise (and bond prices fall)…..

October 4, 2023

by Rob Zdravevski

rob@karriasset.com.au

Canadian inflation and interest rates

In my continuing story of expecting abating inflation….

Canadian inflation rates have completed their mean reversion to its 50 month moving average, as illustrated by the blue line in the chart below.

There may be one more lower print over the next month or so……

I expect Canadian interest rates to decline but not back to any type of mean.

I’ll look for the Canadian 2 year bond yields (currently 4.60%) to fall to the 4.20% – 4.05% range before rates embark on their next wave higher.

Until then, recent buyers of bonds will make money, perhaps equity like returns?

While that is playing out, I’m then looking for a 3rd wave of inflation in the form of ‘excuse inflation’ as prices of raw materials and finished products remain stubborn with sellers reluctant to discount and adjust.

It should be a short lived 3rd wave of inflation before meaningful demand destruction takes the upper hand and forces the sellers hand.

A later date, we’ll look for much more lower interest rates for the Canadian 2’s, maybe around 2.40% in a year’s time?

June 28, 2023

by Rob Zdravevski

rob@karriasset.com.au

Brazilians do it better

The blue line in the attached chart represents the Brazilian 2 year bond yield.

It has fallen from 14.8% to 11.4%.

The orange line plots Brazil’s inflation rate.

It has abated from 12% to 4%.

Today, Brazil’s inflation rate is back to where it spent most of 2018 and 2019. Funnily, it’s also at the same level as the United States.

The Brazilian central bank started hiking rates in March 2021. That was 1 year before G10 nations did.

Brazil’s central bank rates increased by a factor of 7.

From 2% to 13.75%.

They stopped raising rates in September 2022 and now for the 6th consecutive meeting have paused.

https://www.bloomberg.com/news/articles/2023-05-03/brazil-central-bank-keeps-interest-rate-rebuffing-lula-s-pressure?sref=qLOW1ygh

It would bode well for the central banks of other commodity sensitive economies such as Australia and Canada to study Brazil’s interest rate strategy, although Aussie and Canadian citizens are amongst the most indebted households in the world.

This poses a social and political risk to those central banks possibly ‘breaking the system’.

Brazilians are not so indebted.

While I expect the Brazilian 2 year bond yield to converge towards its 200 week moving average, perhaps somewhere close to 9.20%, for now bond yields are oversold and they should now hold these levels and move a little higher as will inflation.

p.s. at the bottom of this page are 3 links of recent articles I have written on the topic Brazilian interest rates.

June 16, 2023

by Rob Zdravevski

rob@karriasset.com.au

The timing involved when buying bonds and fixed income

In this note on March 16, 2023 (March 15, U.S. time), I suggested that shorter-term interest rates would start to rise when the Copper/Gold Ratio trades 2.5 standard deviations below its weekly mean and implies a poor moment of timing for those buying bonds.

As a follow up, the chart below shows what has happened to the U.S. 2 year bond yield since then.

Having risen from 3.9% to 4.68%, that extreme standard deviation low in the Copper/Gold Ratio did represent a ‘bull trap’ for bond buyers.

May 30, 2023

by Rob Zdravevski

Karri Asset Advisors

rob@karriasset.com.au

Brazil attacked inflation early

Brazil commenced raising interest rates in the 1st quarter of 2021. The central bank rate climbed from 2% to 13.75% which represents a 6-fold increase.

Brazil conducted 12 rate hikes.

The U.S. commenced hiking rates 12 months later year later, in the 1st quarter of 2022. The fed funds rate have risen by a factor of 9 (from 0.5% to 5%).

The U.S. has raised interest rates 9 consecutive times.

Brazilian’s carry a Household Debt to GDP ratio of 34%.

The Americans have 75%

Aussies are sitting on at 114%

The chart below shows the Brazilian 10 year bond yield compared to the Brazilian inflation rate.

Brazil addressed their rate hikes much earlier and when coupled with the halving of many commodity prices since their 2022 peak) has seen the Brazilian inflation fall from 12% to 5.6%

March 29, 2023

by Rob Zdravevski

rob@karriasset.com.au

Interest Rates are extended

Here are 3 general moments when U.S. 2 year bond yields were extended.

We’re amongst one of those moments now.

If you are not a buyer of bonds, this study also implies that you shouldn’t lock in or fix your borrowing rate.

I predict a large hyperventilating fear campaign from banks and mortgage brokers trying to convince borrowers to lock in their interest rates.

In turn, real estate agents will try to persuade their vendors to lower their selling prices because “rates are going much much higher”.

I think this is another case of ‘people doing the wrong thing, at the wrong time’.

March 10, 2023

by Rob Zdravevski

rob@karriasset.com.au

Lower bond yields ahead?

With all the connotations and effects that come with bond buyers prevailing as the more aggressive, I see bond yields declining into the next year.

The figures in the chart below denote the percentage that the U.S. 2 year government bond yield is trading above its 50 month moving average.

Obviously, taking a larger view and trying to get the bigger call correct.

Allowing for convergence, I think this yield makes its way towards the 2.75% region in 12 months time.

It’s currently 4.43%

February 7, 2023

by Rob Zdravevski

rob@karriasset.com.au

Auto Loans inversely correlated with interest rates

I think that interest rates moderate in the coming months back to a ‘normalised’ level from which to work from, into the next cycle.

To position for this thesis, I could buy bonds, a bond ETF, treasury futures……

I’m thinking of expressing this (investment) view by looking at companies who provide automobile loans.

Perhaps those who are focused on sub or near prime credit risks?

Auto loans become more expensive as rates rise. Cars (new and used) are more expensive. Vehicle ownership is still desired.

But getting exposure to this idea through bank and credit unions is lost amongst their other business lines.

I’ll dig through a company such as Open Lending (LPRO.US). They help lenders in assessing risk to car loan applicants.

My interest was piqued when I overlaid the price chart of LPRO against the U.S. 2 year bond yield. High interest rates is bad for Open Lending’s business. What if the opposite occurred?

November 22, 2022

by Rob Zdravevski

rob@karriasset.com.au