Soybeans are oversold
July 14, 2024 Leave a comment
…..cheaper protein
Would you like to see how the price of soybeans dances with the U.S. inflation rate?
#tofu
July 13, 2024

Trying to hear what's not being said
July 14, 2024 Leave a comment
…..cheaper protein
Would you like to see how the price of soybeans dances with the U.S. inflation rate?
#tofu
July 13, 2024
May 2, 2024 Leave a comment
Following my pithy comment about food, calories and fertiliser,
readers can track my historical posts about this topic here,
https://lnkd.in/gJ-2rQh8
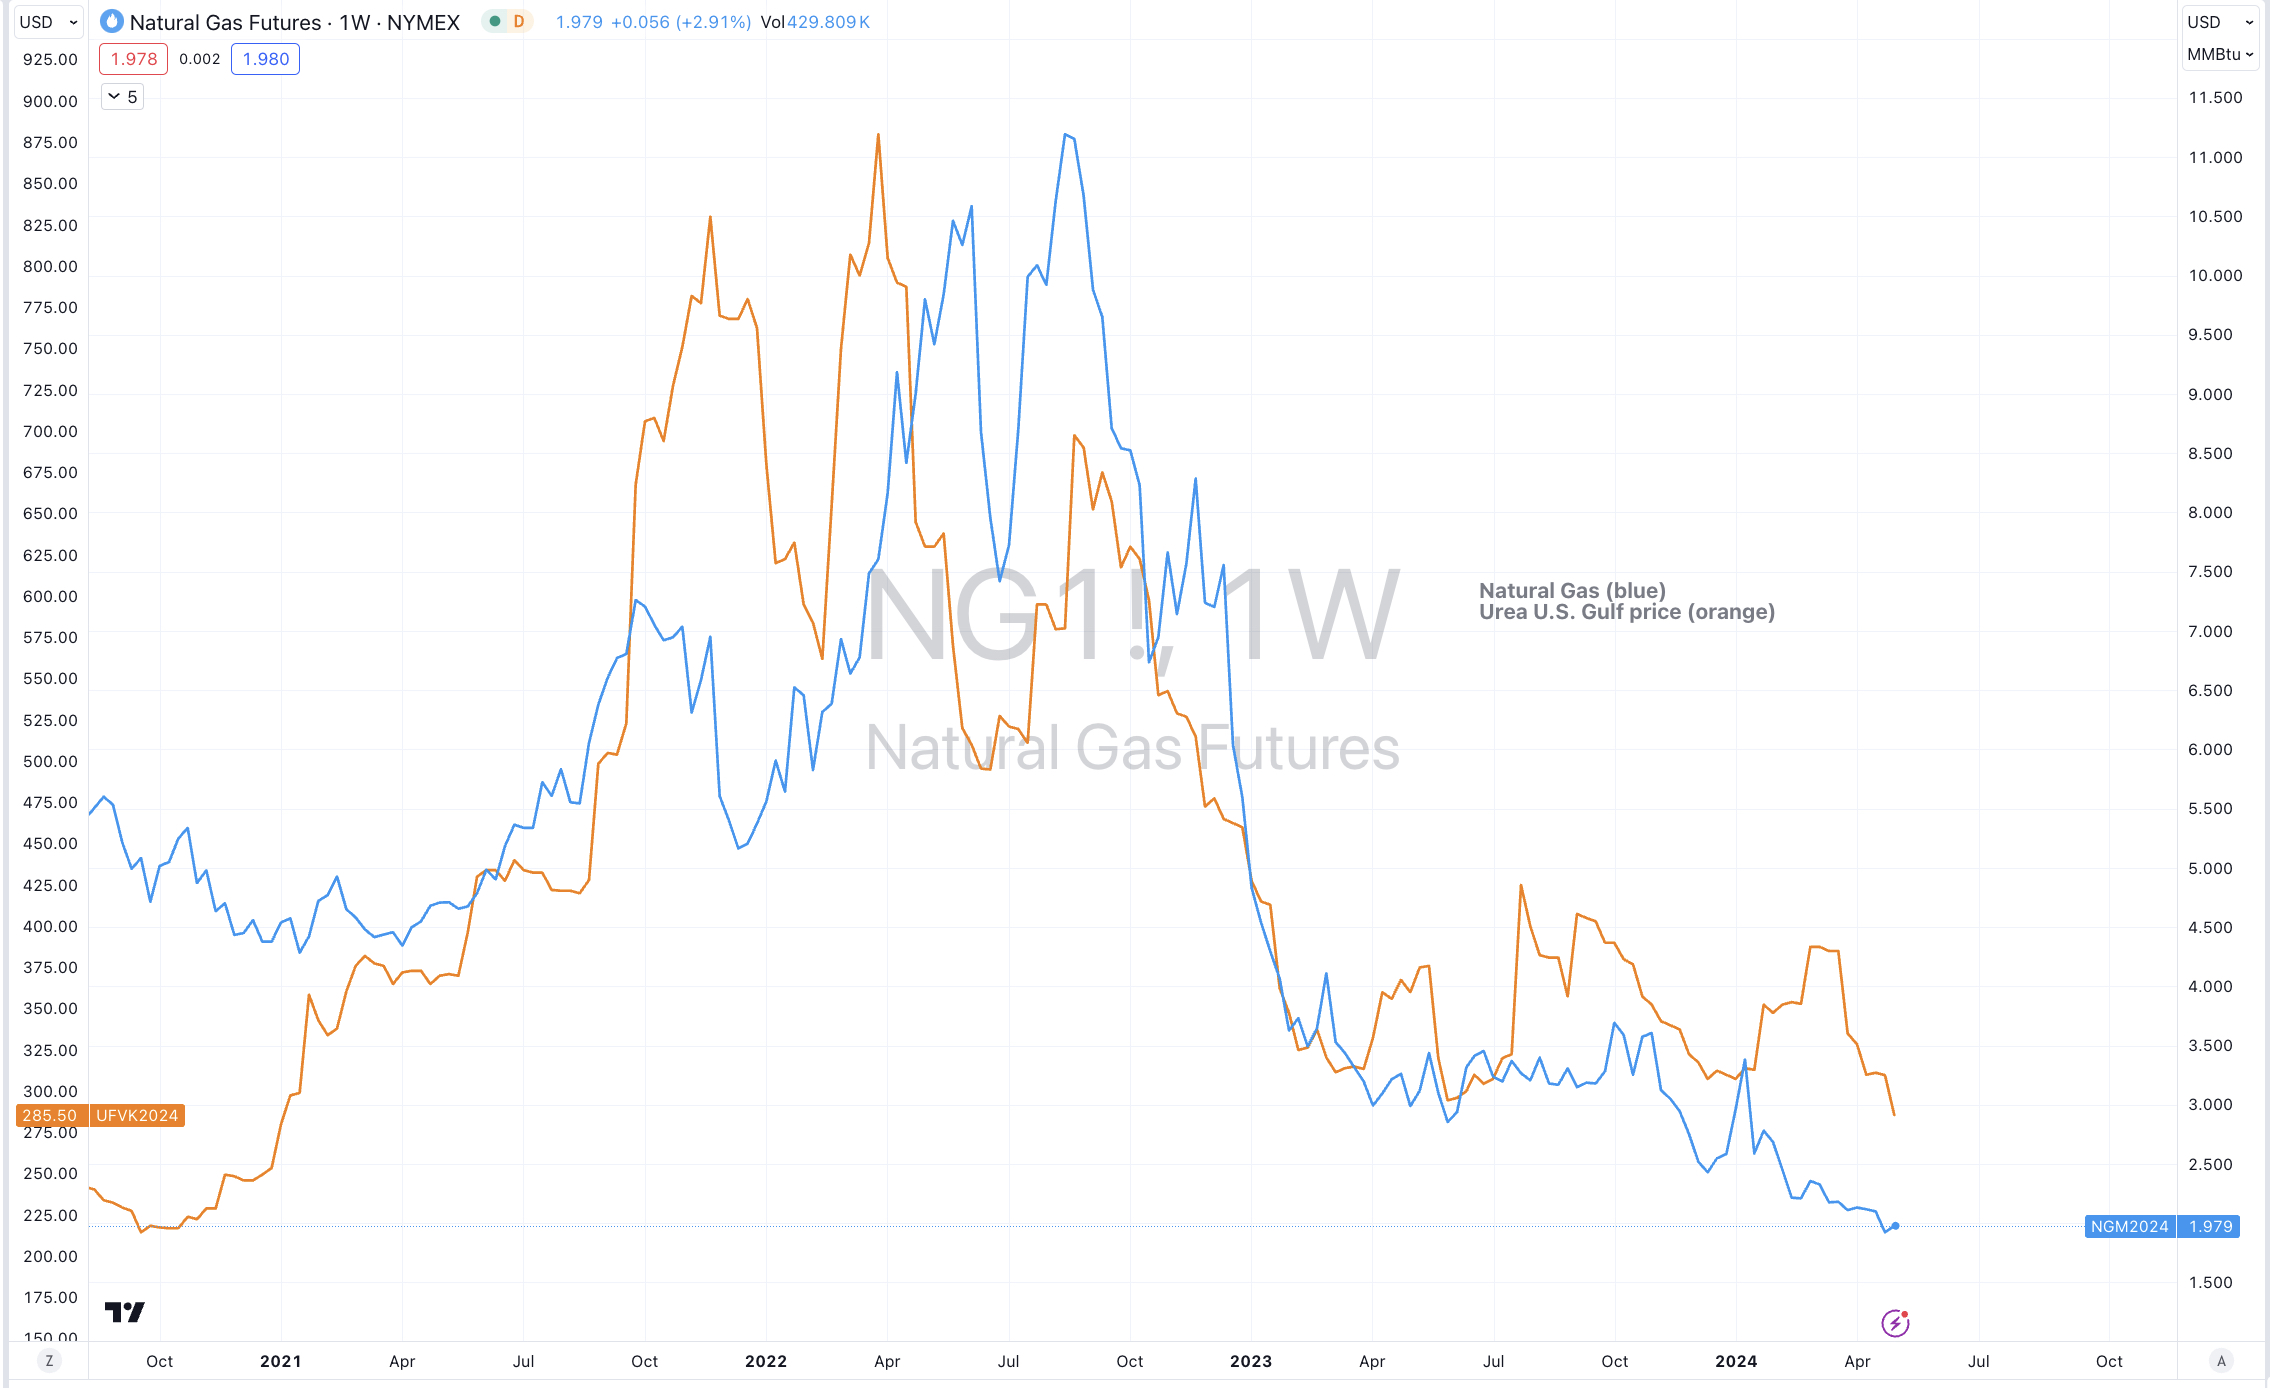
There is continuity in those posts about the relationship that fertiliser prices have with the price of Natural Gas.
The chart below is the latest illustration and update between the U.S. Gulf Urea price and the Henry Hub Natural Gas price.
May 2, 2024
by Rob Zdravevski
rob@karriasset.com.au
May 2, 2024 Leave a comment
I remember all of that noise around Urea, Fertiliser, Nitrogen, Grains and the world requiring calories……
……now not so much.
#contrarian
January 7, 2022 Leave a comment
Lately, I’ve been writing about the price of wheat, which prompted a review of a post I wrote in 2012 where I discuss one of my favourite uses of (durum) wheat, being Pasta.
In the original 2012 post I was willing Great Britain to lift its consumption game.
https://robzdravevski.com/2012/09/02/global-pasta-consumption-room-for-growth/
The source of the figures below is from possibly one of the world’s most important organisations, being the International Pasta Organisation. Watch out OPEC…..
They have a clear mission…… THEY ARE NON PROFIT ASSOCIATION DEDICATED TO INCREASE PASTA CONSUMPTION AND AWARENESS…….
Here is a list of the average amount of kilograms of pasta each resident in the following country consumed in 2011
Italy 26.0 kg
Venezuela 13.0 kg
Tunisia 11.9 kg
Greece 10.4 kg
USA 8.8 kg
Chile 8.4 kg
France 8.0 kg
Germany 7.9 kg
Argentina 7.2 kg
Iran 7.0 kg
Portugal 6.6 kg
Turkey 6.4 kg
Brazil 6.4 kg
Czech Republic 6.0 kg
U.K. 2.5 kg
Then. in 2019, they consumed…..
Italy 23.1 kg
Tunisia 17 kg
Venezuela 12 kg
Greece 11.4 kg
Chile 9.5 kg
USA 9 kg
Argentina 8.7 kg
Turkey 8.6 kg
Iran 8.7 kg
France 8.1 kg
Germany 7.7 kg
Portugal 6.5 kg
Czech Republic 6.5 kg
Brazil 5.8 kg
U.K. 3.5 kg
Surprisingly, Italian and Brazilian consumption declined through the decade.
Argentine and Turkish consumption increased handsomely, while Tunisians and Brits ate 40% more pasta on a per capital basis.
Incidentally, the largest pasta consumption market is the United States at 2.7 million tons, followed by Italy at 1.4 million tons and then Brazil is third at 1.2 million tons.
Overall, total global pasta production has grown from 12.5 million tons in 2011 to 16 million in 2019.
I wonder if many Italians emigrated to Argentina over that time to account for the decline in Italy and an increase in Argentina ??
January 7, 2021
by Rob Zdravevski
rob@karriasset.com.au
July 12, 2021 Leave a comment
Wheat has retraced 78.6% of the advance from December 2020.
It’s nearly oversold, it may have a little further, down to the trend line at $6.10 but the ‘fat part’ of the short trade has been had.
On a weekly basis, other technicals suggest similar metrics, coincidences of touching a 50 Week Moving Average, reaching 2.5 standard deviations below its mean and other exhaustions.
Away from technicals, supply fundamentals seem favourable for higher prices again.
July 12, 2021
by Rob Zdravevski
rob@karriasset.com.au

