My work suggests that this ‘trading’ bounce in many markets, assets and securities may see an end in the first couple days of the coming week.
The recent market advance has been a combination of a ‘bounce’ occurring once prices satisfied a host of mean reversions and extremes, coupled with notable pessimism and bearish investor readings along with short covering and ‘benchmarking’.
Because when mature, large index weighted Goliath’s such as Apple and Amazon rise 20% over a 4 week span, benchmarked money managers need to buy (chase) those and other stocks which are trending higher, in order to stay close to the index returns and the performance of their competitors.
Many fund managers have expressed a view to me over many years, similar to, “it sucks being benchmarked”.
But if you did benefit from the ‘fat part of the trade, let’s sell and pack up for the rest of the year and go on holiday?
After all, that is more than a year’s adequate return all within 30 days.
Alas! Many of us won’t do that. It wouldn’t be fun (sic) until we squandered half of those gains, which then keeps us at the table for the rest of the year.
In all seriousness, there are many gap-up’s that markets will back and fill.
The setup in the weeks ahead should be a safer moment to accumulate for those longer-term investors.
The following assets (on a weekly timeframe) registered an Overbought or Oversold reading and/or have traded more than 2.5 standard deviations above or below its rolling mean.
Extremes “above” the Mean (at least 2.5 standard deviations)
None
Overbought (RSI > 70)
None
The Overbought Quinella – Both Overbought and Traded at > 2.5 standard deviations above the weekly mean)
None
Extremes “below” the Mean (at least 2.5 standard deviations)
Japanese government 10 year bond yield
Sugar
Oversold (RSI < 30)
U.S. 10 year minus U.S. 5 year government bond yield
U.S. 5 year minus 3 month government bond yield
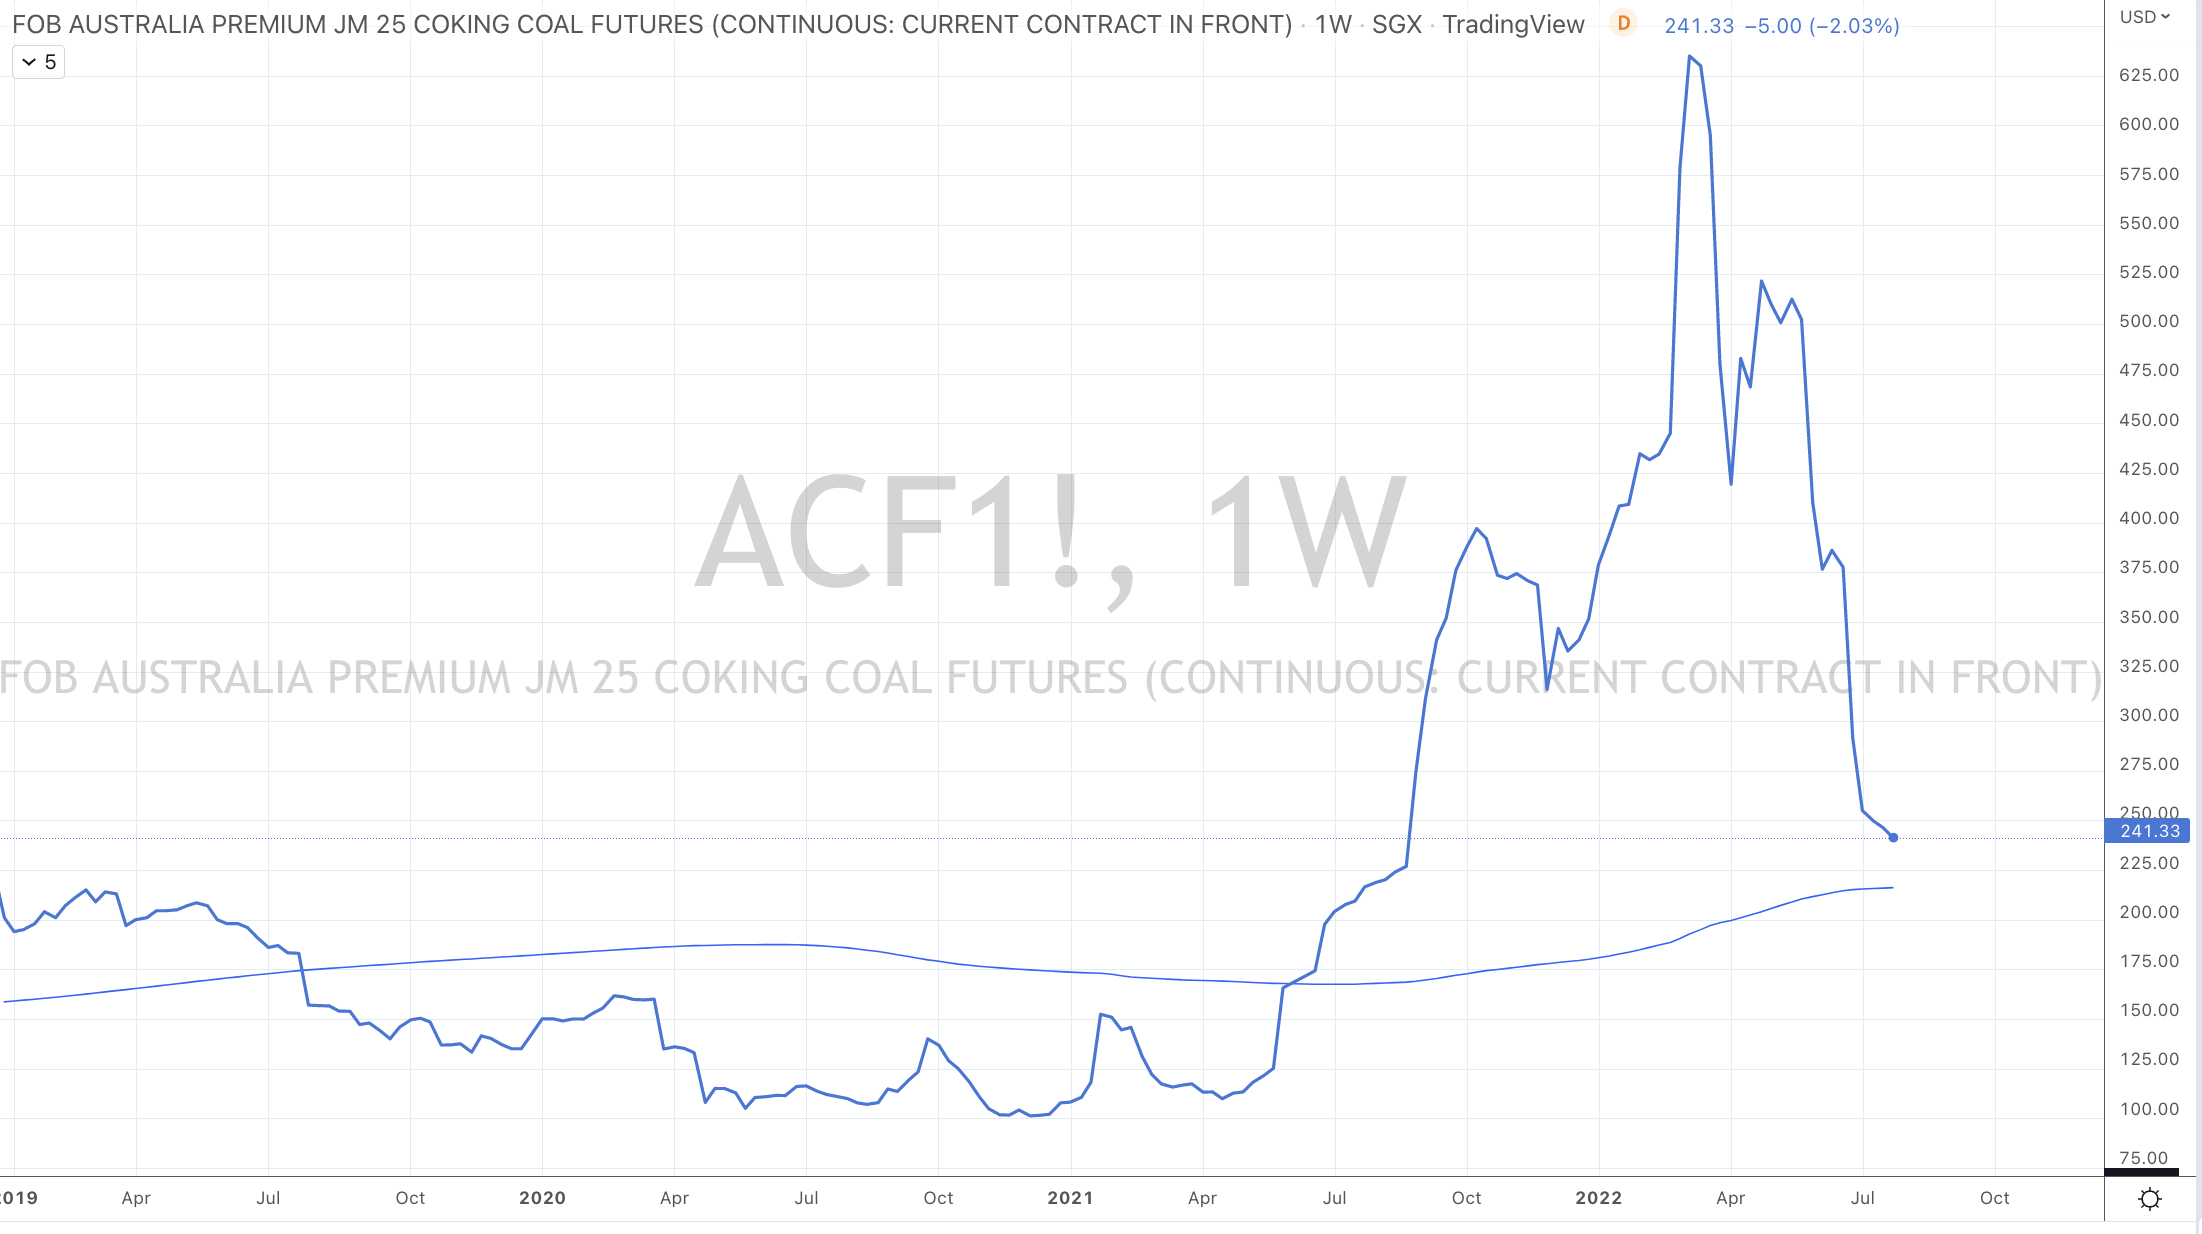
Australian Coking Coal (it also reverted to its 200 week moving average)
Hot Rolled Coiled Steel
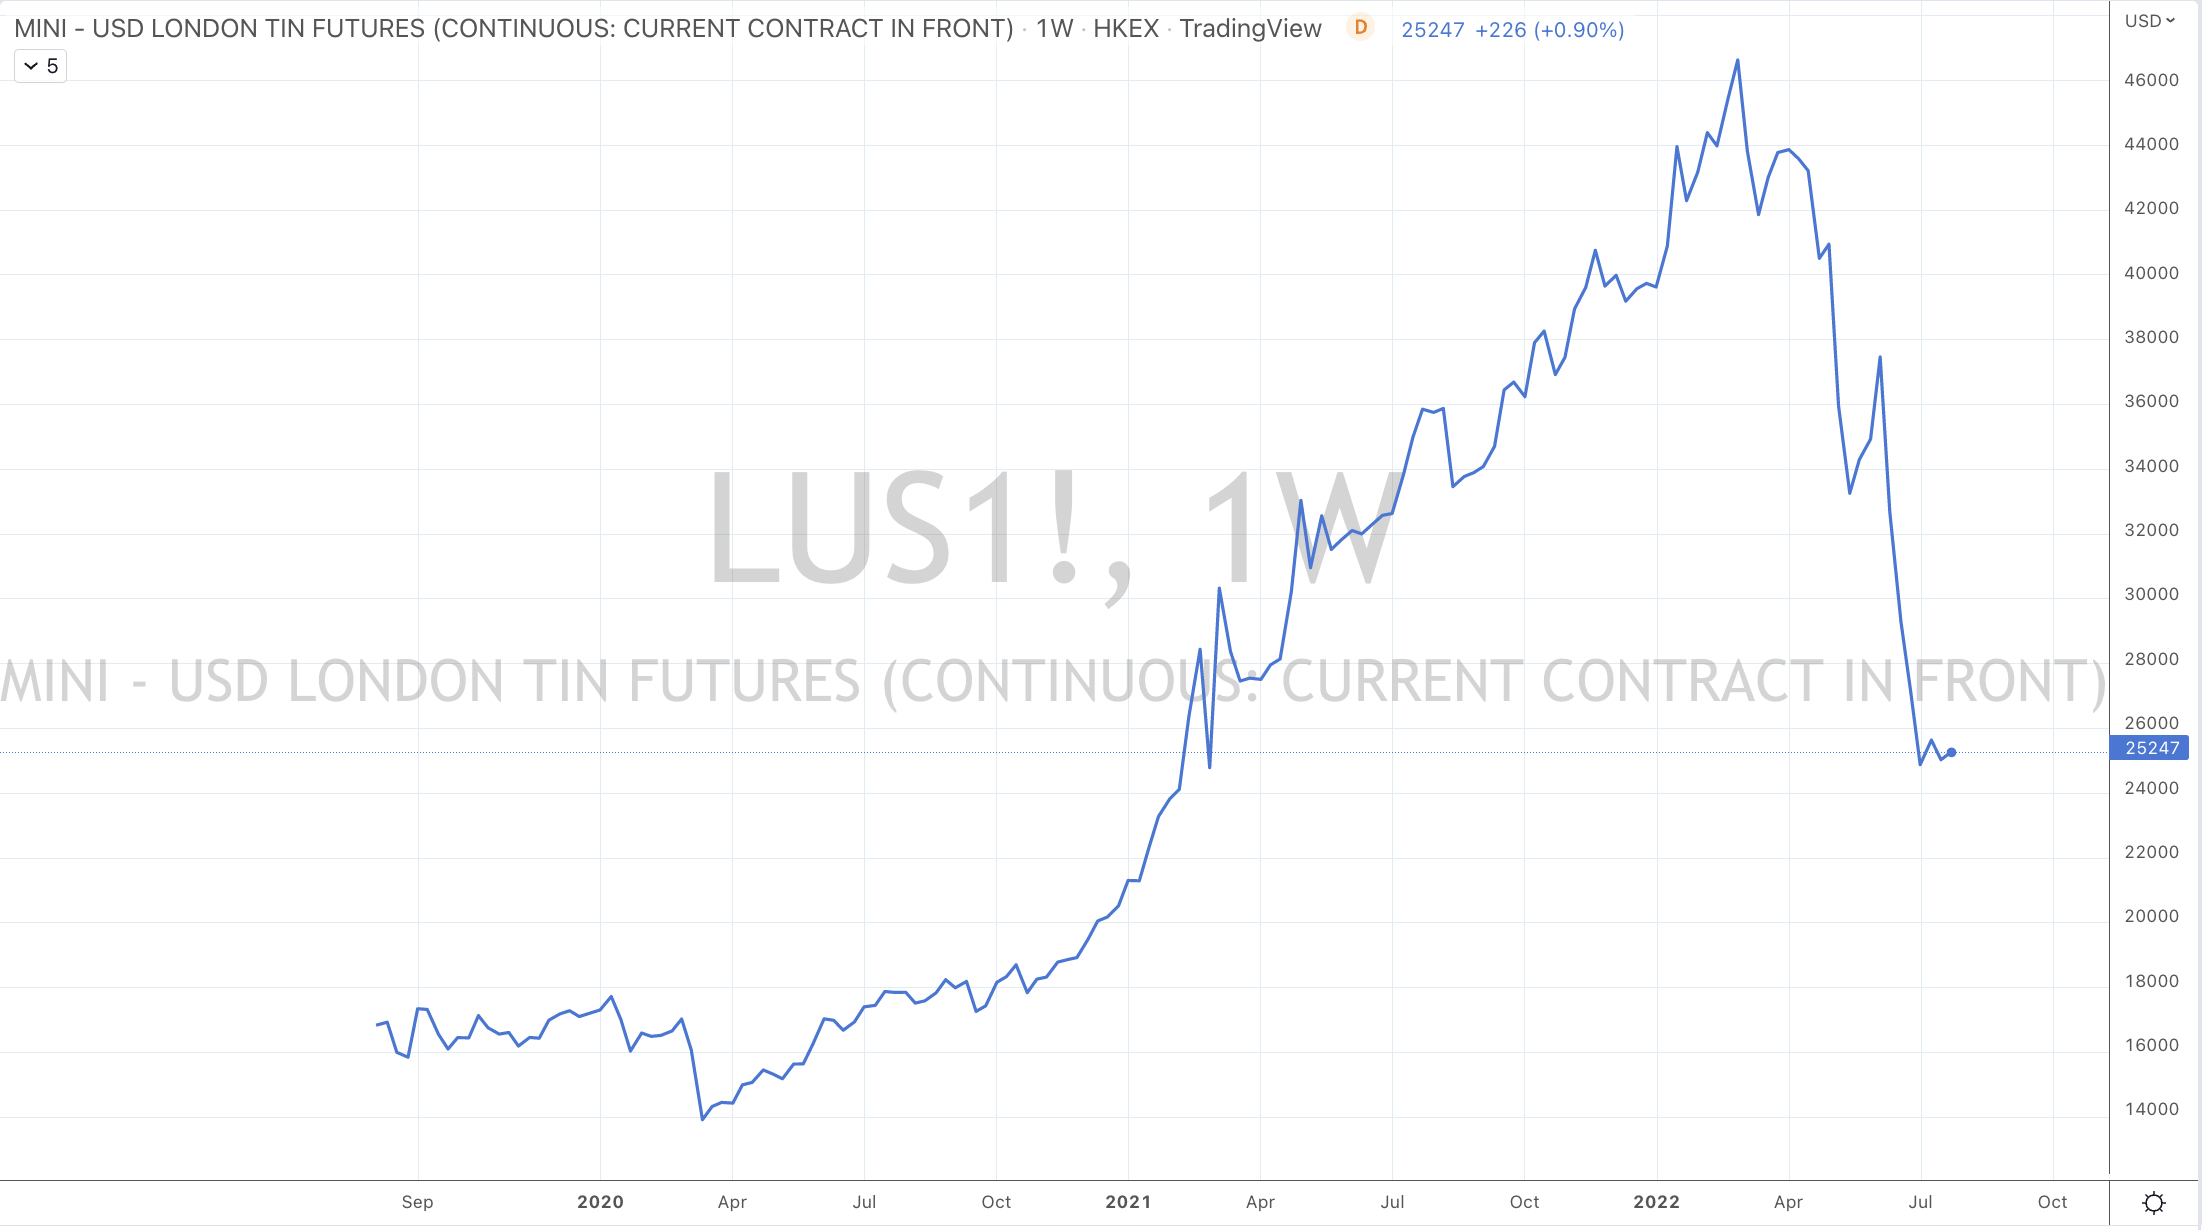
Tin
The Oversold Quinella – Both Overbought and Traded at > 2.5 standard deviations above the weekly mean)
None
Notes & Ideas:
This past week’s big news was the continued and stronger rally in equities and the notable absence of oversold commodities and currencies from the list. They have all ventured away from their recent ‘extremes’.
The list below highlights those with the larger weekly percentage rates of change.
Extreme measures were telling us to expect a bounce. Recent editions of ‘Macro Extremes’ and my blog posts flagged oversold extreme lows in various equity indices (and some commodities and currencies) since June 13, 2022.
In fact, last week’s ‘Macro Extremes’ re-visited that point.
Those equity indices have risen between 6% and 15% over the past 6 weeks.
Some examples include Amsterdam’s AEX rise of 13%, the Russell 2000, Nasdaq and MidCap 400 have risen in the vicinity of 14% while Switzerland’s SMI and Australia’s ASX 200 have improved 7%.
Specific stocks have been more impressive. Rockwell Automation and Nucor have risen 25% in only 4 weeks.
I also found it interesting that the Nasdaq Biotech Index only rose 0.2% for the week. Although that index is 17% above its mid- June low, it has eased 4% from its recent high, 3 weeks ago.
My work suggests that this ‘trading’ bounce in many markets, assets and securities may see an end in the first couple days of the coming week.
The recent market advance has been a combination of a ‘bounce’ occurring once prices satisfied a host of mean reversions and extremes, coupled with notable pessimism and bearish investor readings along with short covering and ‘benchmarking’.
Because when mature, large index weighted Goliath’s such as Apple and Amazon rise 20% over a 4 week span, benchmarked money managers need to buy (chase) those and other stocks which are trending higher, in order to stay close to the index returns and the performance of their competitors.
Many fund managers have expressed a view to me over many years, similar to, “it sucks being benchmarked”.
But if you did benefit from the ‘fat part of the trade, let’s sell and pack up for the rest of the year and go on holiday?
After all, that is more than a year’s adequate return all within 30 days.
Alas! Many of us won’t do that. It wouldn’t be fun (sic) until we squandered half of those gains, which then keeps us at the table for the rest of the year.
In all seriousness, there are many gap-up’s that markets will back and fill.
The setup in the weeks ahead should be a safer moment to accumulate for those longer-term investors.
The U.S. yield curve remains inverted for the 5th week in a row and oversold for 3 consecutive weeks while the U.S. 5 year minus 3 month yield spread also remain oversold.
I’ve also got some work do in the LNG and Gas market this week. Specifically, the Dutch TTF Gas price rose 20% on the week and now has seen a 130% rise (from EUR 83 to EUR 191) over the past 7 weeks.
Incidentally, Brent Crude Oil eked a gain of only 0.03% which is a contrast to other rallies in the energy complex.
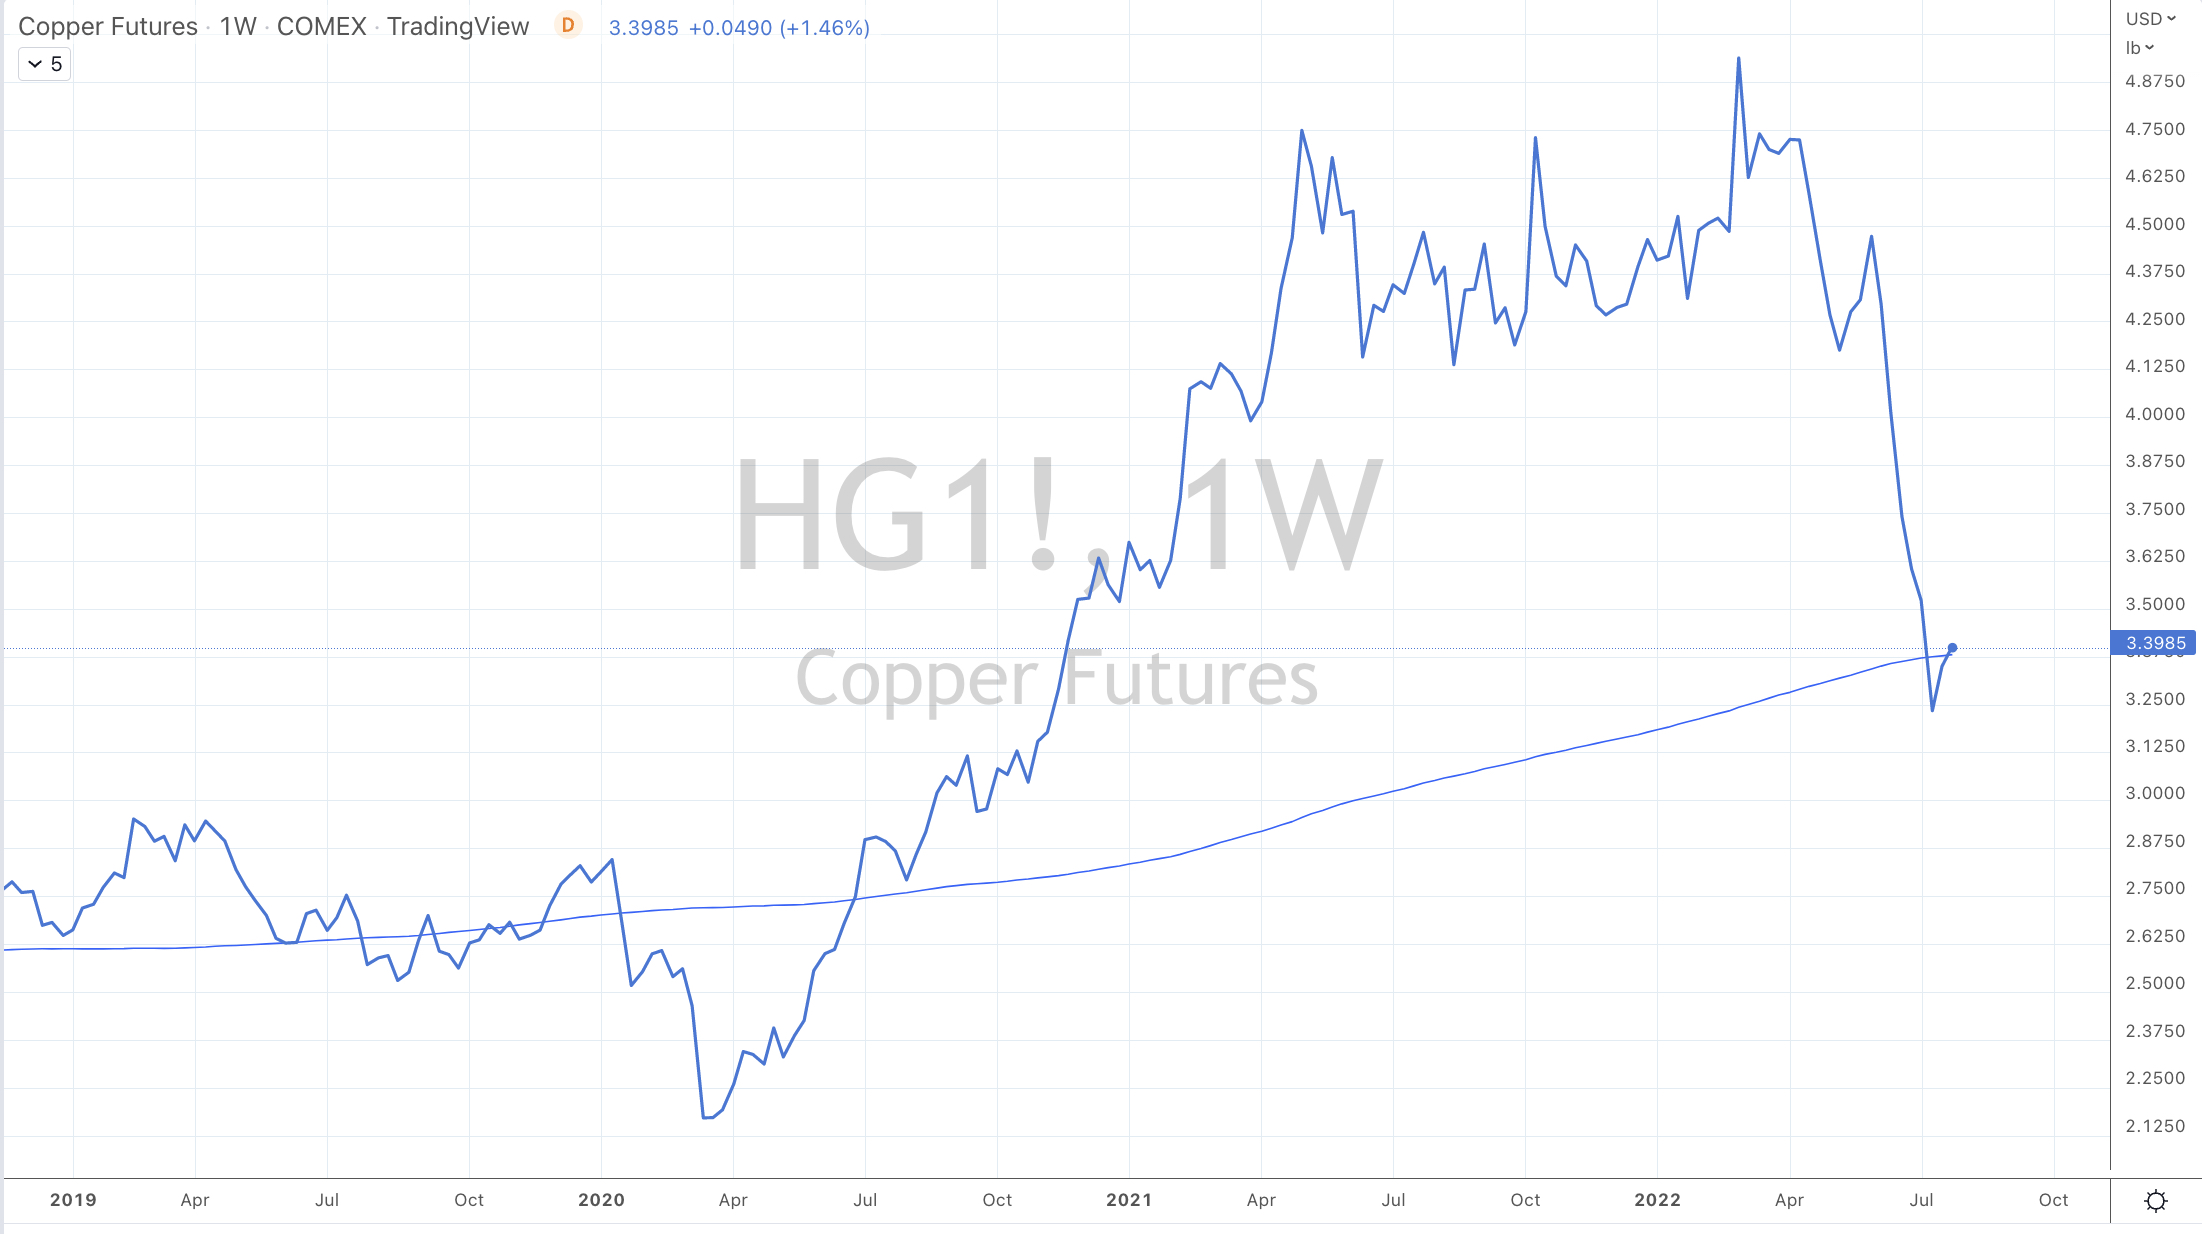
While Copper and Silver rose 7% and 9% respectively for the week, after being entrants in the previous week’s oversold categories. Copper has risen 13% from its fortnight intra-day low.
Furthermore, during the week, the AUD Silver reached my Buy price of $26.50. It closed Friday’s trading 10% higher at $29.12.
In currency land, the Chilean Peso strengthened 5.2% (I’ll write about that later in terms of a Copper trade) and the Japanese Yen firmed 2% against the USD, which added to last week’s 2% rise.
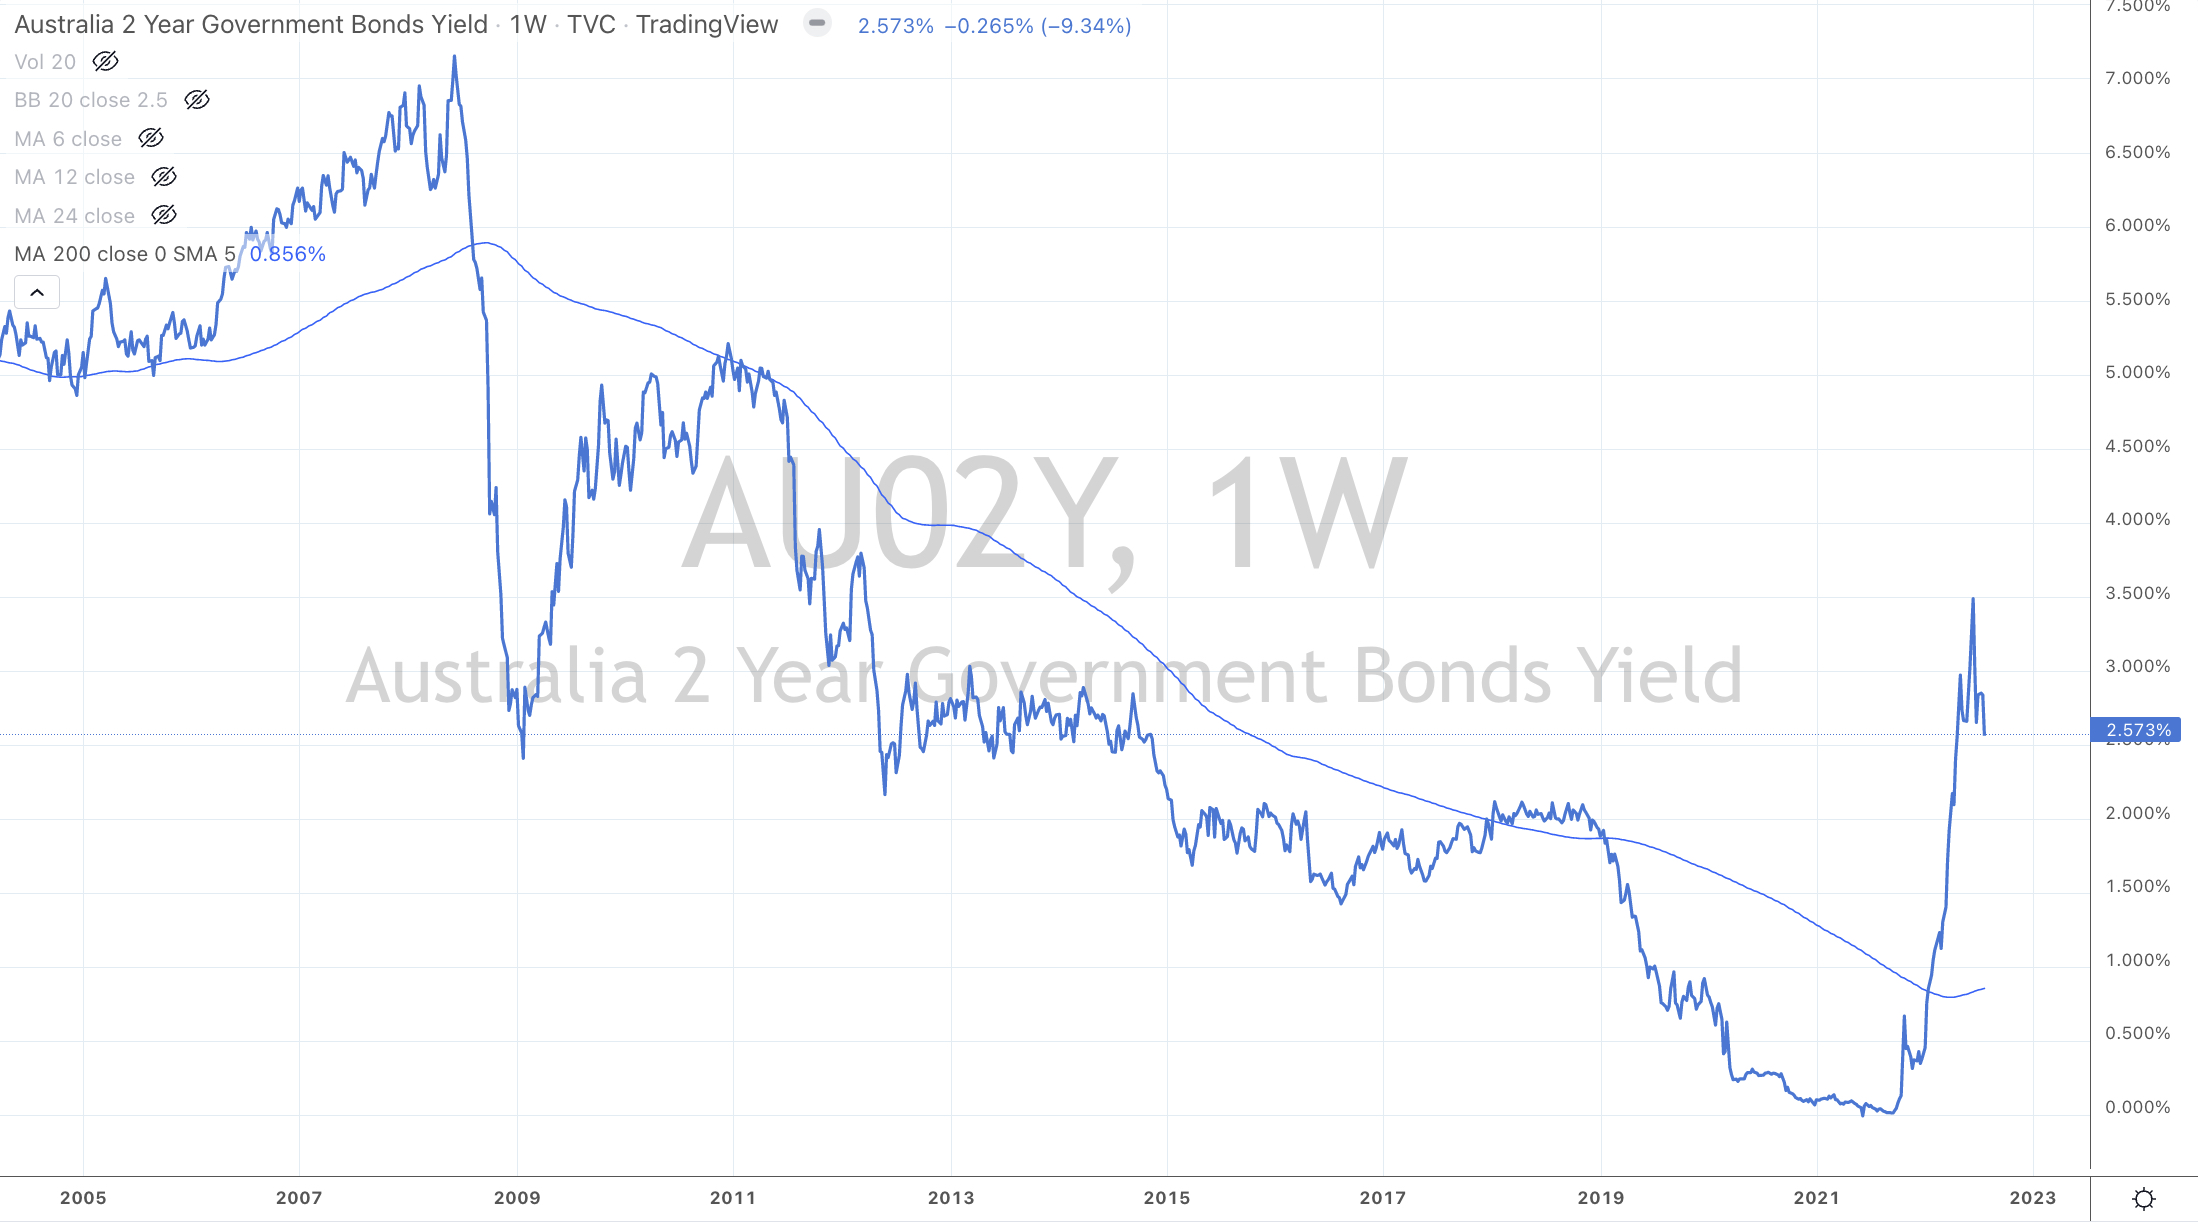
Bond yields continue to fall meaning that the bond buyers were the more aggressive, as yields are other longer journey to mean revering.
For example, the Australian 2 year bond yield has fallen from 3.60% in the past 4 weeks to 2.57%. I think, it’s plausible that it works its way down to the 1.55% mark over the coming months.
More on this in an another note which will be based on the higher probability of sharper retracements and mean reversions being seen following parabolic price moves.
Since those lows in equities around June 13-16, 2022, we have seen a peak in bond yields such as the French 10’s declining from 2.48% to 1.39% and the German 2’s have fallen from 1.30% to 0.27%.
What if the German 2’s or the Swiss 10’s go back to a negative yield?
Good for technology stocks perhaps?
While a major ‘short trade’ in government bonds has made many a sizeable fortune over the past 18 months, staying ‘short forever’ has also become known as the ‘widow maker trade’ where many have lost fortunes especially in the case of shorting Japanese 10 year bonds.
A possible or ‘pending’ mean reversion in bond yields is bigger deal than the one currently occurring in the equity market. I feel a seperate blog post is required for this topic.
The larger advancers over the past week comprised of;
Bloomberg Commodity Index 4.6%, WTI Crude Oil 4.1%, Gasoil 3.7%, Gold 3.2%, Copper 6.7%, JKM LNG 7.5%, Coffee 3.5%, Heating Oil 4.9%, JKM LNG 8.3%, Coffee 5.1%, Orange Juice 12.5%, Palladium 5.5%, Platinum 2.6%, Silver 8.5%, CRB Index 3.9%, Cotton 3.7%, Dutch TTF Gas 19.4%, Urea Florida Gulf 16.4%, Urea Middle East 19.9%, Silver in AUD 8.4%, Silver in USD 9.4%, Corn 9.2%, Oats 2.8%, Soybeans 11.6%, Wheat 6.4%, AEX 3.5%, KBW Banks 2.2%, CAC 3.7%, DAX 1.7%, Dow Jones Industrials 3%, DJ Transports 5.8%, MIB 5.6%, Bovespa 4.3%, MOEX 5.6%, Kospi 2.4%, S&P MidCap 400 4.9%, Nasdaq 100 4.5%, Sensex 2.6%, Oslo 4.1%, Copenhagen 3.1%, Helsinki 3%, Stockholm 2.7%, Russell 2000 4.3%, SOX 4.4%, S&P 500 4.3%, FTSE 100 2%, Australia’s ASX 200 2.3%, Istanbul 2.3%, Toronto’s TSX 3.7%, S&P SmallCap 600 4.7% and the Nasdaq Composite soared 4.7%.
The group of decliners included;
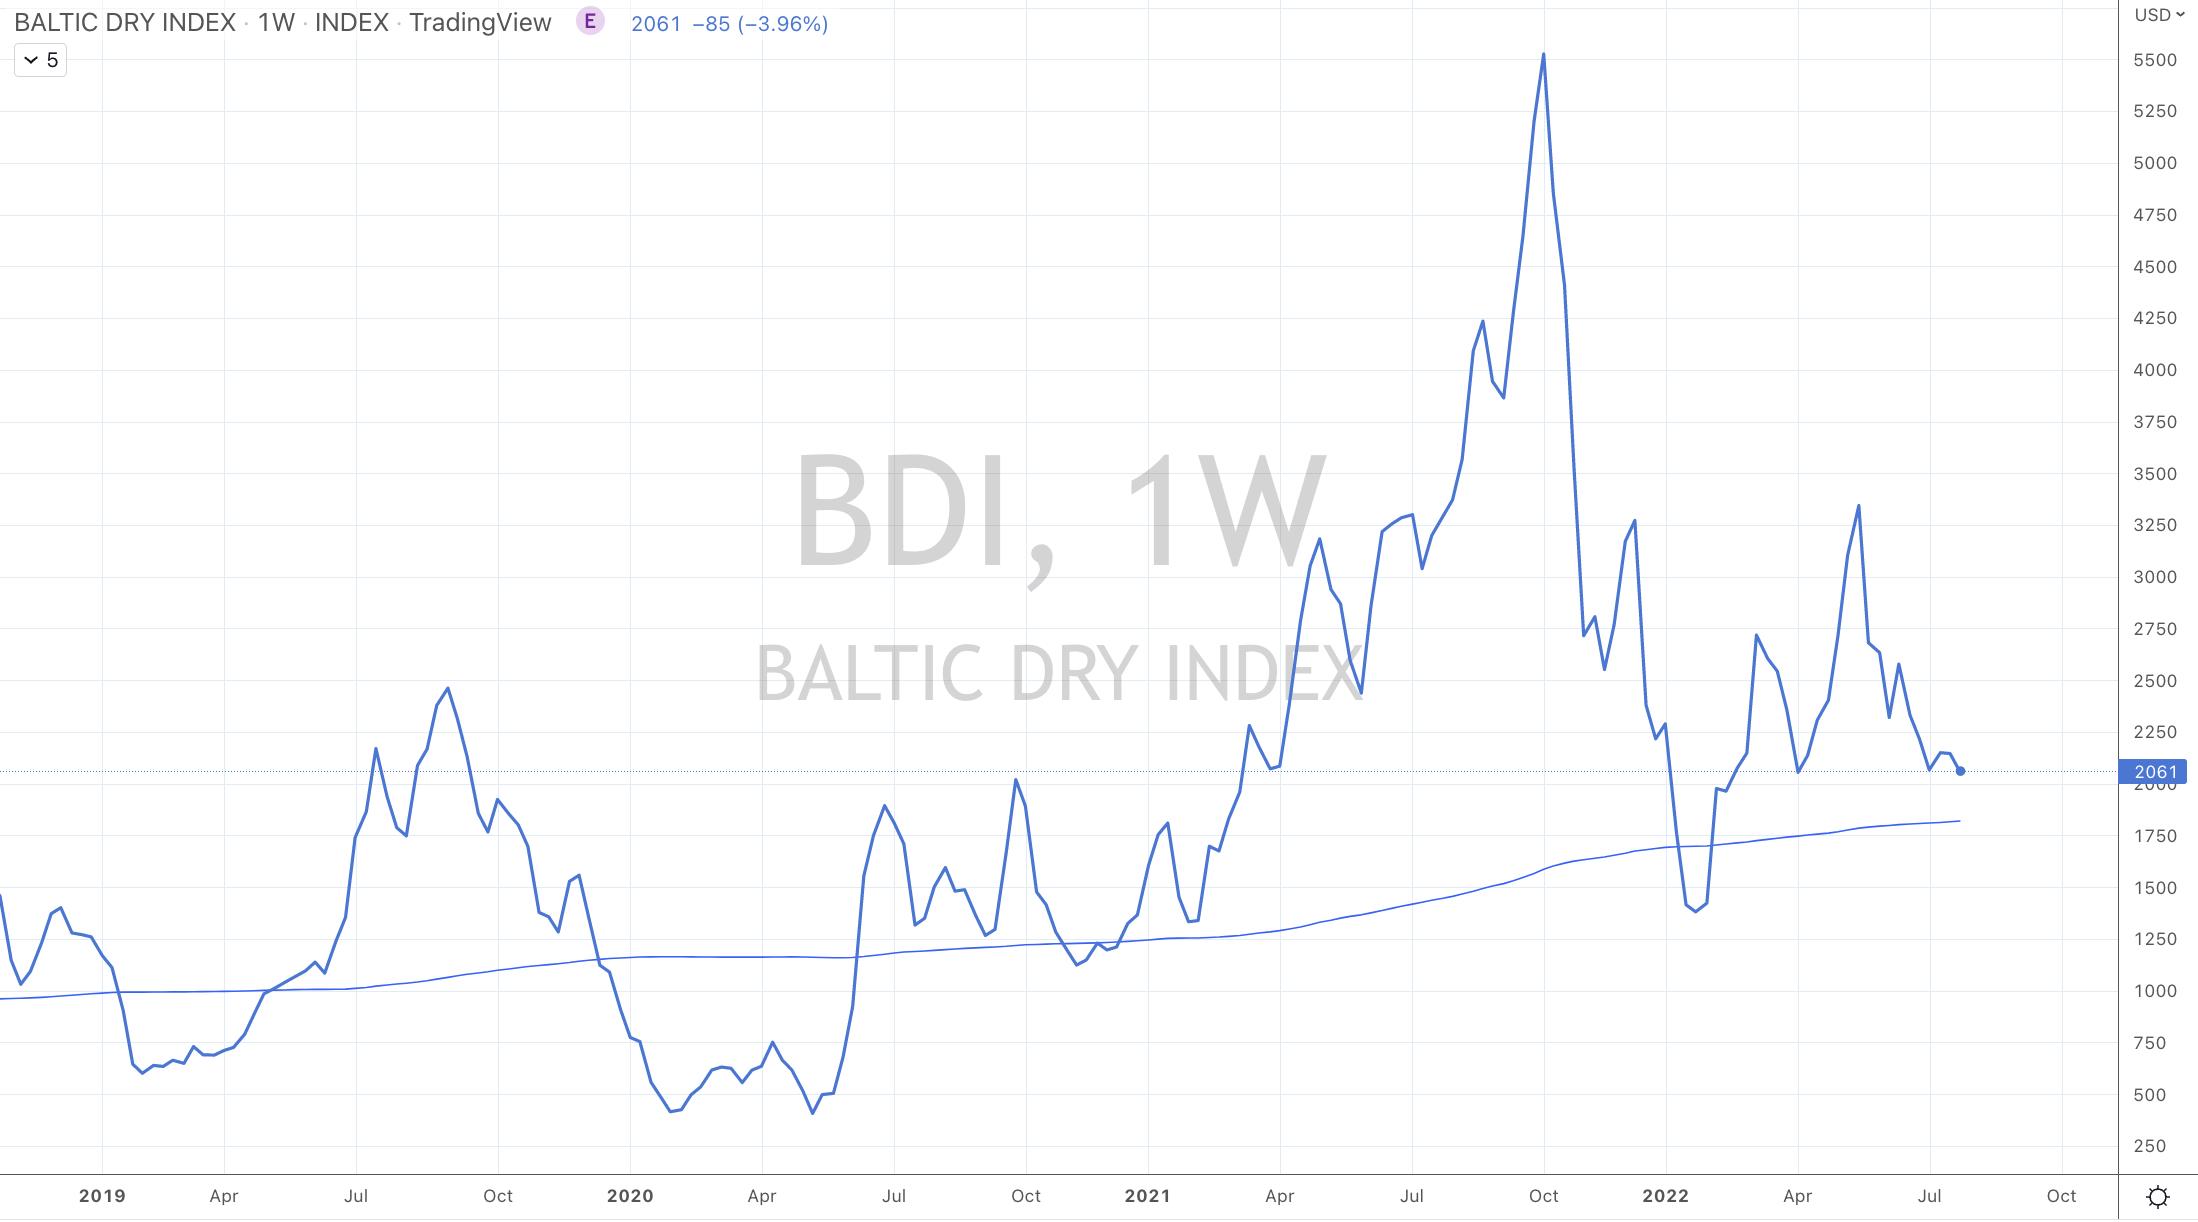
Australian Coking Coal (19.2%), Baltic Dry Index (11.7%), Hot Rolled Coiled Steel (7.4%), Lumber (9.9%), LNG (6.6%), Gasoline (3.4%), Sugar (2%), CSI 300 (1.6%), HSCEI (3.1%) and the Hang Seng Index fell 2.2%.
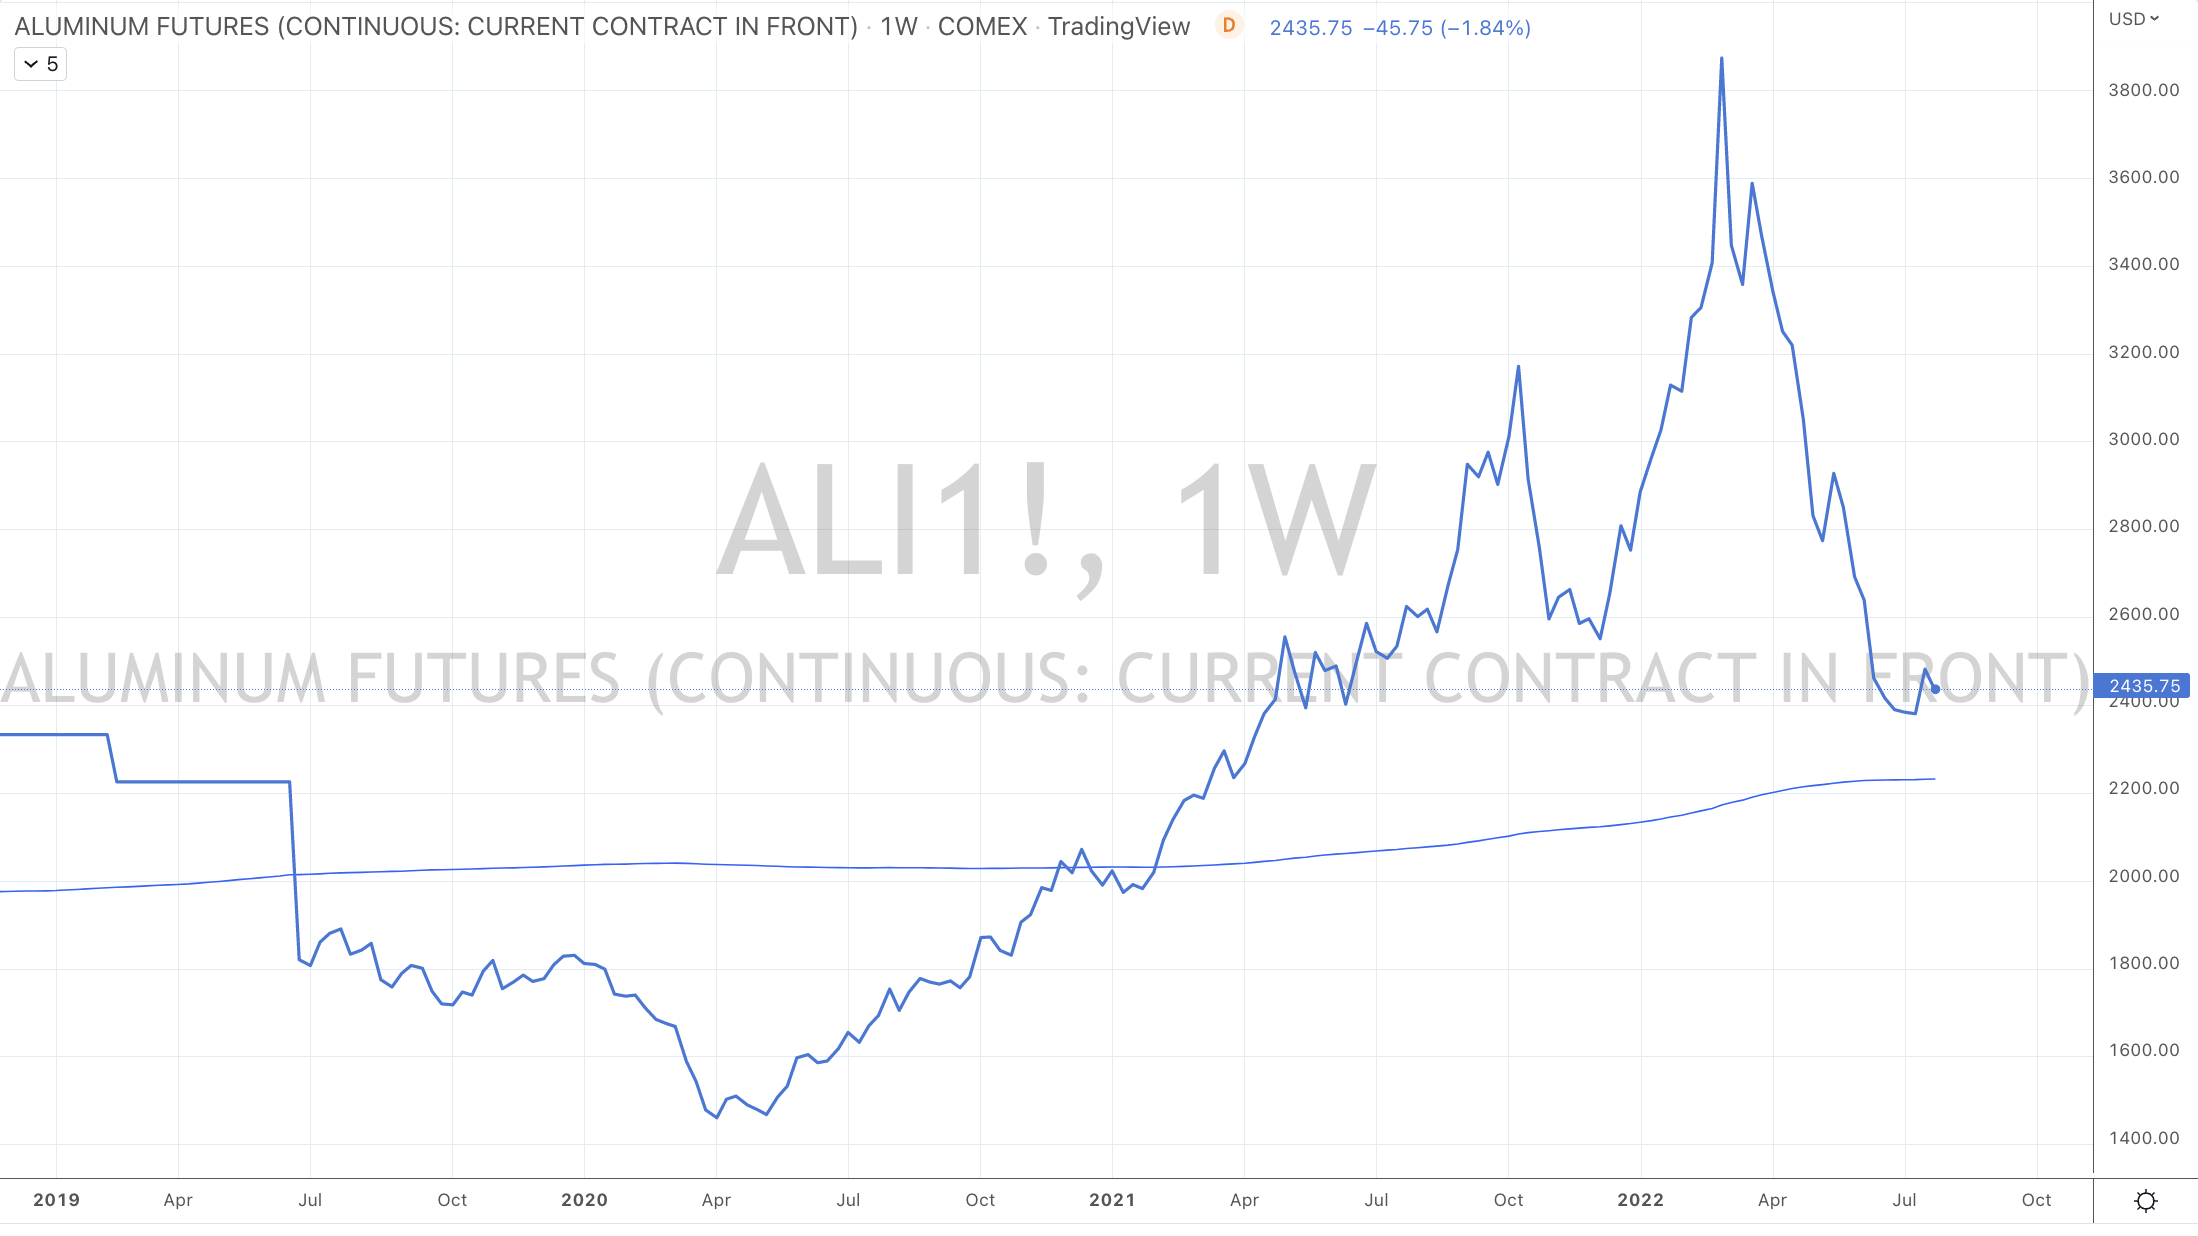
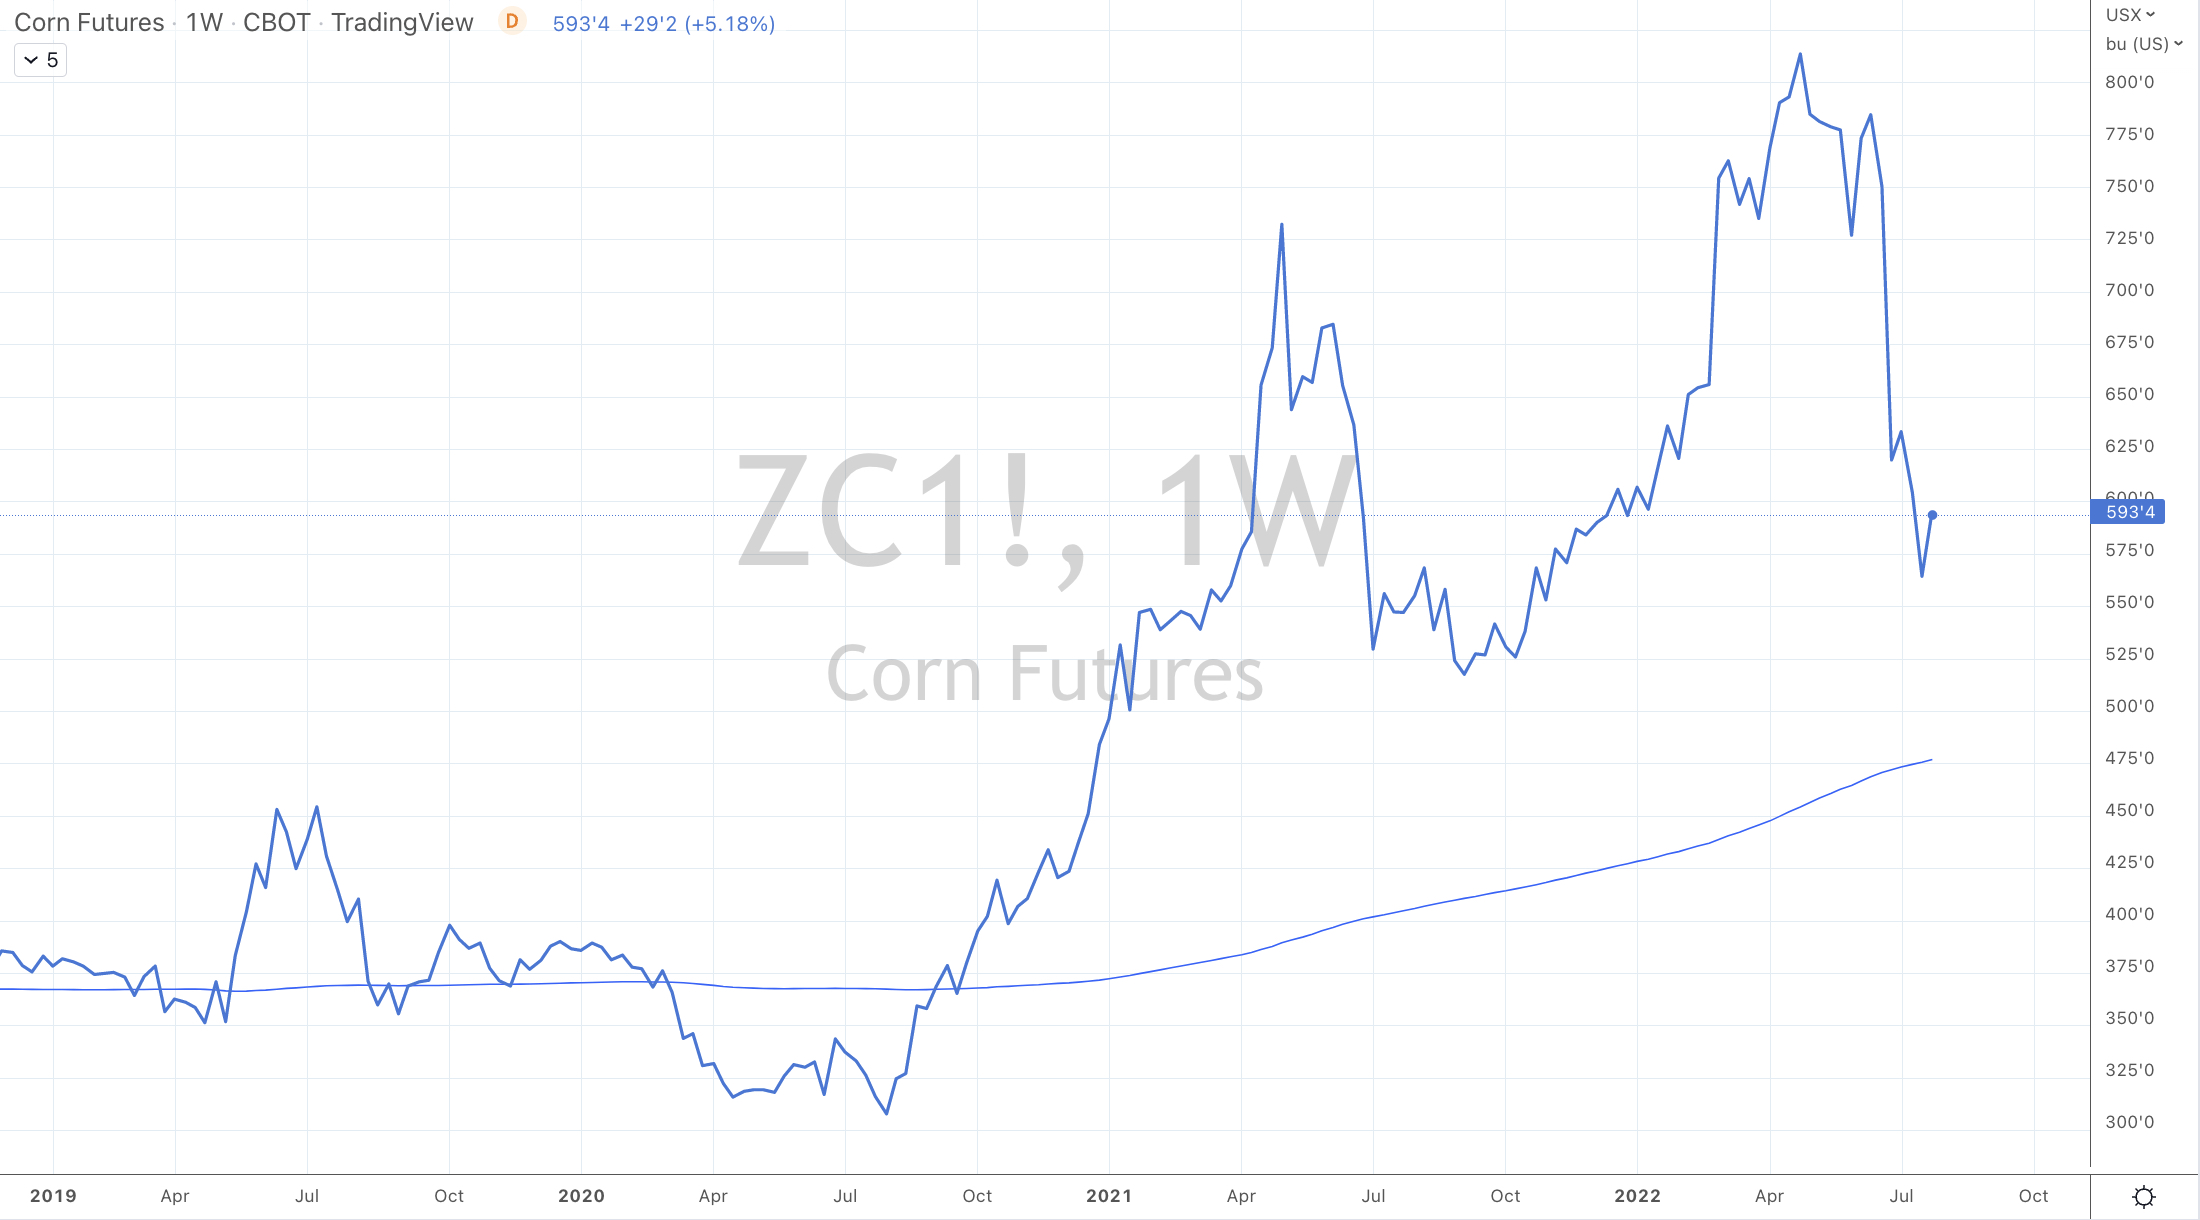
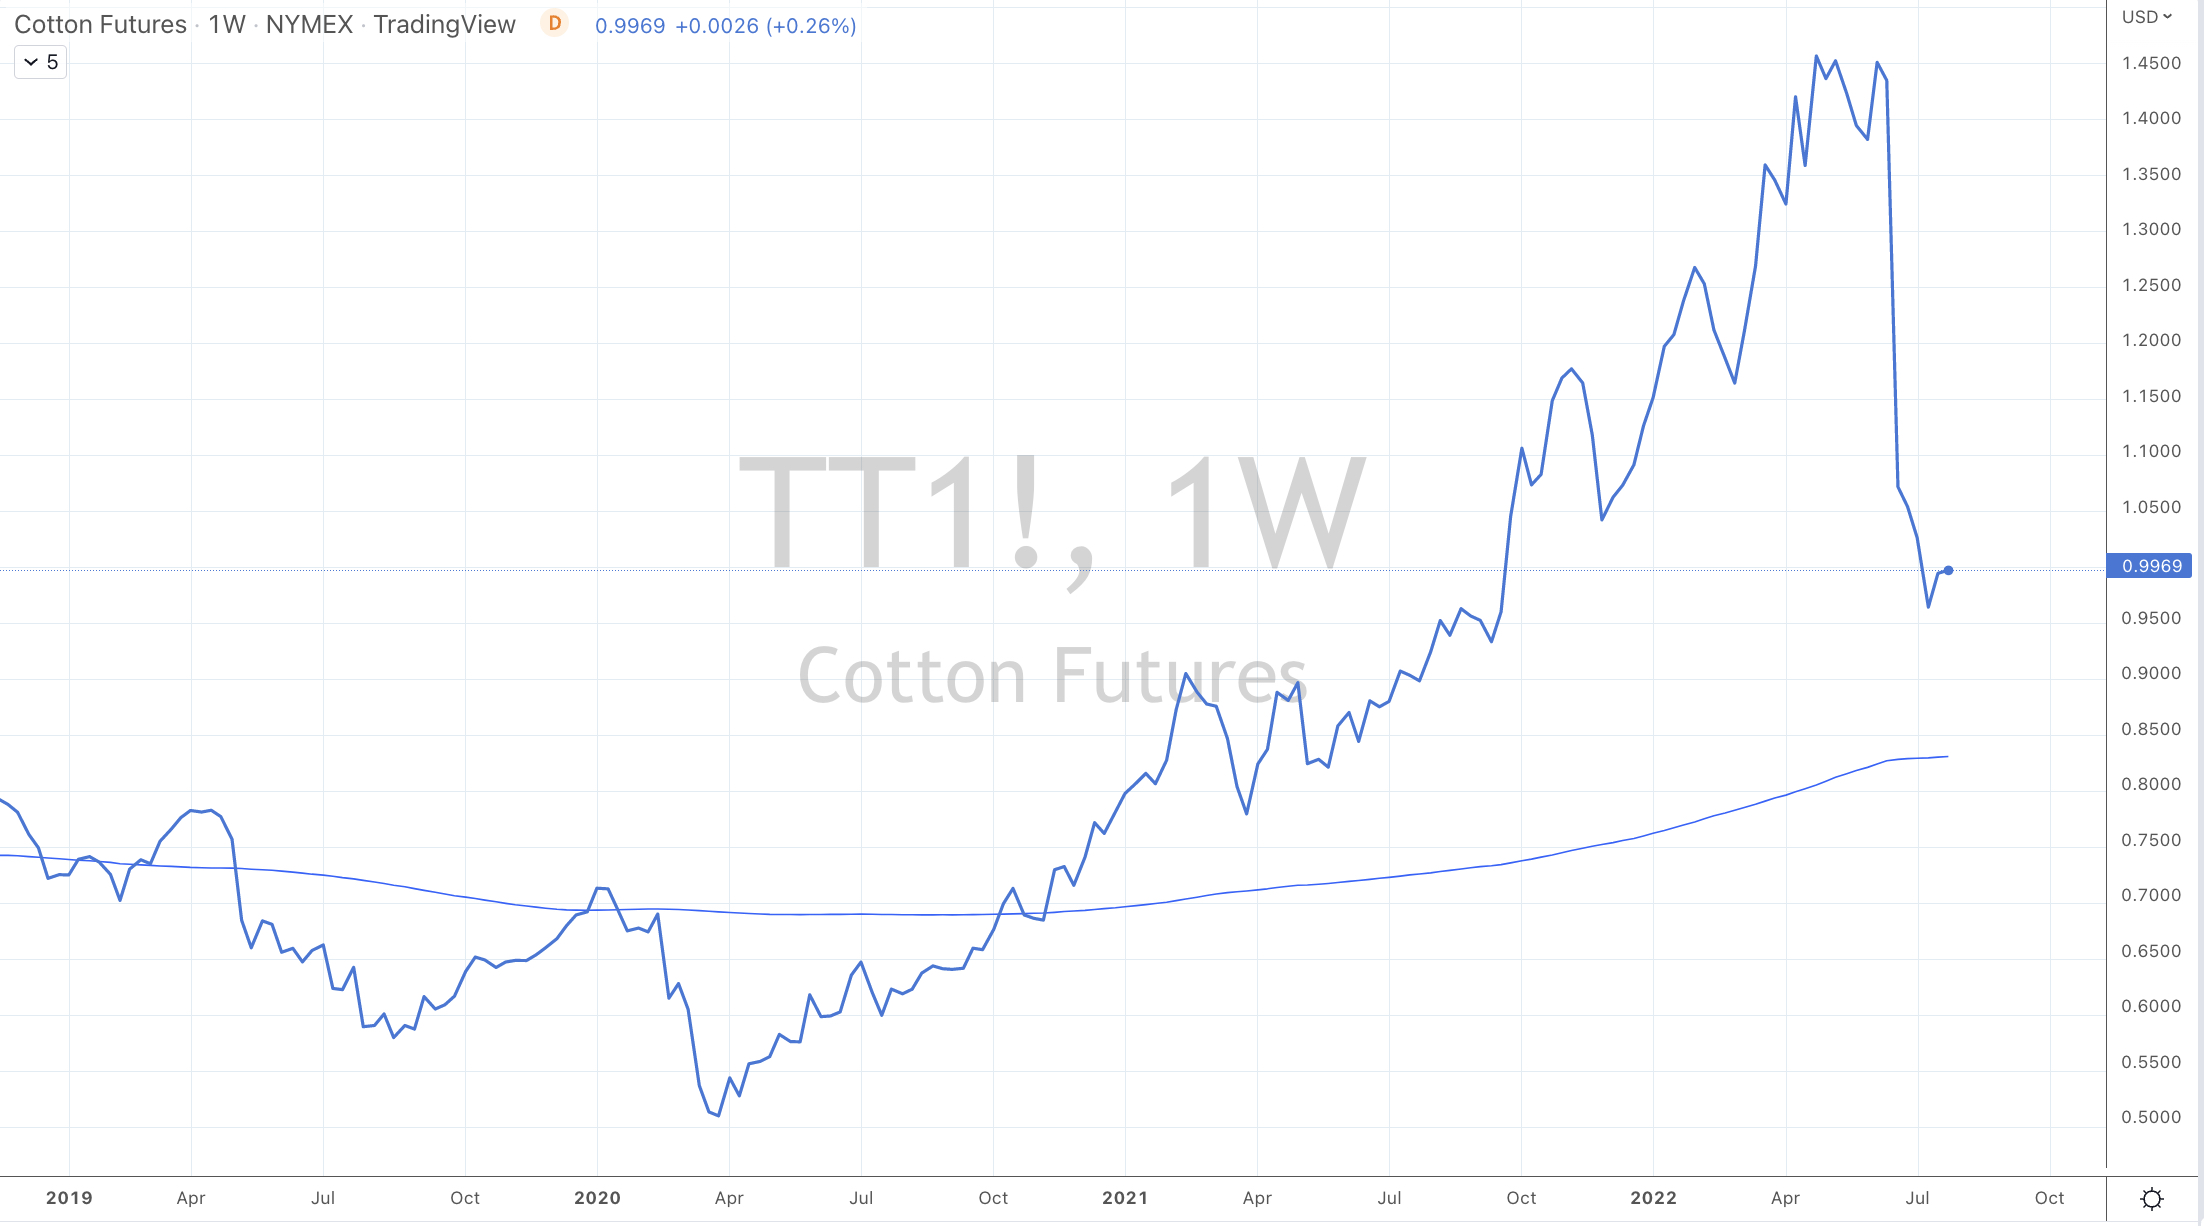
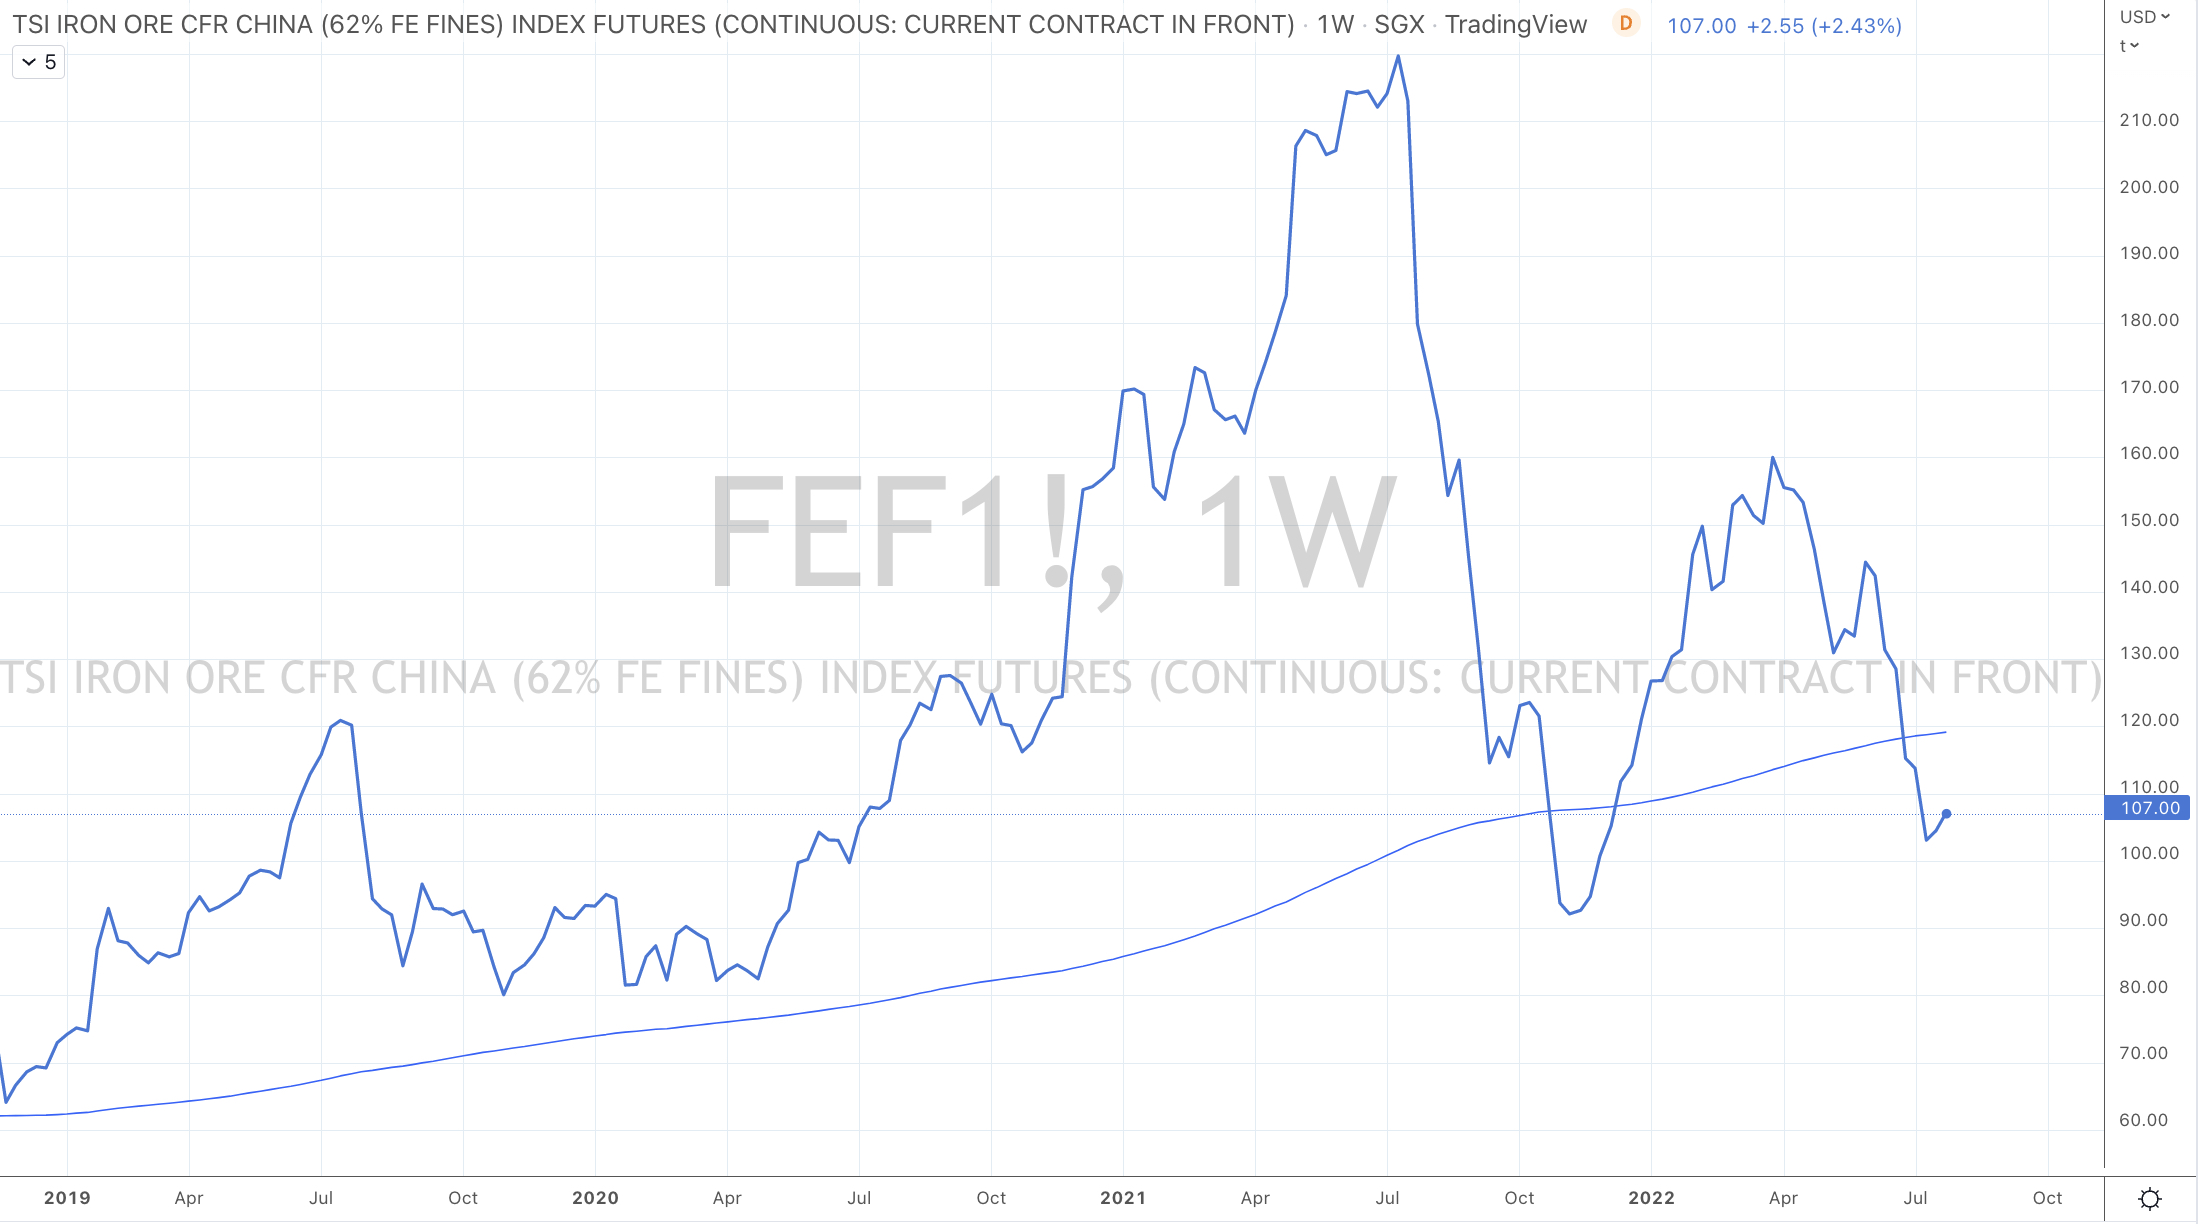
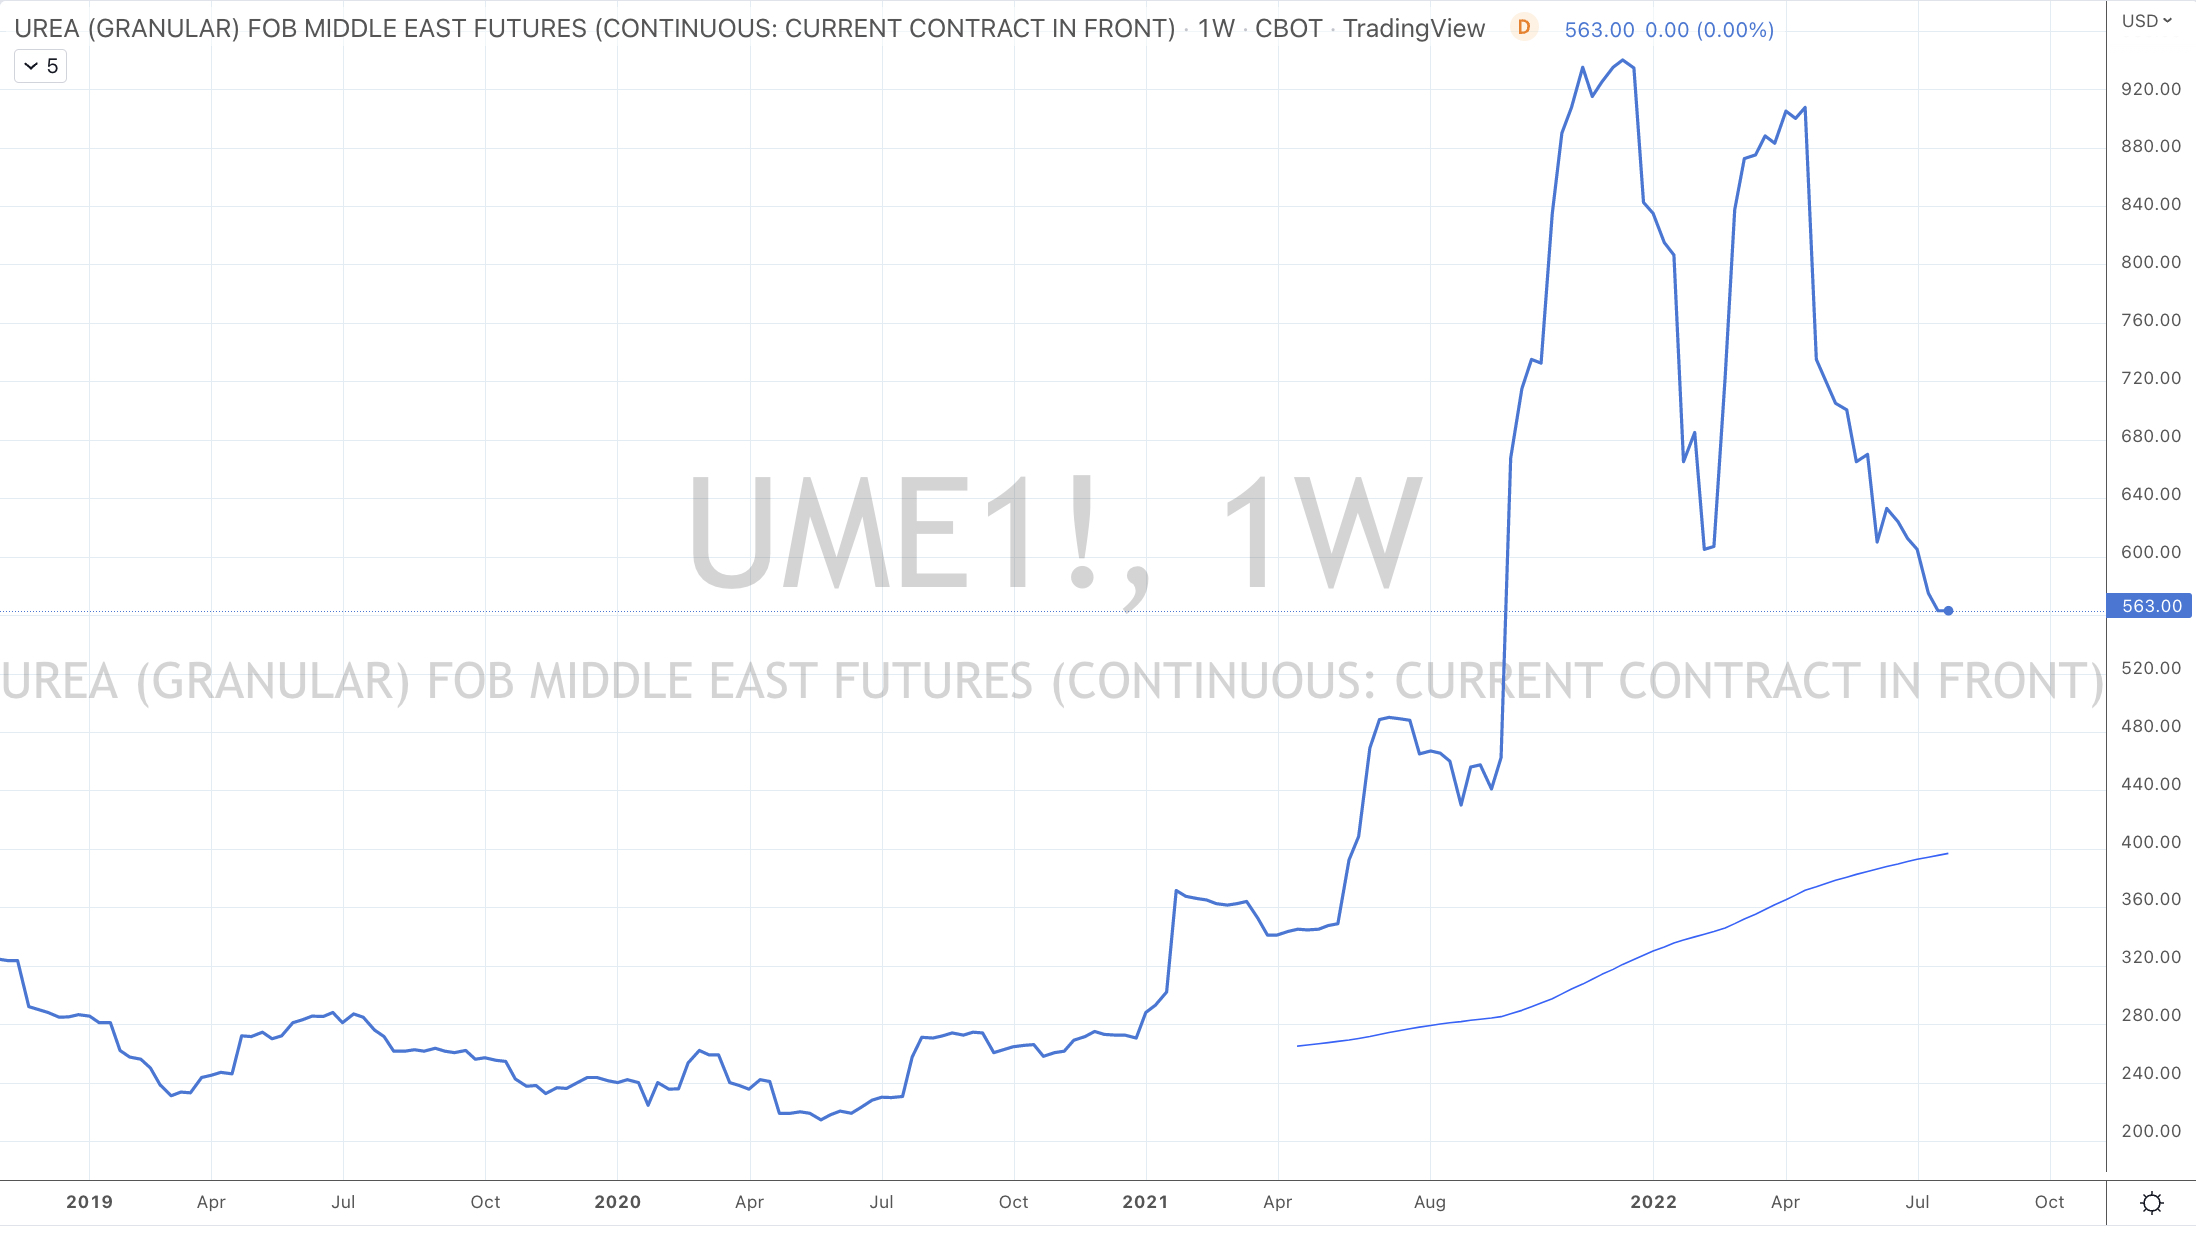
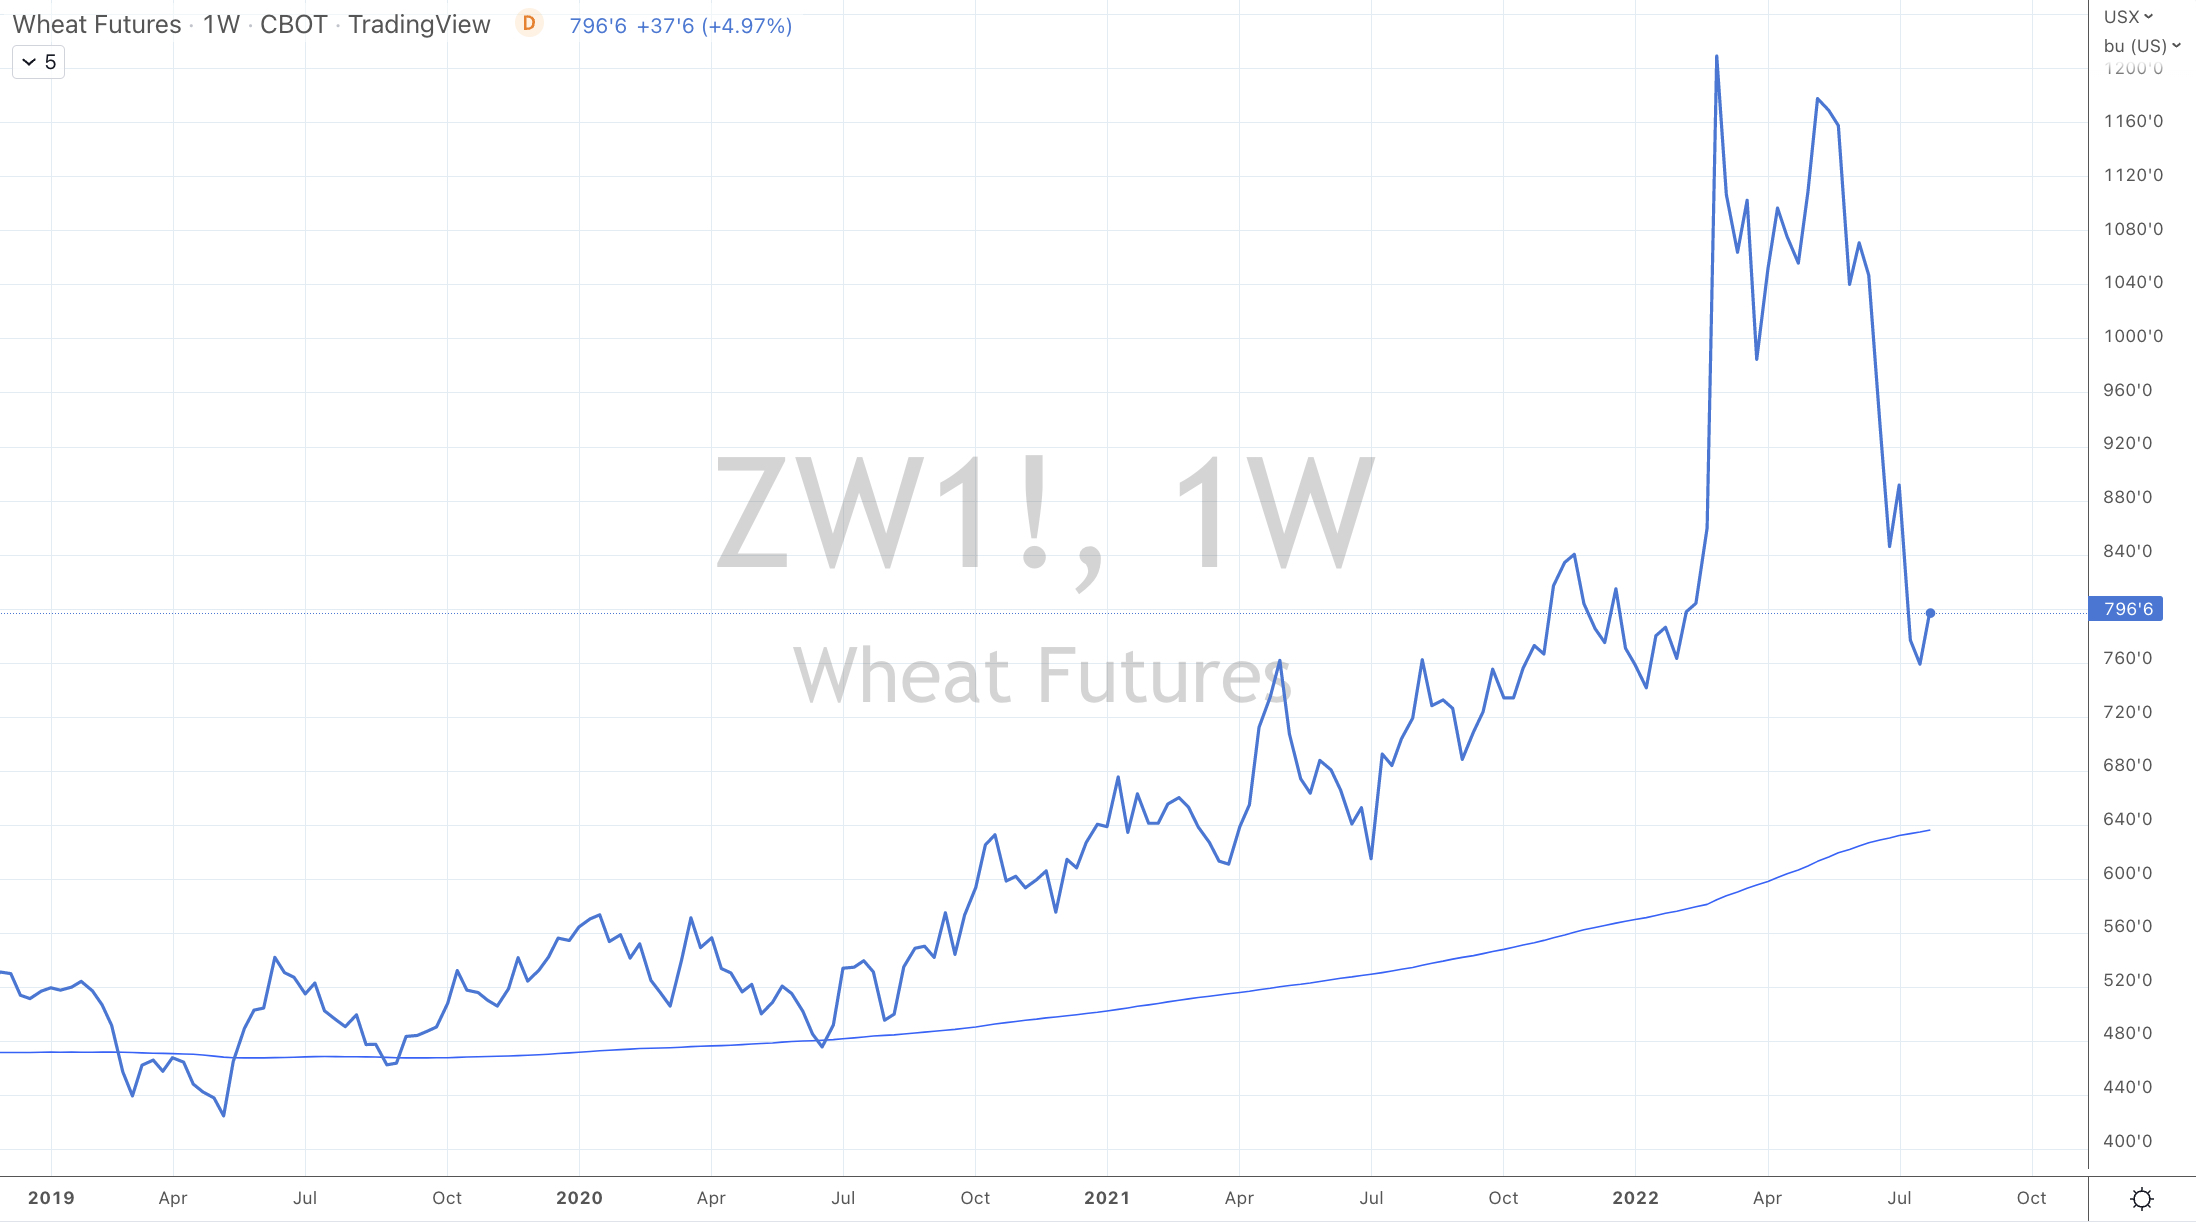
The assorted charts show the declines and mean reversions in commodities ranging from Wheat, Corn, Oats, Soybeans, Copper, Steel, Iron Ore, Australian Coking Coal, Silver, Urea, Tin, Nickel, Cotton, Aluminium and the Baltic Dry (shipping) Index.
These lower prices also equate to lower inputs for those buying at today’s price whilst buyers at higher prices are needing to move inventory of costlier produced product in the face of being undercut by latecomers or the patient.
“After you buy something you paid for, it doesn’t matter. People cling to the idea that at least they should get their money back; maybe there is bad news, and you should sell before it goes lower; maybe put it into something else where you get your money back, but people prefer to make it back where they lost it. People anchor numbers in their heads, and they hold on to them.”
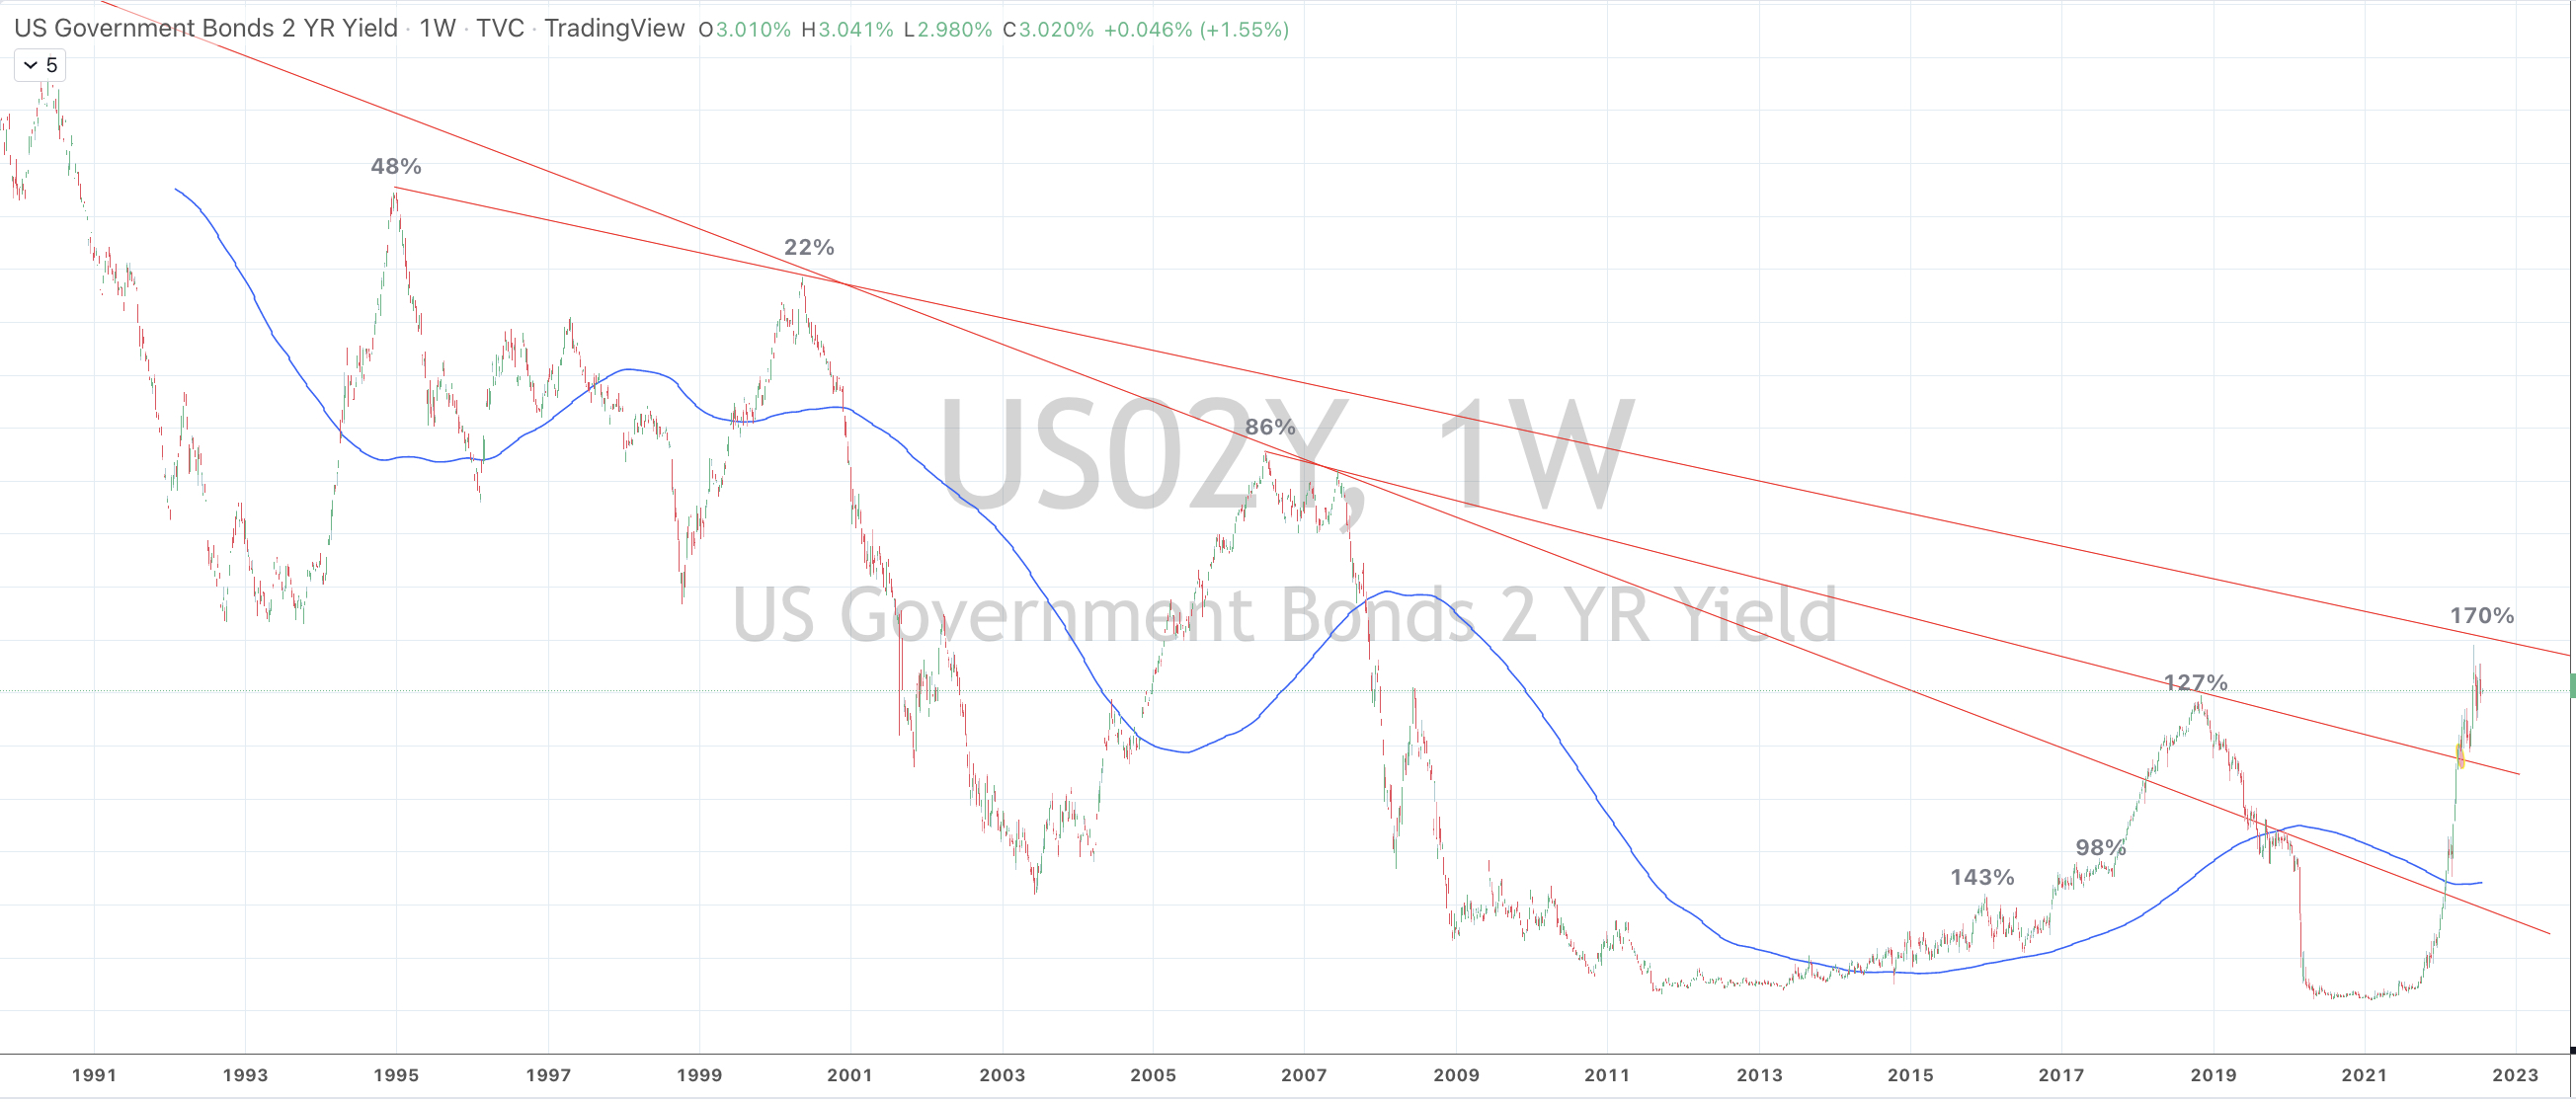
It’s not a solid of piece of analysis, but playing with the US 2 year government bond yield and the percentage it has traded above its 200 week moving average, while mean reversion beckons.
Walmart just reported its latest quarterly earnings.
On Monday (July 26, 2022), the company said it needed more price cuts to pare inventories. The stock is trading 10% lower in the after-market.
“In May 2022, Walmart said it was sitting on over $60 billion of inventory at the end of the first quarter and promised “aggressive” price cuts on items such as apparel.”, said a Reuters report.
Inventories at general merchandise stores at the end of April were the highest since at least 2000, U.S. Census Bureau data showed.
My blog post on July 1, 2022 mentioned the risk of bloated inventories leading to discounting.
….while 6 weeks earlier, Reuters reported “Target Corp on Tuesday cut its quarterly profit margin forecast issued just weeks earlier, and said it would have to offer deeper discounts to clear inventory as decades-high inflation takes a toll on demand.”
Keep in mind that inventory turnover ratios are lagging indicators.
However, some perspective behind that large number of $60 billion of stock sitting in Walmart’s stores and warehouses actually equals 11% of Walmart’s revenue. Industry goals tend to aim for that ratio to sit between 5 and 10.
Walmart’s is usually around 7.5% and the 11% is the same level the company saw in 2013.
From a stock investors perspective, these types of announcements are also considered ‘good cleansing’ statements.
American companies and their management are good at doing this and taking decisive action.
European and Japanese executives tend to be more reluctant doing so.
Nevertheless, discounting is deflationary as are the lower (20%-40%) prices of many commodities already being seen over the past 2-3 months.
In turn, this will aid the moderation of interest rates, as I have alluded in this note written 4 days ago.
Only the 4th time in the past 15 years has AUD priced Silver simultaneously traded below its 200 week moving average and into Oversold territory on the Relative Strength Indicator (RSI).
First tranche is being accumulated at current A$26.93 region.
The following assets (on a weekly timeframe) registered an Overbought or Oversold reading and/or have traded more than 2.5 standard deviations above or below its rolling mean.
Extremes “above” the Mean (at least 2.5 standard deviations)
AUD/GBP
Overbought (RSI > 70)
Brazil 10 year government bond yields
The Overbought Quinella – Both Overbought and Traded at > 2.5 standard deviations above the weekly mean)
None
Extremes “below” the Mean (at least 2.5 standard deviations)
U.S. 10 year minus U.S. 5 year government bond yield
Gold in AUD
Corn
Oversold (RSI < 30)
Hot Rolled Coiled Steel
Copper
Tin
Silver (in USD)
Silver (in AUD)
INR/USD
JPY/USD
KRW/USD
IDR/USD
The Oversold Quinella – Both Overbought and Traded at > 2.5 standard deviations above the weekly mean)
None
Notes & Ideas:
This past week’s biggest news was the rally in equities, the decline in the USD and the continued decline in agricultural and energy commodities.
Wheat has fallen 40% over the past 2 months and is now at its lowest close since January 10, 2022 which is well below the price when Russia invaded Ukraine.
While Corn is at its lowest price since November 8, 2021.
Other mean reversion being seen in Gasoil is on its way. It fell 4% for the week even following a 4% rebound on Friday alone. This diesel fuel was mentioned in this recent post.
Bonds caught a bid and saw yields fall, as they move back to some ‘normalisation’.
The IEF and TLT bond ETF’s rose 1.4% and 2.1%. Quite a good weekly result of a government bond fund.
The U.S. yield curve remains inverted for the 4th week in a row and Oversold for 2 consecutive weeks while the U.S. 5 year minus 3 month yield spread hit my Oversold Trifecta.
In equities, I’m reflecting on my previous comments pondering ‘what if the lows (in equities) have already been seen”?
Past posts have highlighted the extreme lows seen in various U.S. indices such as the Russell 2000, the Smallcap 600, S&P 500 and the Nasdaq. Since their June 16, 2022 intra-day lows, these indices have risen between 10% and 12%.
On June 7, 2022, I suggested that Natural Gas was trading at the mother of all peaks’.
It fell 34% from $9.45 to $6.22 within 14 days. The post below prompted the closing of that position and taking the ‘fat part of the trade’. That was on June 26, 2022.
This past week, Natural Gas rose 18% and it is now 33% higher in the past month.
There is indeed merit in taking the ‘fat part of the trade’.
Today, it’s no mans land and I don’t see a trade.
We saw a weakening in a persistently strong USD.
The Aussie rallied 2% agains the USD.
The hoo-ha about the Euro touching parity didn’t actually mean much. EUR/USD is at 1.02 today.
The Copper/Gold Ratio bounced out of Oversold territory, nor is the GBP/USD or the SEK which rallied 2.5% against the USD.
The Yen remains weak and the Indian Rupeee and Chilean Peso are trading at all-time lows.
Crude posted its lowest weekly close since the Ukraine invasion, which is 5 months to the day.
Recents posts about bourses in Taiwan, South Korea and Germany being Oversold saw the corrective action with 3% rallies.
And last week, I wrote about Gold and Silver nearing their Oversold regions and Silver in AUD at $26.50 would be an interesting entry point. It’s low for the week was $26.54.
The larger advancers over the past week comprised of;
Aluminium 4.3%, Bloomberg Commodity Index 2.7%, Hogs 4%, Copper 3.6%, JKM LNG 7.5%, Coffee 3.5%, Cattle 1.8%, Natural Gas 18.3%, Palladium 10.4%, Platinum 4.4%, Cotton 3.1%, Brent Crude 2.8%, Rice 2.1%, AEX 4.9%, KBW Banking Index 2.1%, CAC 3%, DAX 3%, Dow Jones Industrials 2%, DJ Transports 4.5%, HSCEI 2.1%, Bovespa 2.5%, KOSPI 2.7%, S&P Midcap 400 4%, Nasdaq 100 3.5%, Nikkei 4.2%, Sensex 4.3%, Oslo 3.8%, Copenhagen 4.2%, Helsinki 2.7%, Stockholm 4%, Russell 2000 3.6%, Philadelphia Semiconductor Index 5.5%, S&P 500 2.6%, Singapore STI 2.7%, TAIEX 2.7%, Nasdaq Transports 5.1%, ASX 200 2.8%, Toronto’s TSX 3.2%, S&P Smallcap 600 4.2%, Nasdaq Composite 3.3%.
The group of decliners included;
Rotterdam Coal (2.3%), WTI Crude Oil (3%), Gasoil (4%), Heating Oil (6.6%), LNG (6.6%), Tin (2.1%), Sugar (7.1%), Urea (2.1%), Silver in AUD (2.4%), Corn 6.6%, Oats (2.9%), Soybeans (3%), Wheat (2.3%) and the Nasdaq Biotechnology Index fell 1.6%.