Macro Extremes (week ending November 3, 2023)

A weekly Macro, Cross Asset review of prices trading at extremes which may generate future investment ideas and opportunities.

The following assets (on a weekly timeframe) either registered an Overbought or Oversold reading and/or have traded more than 2.5 standard deviations above or below its rolling mean.

Extremes “above” the Mean (at least 2.5 standard deviations

Australian 2, 5 and 10 year government bond yields 

Natural Gas

Gold as priced in CAD

EUR/JPY

EUR/GBP

Overbought (RSI > 70)

Japanese and Turkish 10 year government bond yields 

Cocoa

Uranium 

And Rubber

The Overbought Quinella – Both Overbought and Traded at > 2.5 standard deviations above the weekly mean)

Japanese 2 and 5 year government bond yield

Extremes “below” the Mean (at least 2.5 standard deviations)

Indonesia’s equity index

South Korea’s KOSPI 

Nasdaq Biotech Index

And the ASX Industrials Index

Oversold (RSI < 30)

Lithium Hydroxide

Nickel 

The Oversold Quinella – Both Oversold and Traded at < 2.5 standard deviations below the weekly mean)

None

Notes & Ideas:

Government bond yields lower again, except for the Japanese, again.

Bond yields peaked 2-3 weeks ago which coincided with many registering overbought extreme readings.

For example, over the past 2 weeks the Canadian 10 year bond was yielding 4.20% and today, it is 3.75%.

The U.S. 30 year bond was at 5.17% and now its 4.77%, while its 10 year counterpart has eased from 5.02% to 4.57%.

On the other side of that ledger the U.S. 7-10 Treasury Bond ETF (IEF) was trading at $89.20, 2 weeks ago.

It has risen 2.7% since then, with the ETF now at $91.60 per share.

Equities surged. 

The largest advancers for the week are listed at the end of this note.

The rise in equities wasn’t a surprise as foretold with my recent notes about excessive bearish sentiment.

Many equity indices which appeared in the oversold categories of this publication in the past 2 weeks are no longer so.

And there were those which also completed mean reversions down to their respective 200 week moving average.

All of those multi-week losing streaks mentioned last week have all been snapped.

Impressively, indices such as the S&P Small Cap 600 which had fallen 16.5% over the past 13 weeks, called 7.5% in this past week alone.

Lastly, the indices which appear in this week’s oversold extremes, did so earlier within the week.

Commodities were weaker, again. 

The weakness amongst energy contracts (for the 2nd consecutive week) weighed heavily on commodity indices. 

WTI Crude has closed at its lowest point since August 21, 2023.

Orange Juice fell 10.6% and it isn’t overbought anymore, while other agricultural prices held up.

Platinum rose while Gold declined. That gap still miles away from being closed.

Baltic Dry Index fell 7% adding to last week’s 24% drop. Prior to this slump, it put together a 7 week winning streak.

Heating Oil, WTI Crude and Gasoline have sunken 8%, 9% and 10%, respectively over the past fortnight.

Gold (as priced in CAD) took a break from 11% rally over the past 3 weeks. 

Uranium remains overbought for an 12th consecutive week.

while Lithium Hydroxide declining streak extends to 17 consecutive weeks.

Amongst currencies, the Australian Dollar was stronger again, rising for the last 3 weeks against many pairs.

The Aussie’s most prominent rise was a 2.4% hike against the Swiss Franc.

The U.S. Dollar Index (DXY) was weaker and had a bearish outside week.

The Loonie was weaker, again, although strangely it has a bullish outside week against the USD.

The BRL/USD has risen for the past 4 weeks after having declined steadily for the past 3 months to complete its mean reversion.

The JPY/USD is still floating around the extremes as is the AUD/JPY.

And the Thai Baht has moved out of its oversold territory which it occupied a few weeks ago. 

The larger advancers over the past week comprised of;

Lean Hogs 1.8%, Coffee 6.2%, Lumber 3.6%, Platinum 4.3%, Sugar 1.6%, Soybeans 2.4%, AEX 3.1%, KBW Bank Index 11.1%, CAC 3.7%, China A50 2.7%, DAX 3.5%, DJ Industrial 5.1%, DJ Transports 7.1%, MIB 5.1%, IBEX 4.2%, Bovespa 4.3%, S&P SmallCap 600 7.5%, Nasdaq Composite 6.6%, KRE Regional Bank Index 12.2%, KOSPI 2.9%, FTSE 250 6.6%, S&P MidCap 400 6.6%, Mexico 4.7%, Nasdaq Biotech Index 6.7%, Nasdaq 100 6.5%, Copenhagen 2.5%, Helsinki 4.5%, Stockholm 3.8%, Russell 2000 7.6%, SET 2.3%, S&P SmallCap Value 8.8%, SMI 2.5%, SOX 7.1%, S&P 500 5.9%, STI 2.7%, TAIEX 2.3%, TSX 5.8%, FTSE 100 1.7%, ASX 200 2.2%, ASX Industrials 3.8%, ASX SmallCaps 3.1% and the Nikkei 225 rose 3.1%.

The group of decliners included;

Australian Coking Coal (7.5%), Rotterdam Coal (4.2%), Baltic Dry Index (6.5%), China Coking Coal (11.6%), WTI Crude (5.9%), Cotton (5.6%), Heating Oil (4.2%), LNG JKM (5.9%), Lithium (6.8%), Tin (3.4%), Newcastle Coal (9%), Orange Juice (10.6%), Gasoline (4.1%), S&P GSCI (2.2%), Dutch TTF Gas (9.4%), Brent Crude (4.1%), Silver in AUD (2.3%), Gold in AUD (3.4%), Gold in CAD (2.2%), Oats (7.5%), Rice (2.2%).

November 5, 2023

by Rob Zdravevski

rob@karriasset.com.au
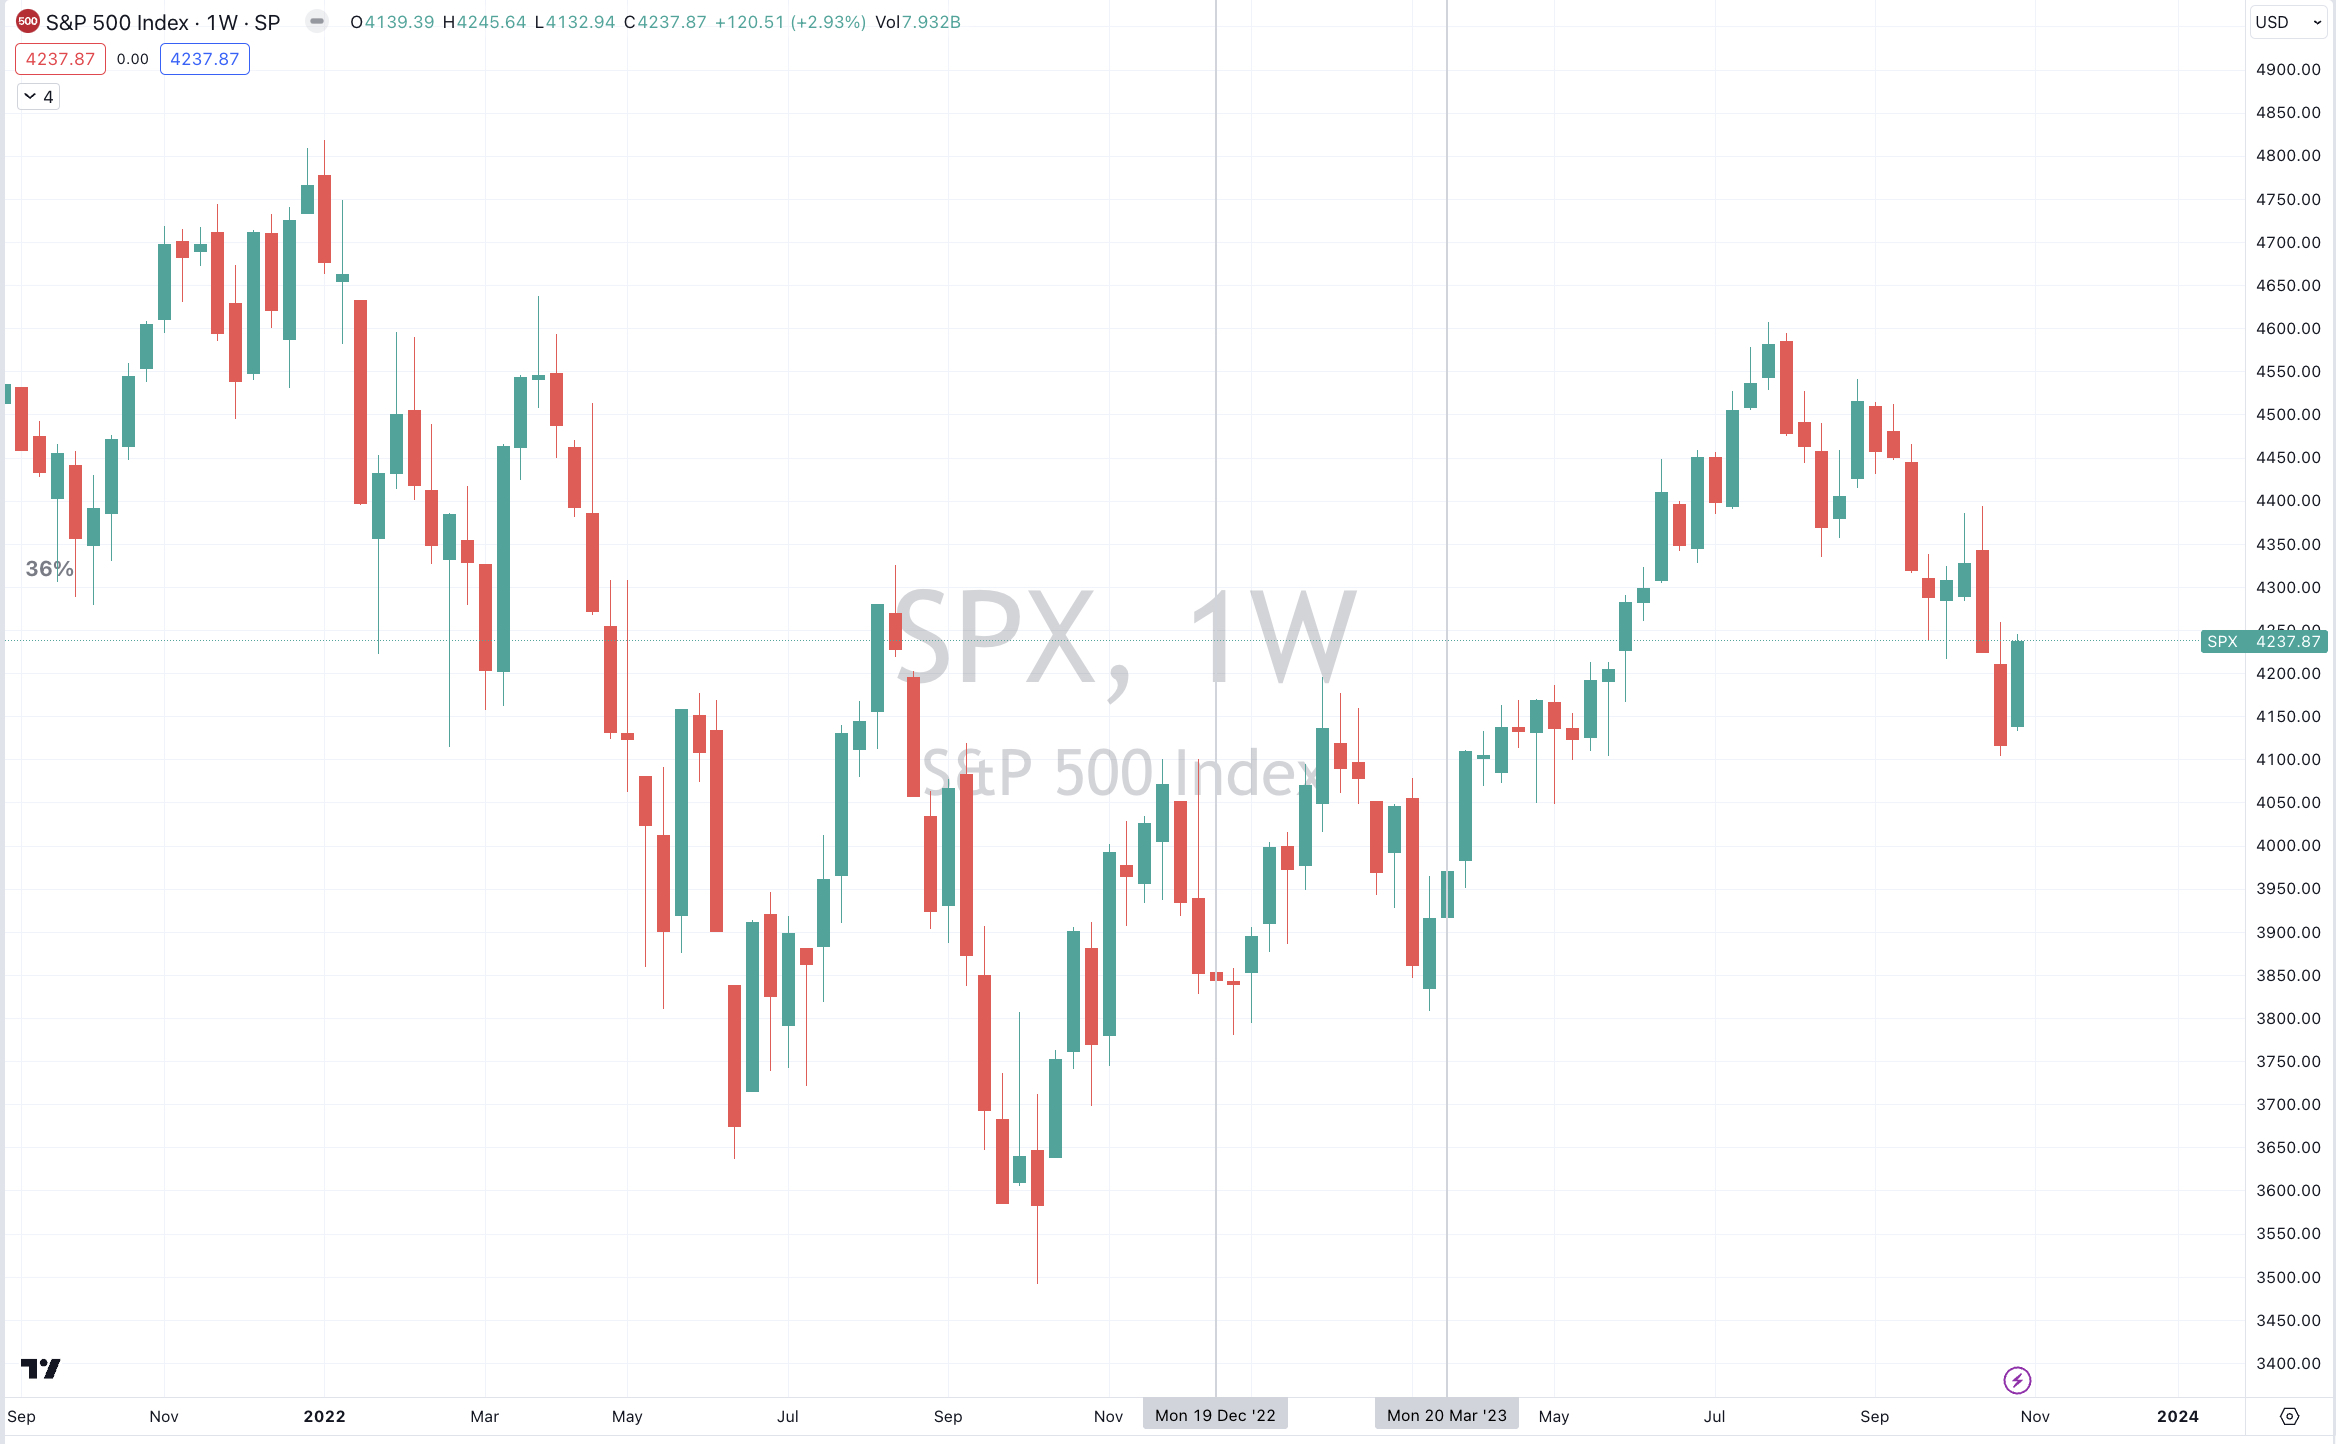
That’s why it felt bearish

If it feels that many are bearish, it’s because they are.

The weekly AAII Investor Sentiment Survey just released its latest result.

For the week ending Wednesday November 1, 2023, their survey respondents were;

Bullish 24.3%
Neutral 25.4%
Bearish 50.3%

This week’s result has recorded the highest ‘bearish’ survey reading since the week ending December 22, 2022.

And it’s also the largest negative spread between the bullish and bearish reading being (26%) since the week ending March 23, 2023.

The vertical lines in the attached chart of the S&P 500 highlight those previous moments, which marry up with the measured sentiment.

November 2, 2023

by Rob Zdravevski

rob@karriasset.com.au
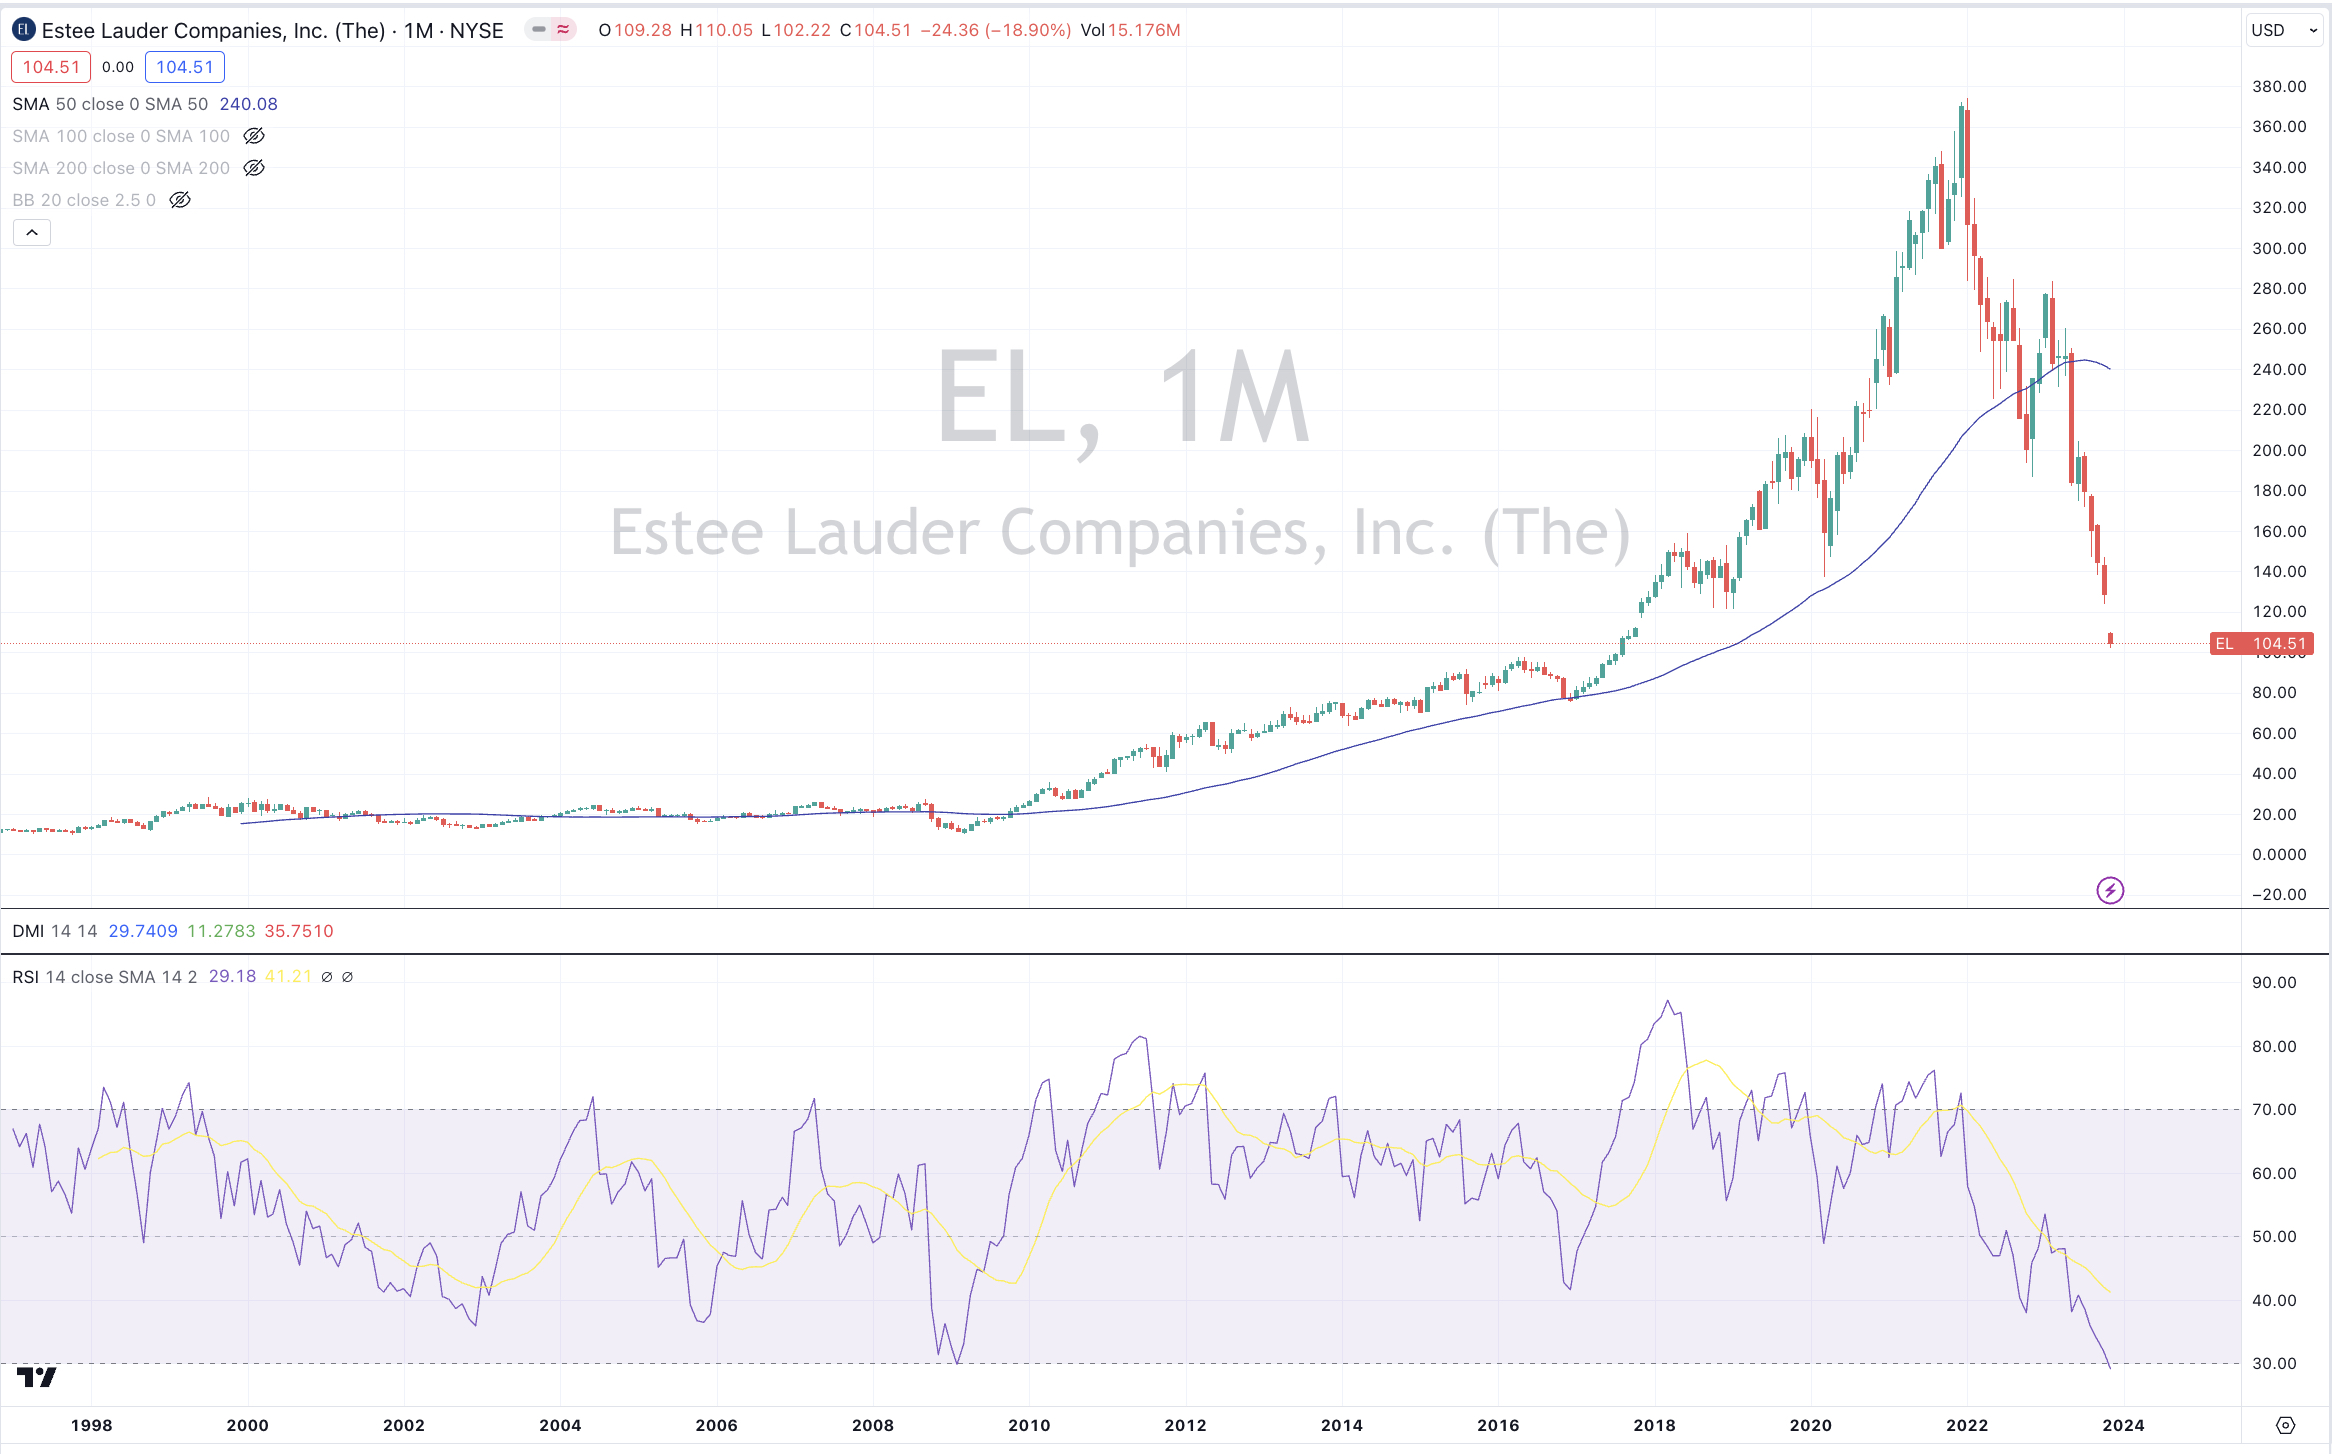
A rare occurrence for Estee Lauder’s stock price

The Estee Lauder (EL:US) stock price is now oversold on a monthly basis.

This is only the 2nd time this has occurred in its 28 year history of being publicly listed.

November 2, 2023

by Rob Zdravevski

rob@karriasset.com.au

Tricked by the analyst’s Oil headlines

On Sept 19-20, 2023, many traded the ‘headlines’ when….

Brent Crude Oil was trading at $95.

Then analysts started calling for Brent to reach $100.

Brent is now trading at $85.

It’s fun to observe the crowded, consensus and marginal opportunities and then perhaps consider the antithesis.

November 2, 2023

by Rob Zdravevski

rob@karriasset.com.au
Bargains are starting to appear in equities

How I’m broadly seeing the equities market.

You can subscribe for future editions here

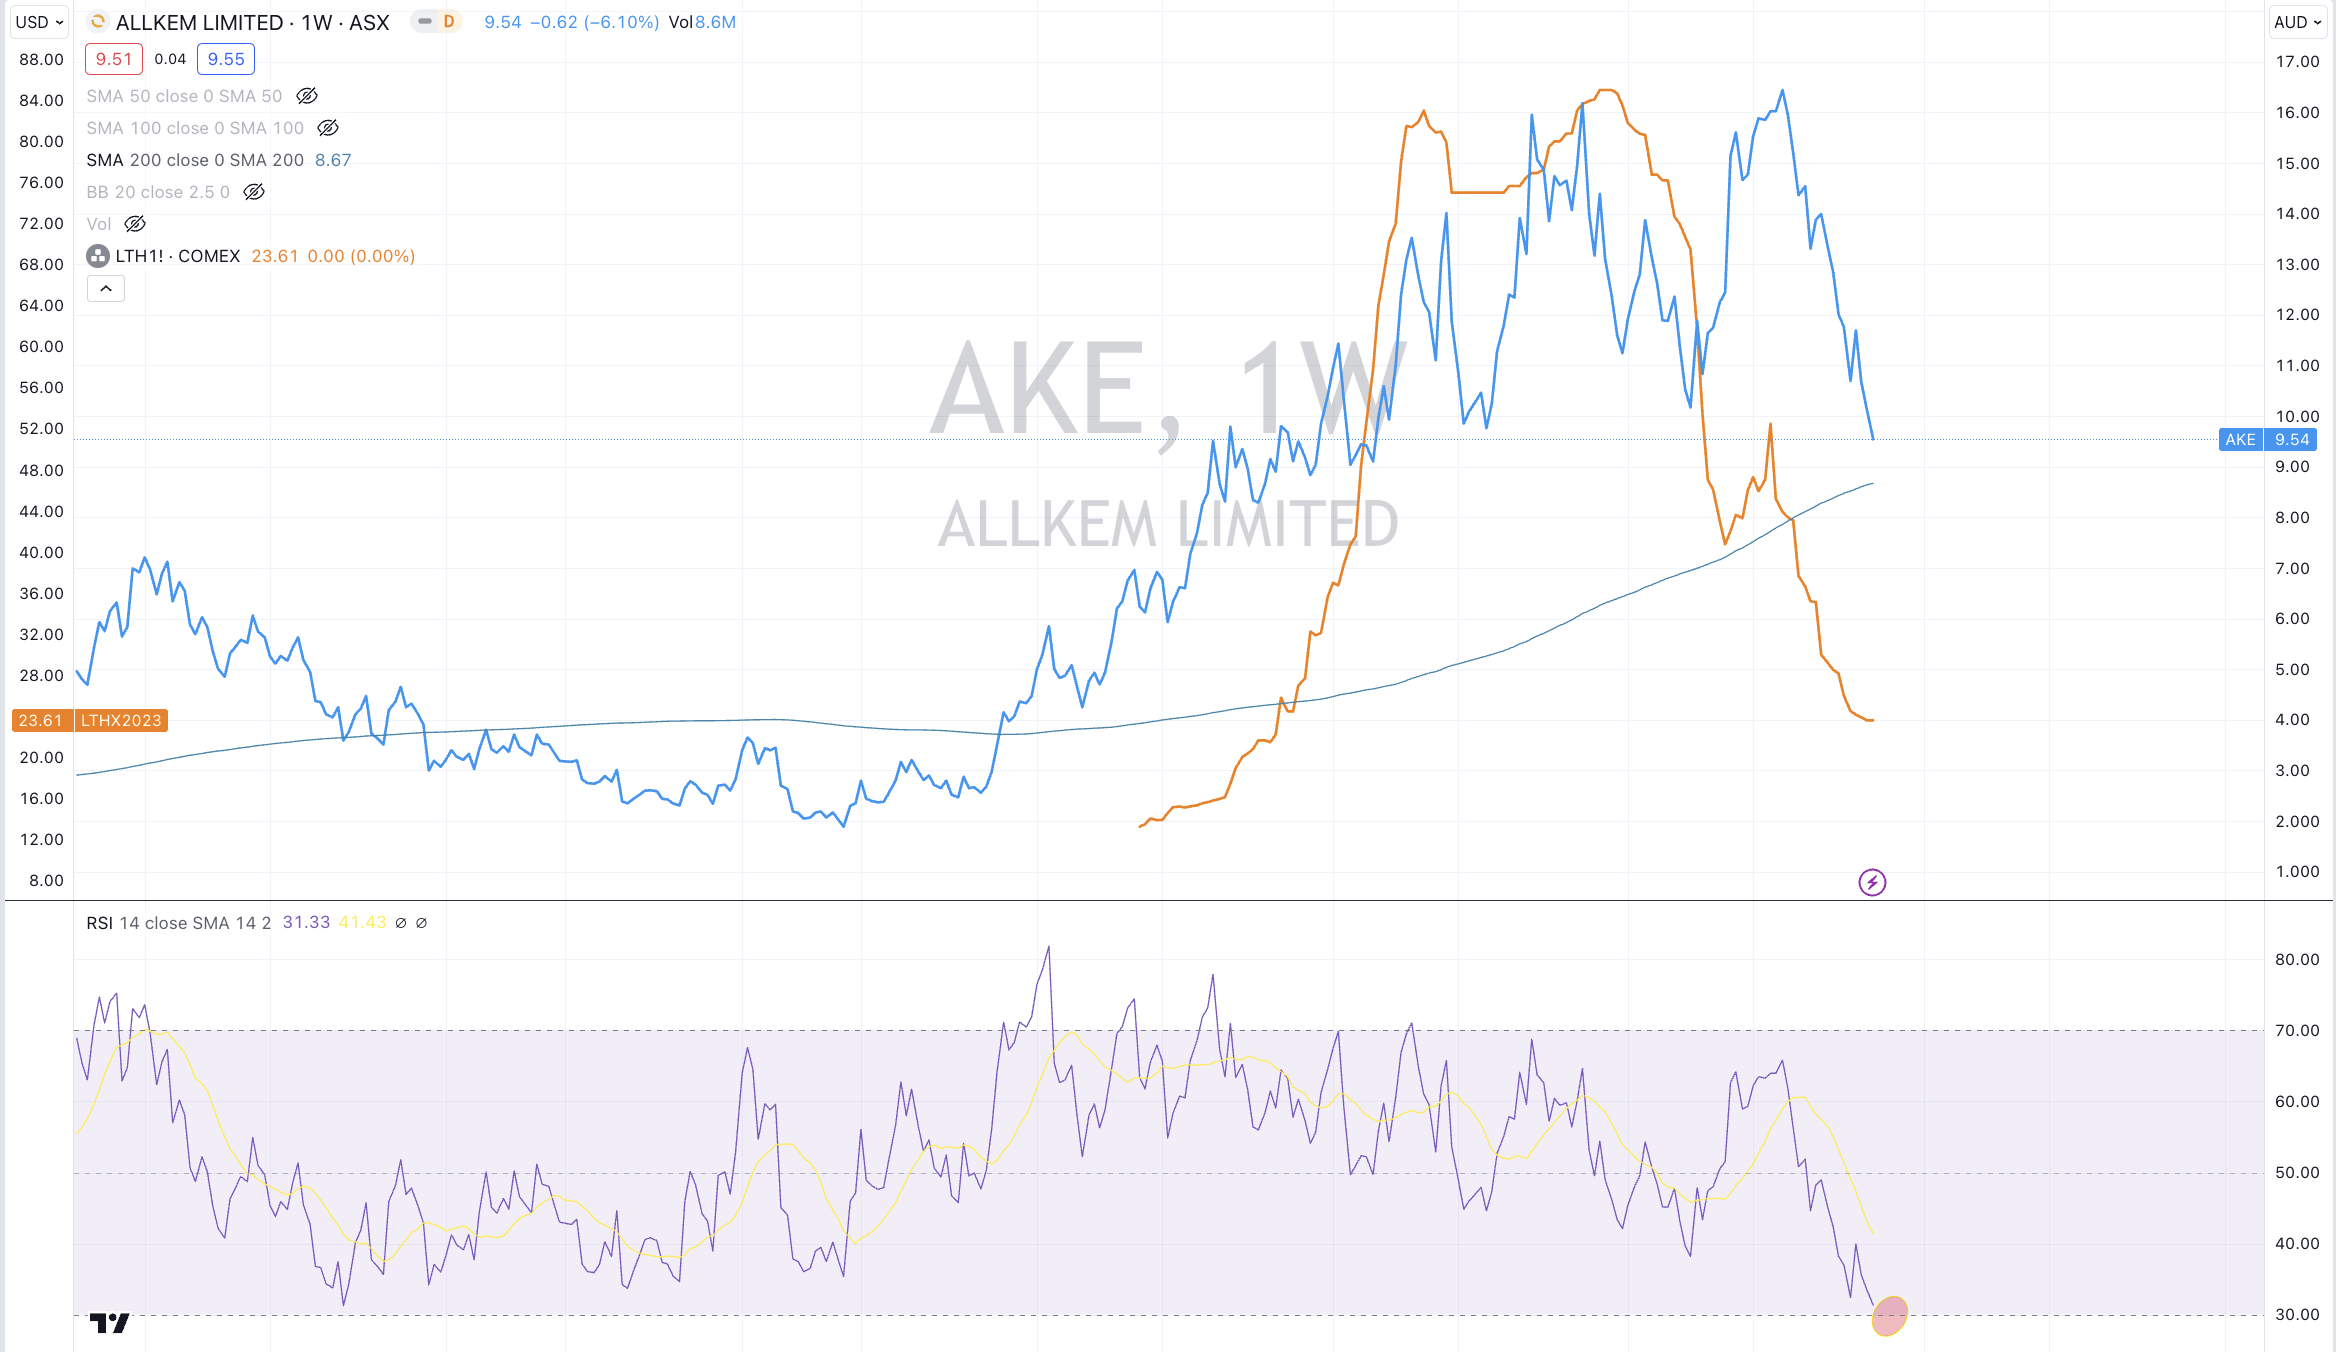
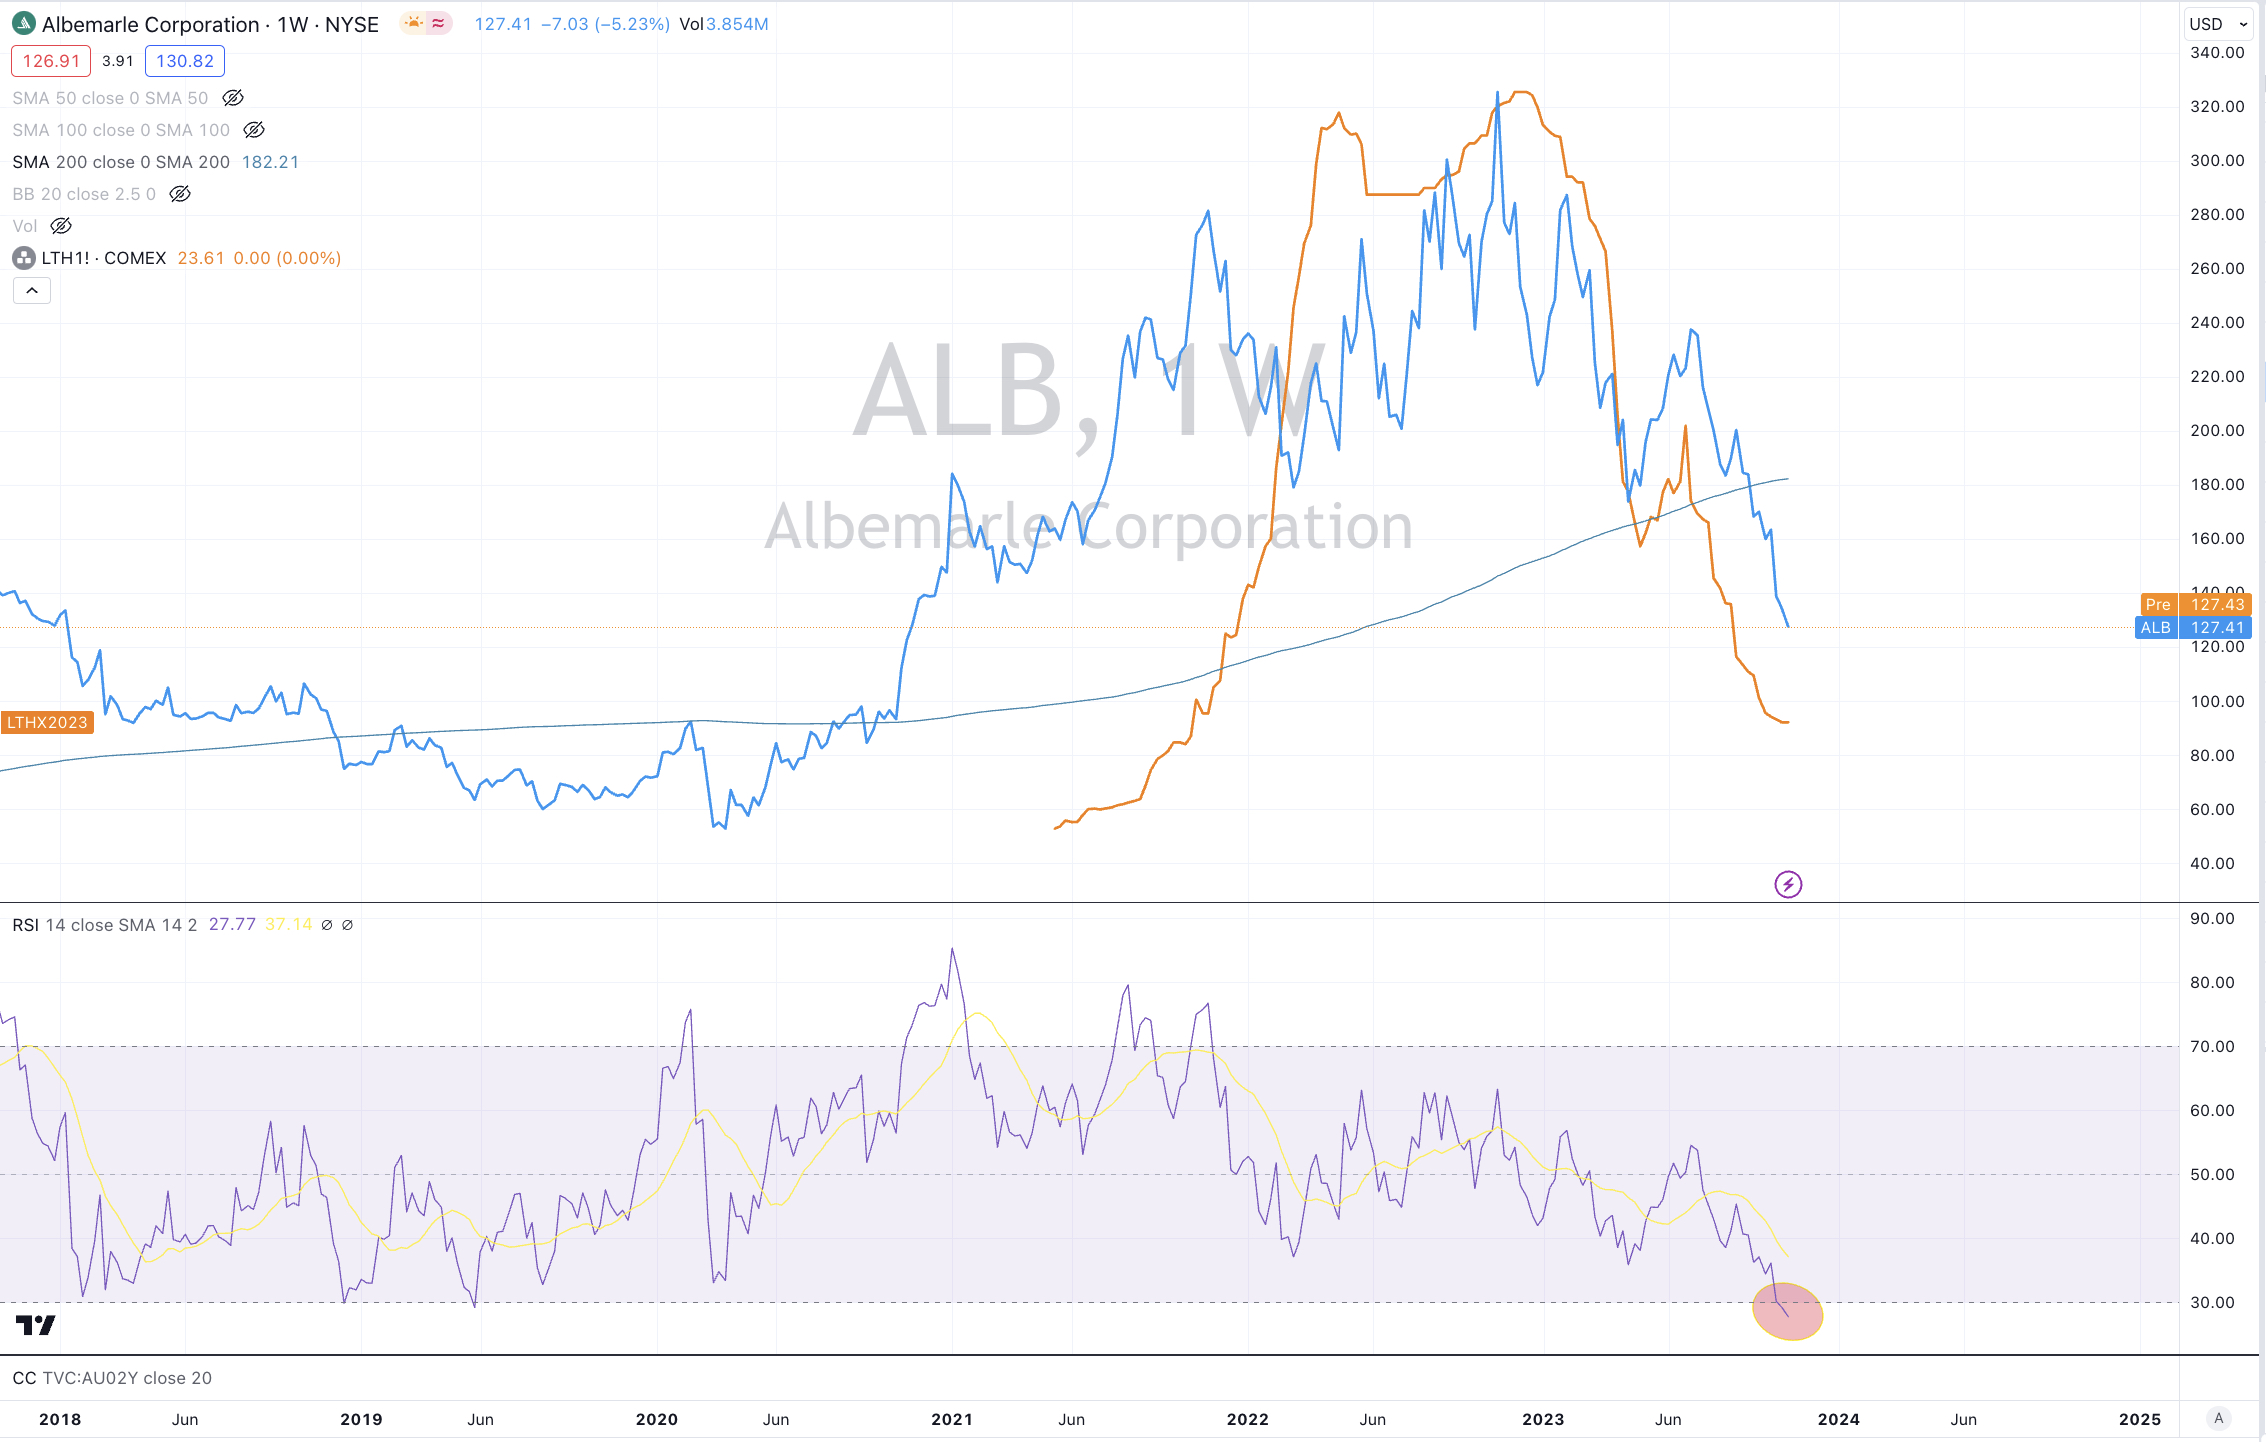
Lithium’s decline isn’t surprising

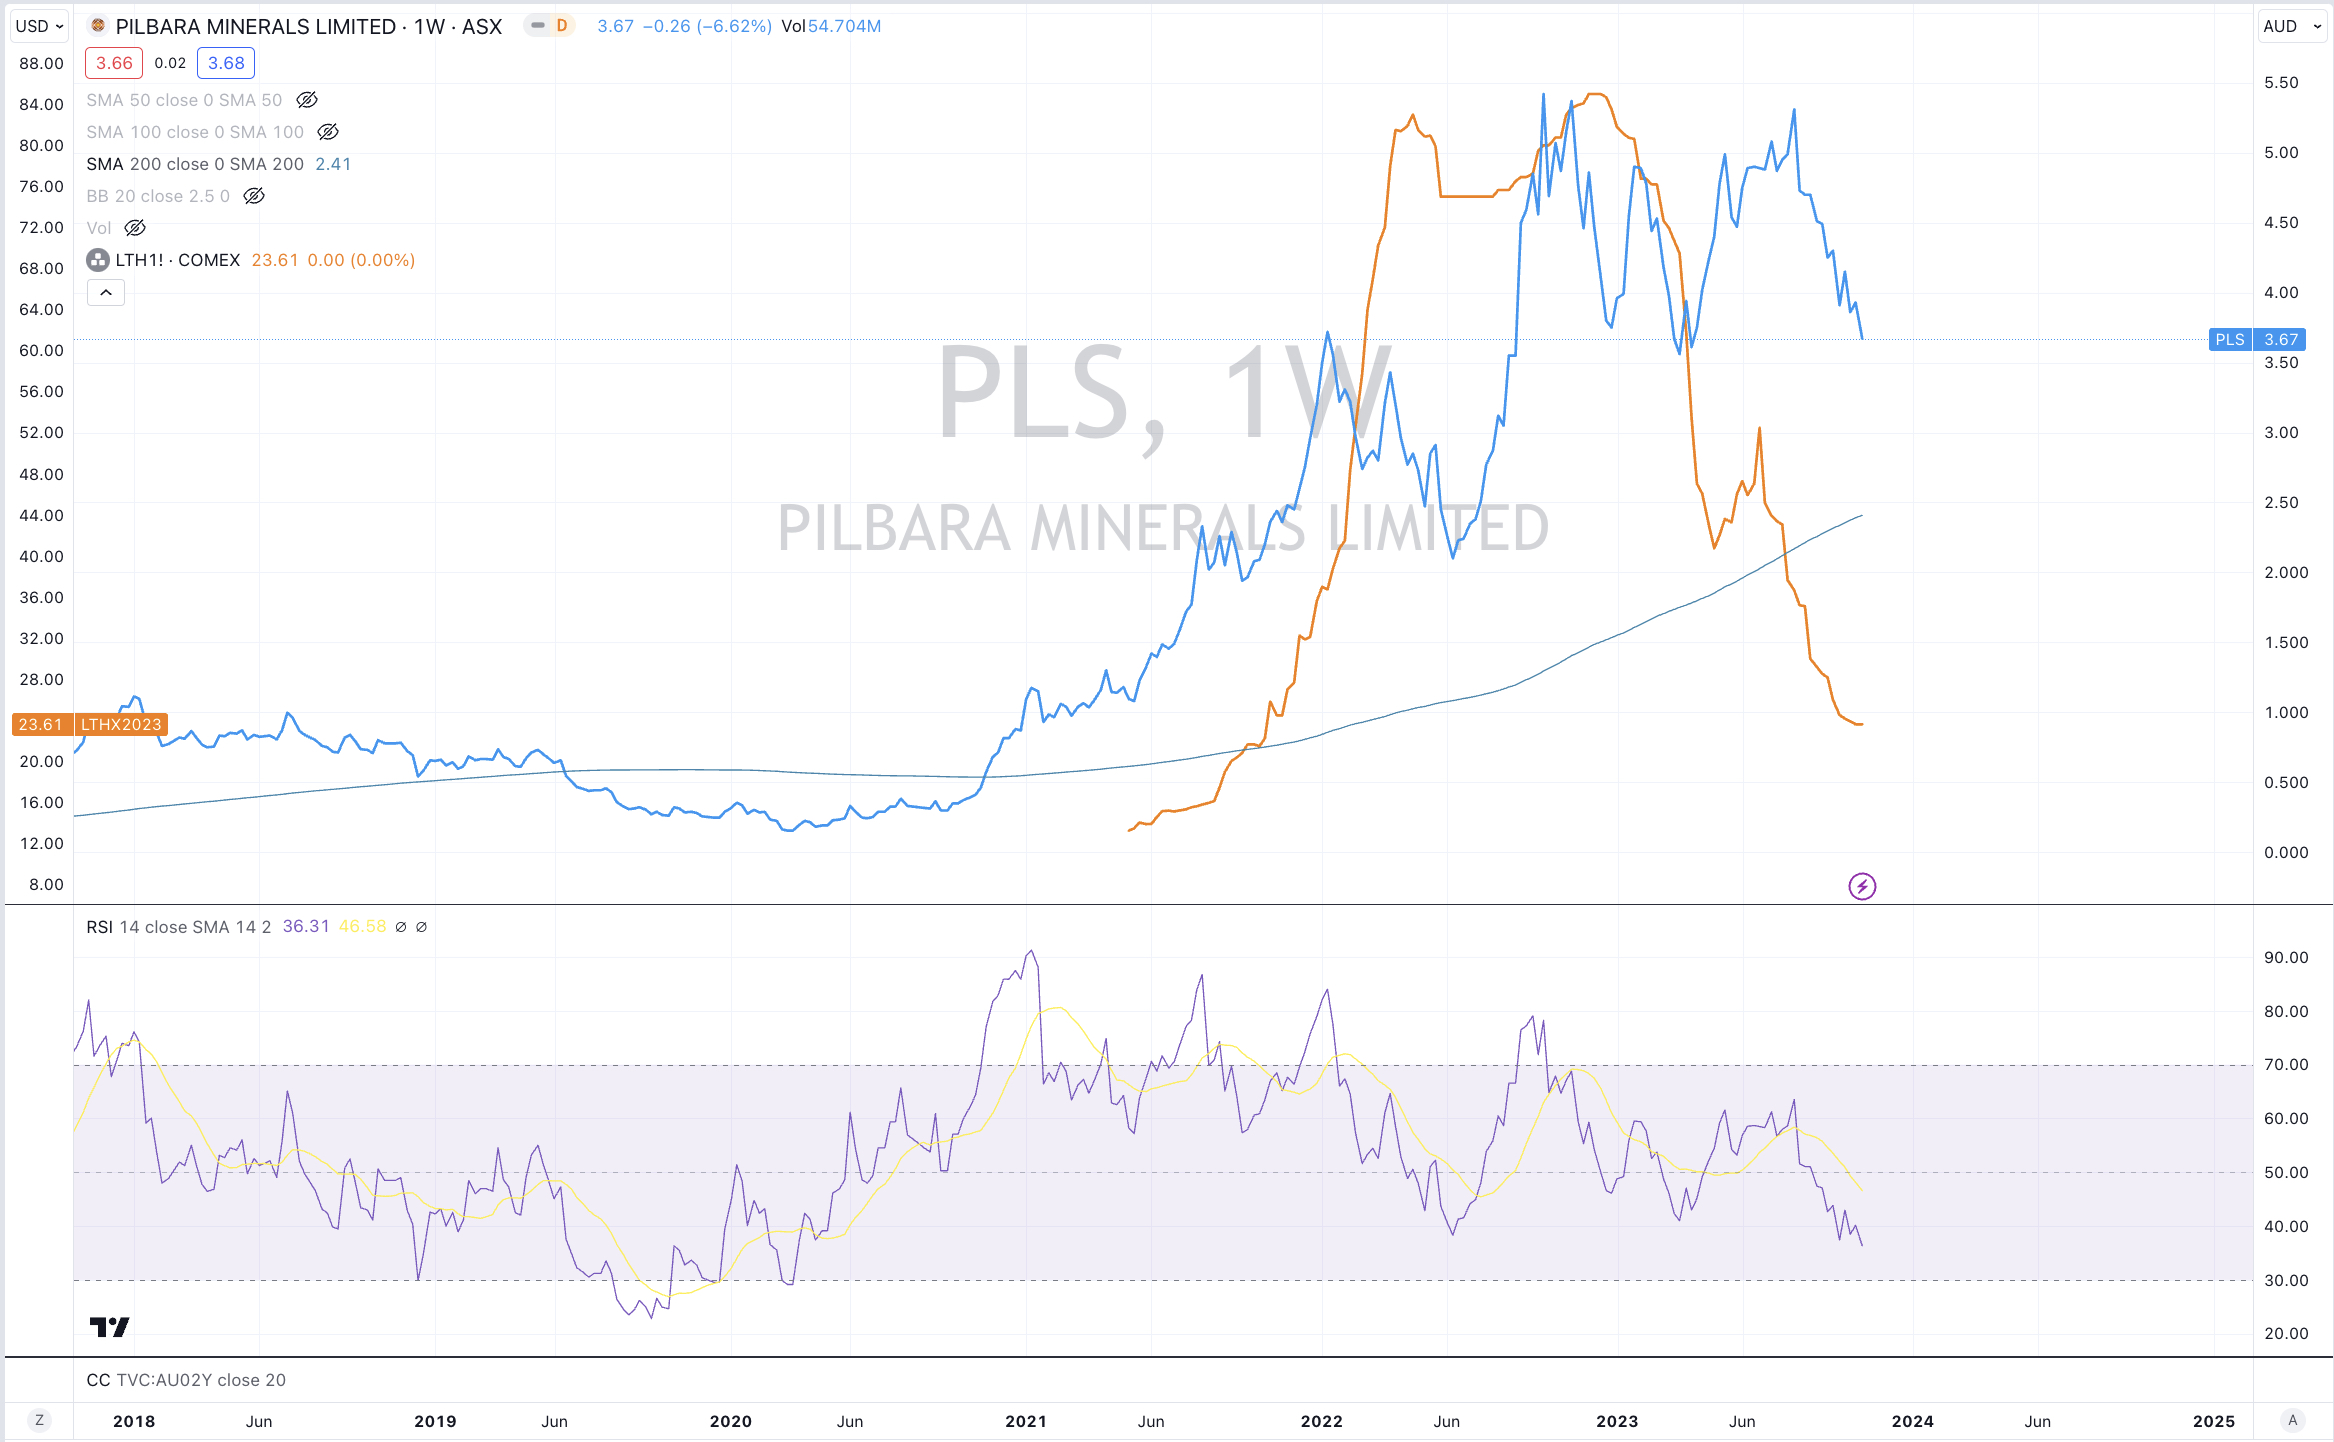
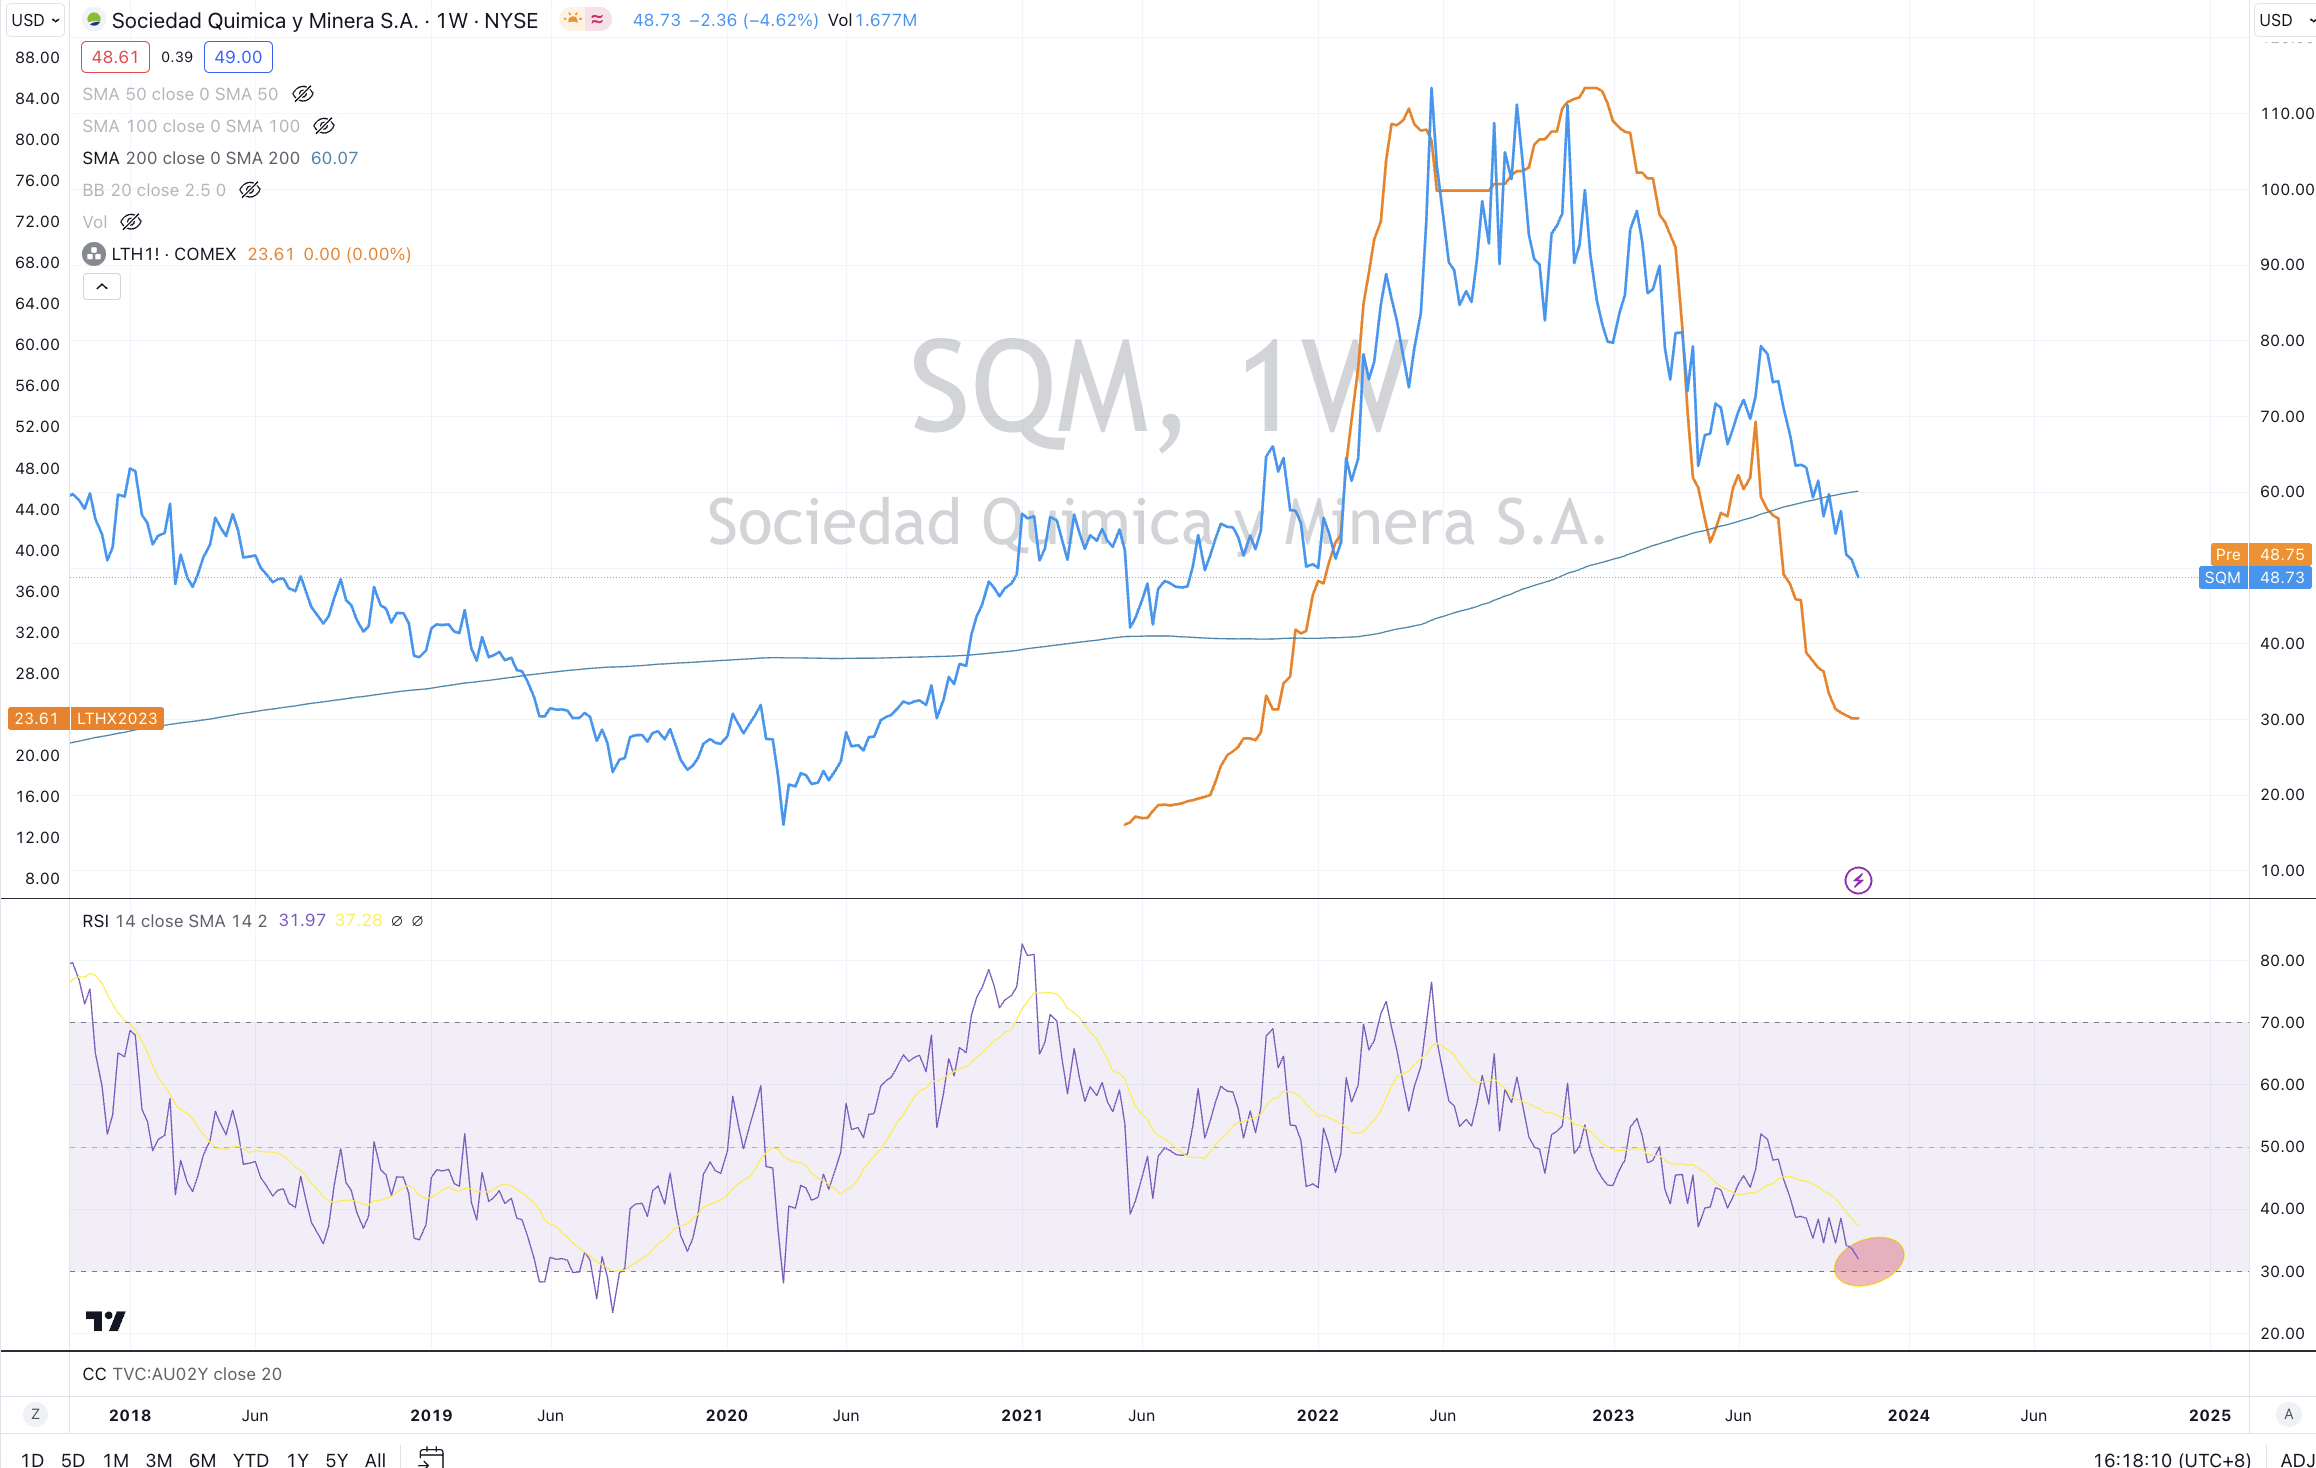
It is not a surprise that Lithium related stocks are falling.

They are mean reverting….back to their 200 week moving average (200 WMA).

Some have already done so, while others have more to go.

Some have registered oversold weekly readings too. Others are yet to do it.

In the weekly charts below, the stock price for each featured company is represented by the blue line.

The lithium hydroxide (Comex) futures price is in orange.

While some of the companies are mining (producing) lithium spodumene or lithium carbonate, you get the picture.

Before all of this carnage, many of them were trading at extreme percentages above that 200 WMA. That was a major warning back then which I wrote about and clients received those views directly.

Their fundamental valuations and capital expenditure plans is another discussion.

Gravity is indeed a bitch.

October 31, 2023

by Rob Zdravevski

rob@karriasset.com.au
Pfft…..higher for longer

I think interest rates fall and mean revert.

Specifically, I expect the Australian 10 year bond yield to pull back to the 3% mark in the coming 6-12 months.

It’s currently at 4.88%

Once upon a time, I heard many investors say that would take a 5% return “any day of the week”.

Empirically, the Australian 10 year bond yield has no business being extended this far above its 200 week moving average, especially when coupled with the quantum of the move from its recent depths.

You should find this analog in (many) other government bond yields.

Falling bond yields should ignite discussion that diminishing and continuing negative real interest rate returns makes a positive case for being long equities.

There is also a trap for those fixing their borrowing rates today, possibly at the wrong end of the pendulum frenzy,

while falling rates could put some zip back into those ‘unprofitable’ tech stock stories again?

October 30, 2023

by Rob Zdravevski

rob@karriasset.com.au

Macro Extremes (week ending October 27, 2023)

A weekly Macro, Cross Asset review of prices trading at extremes which may generate future investment ideas and opportunities.

The following assets (on a weekly timeframe) either registered an Overbought or Oversold reading and/or have traded more than 2.5 standard deviations above or below its rolling mean.

Extremes “above” the Mean (at least 2.5 standard deviations

Australian 3 year government bond yields 

Australian 5 year government bond yields

Swiss and U.K. 10 year government bond yields 

U.S. 5 year bond minus 3 month bill yield spread

Natural Gas

Gold as priced in AUD and CAD

EUR/JPY

Overbought (RSI > 70)

Chilean, Japanese, Turkish and U.S. 10 year government bond yields 

Japanese 5 year government bond yield

U.S. 30 year government bond yields

TBT & TBX

U.S. 10 year bond yield minus German 10 year bond yield spread

U.S. 10 year minus 10 year breakeven inflation rate

Cocoa

Orange Juice

Uranium 

And Rubber

The Overbought Quinella – Both Overbought and Traded at > 2.5 standard deviations above the weekly mean)

Australian 10 year government bond yield

U.S. 20 year government bond yield

Extremes “below” the Mean (at least 2.5 standard deviations)

Copper/Gold Ratio

Shangai Composite

CSI 300 

China A50

Dow Jones Industrials 

Dow Jones Transports

Nasdaq Composite

Spain’s IBEX

KOSPI

Nasdaq 100

ASX 200

S&P 500 

And the Copenhagen, Helsinki and Swiss equity indices 

Oversold (RSI < 30)

TLT

Lithium Hydroxide

Nickel 

JPY/USD

MYR/USD

IDR/USD

The Oversold Quinella – Both Oversold and Traded at < 2.5 standard deviations below the weekly mean)

Nasdaq Biotech Index

Indonesia & Thailand’s equity indices

And the ASX Industrials Index

Notes & Ideas:

Government bond yields fell except in Australia and Japan.

U.S. 5 – 7 year corporate bond yields aren’t overbought this week.

The U.S.10 year minus U.S. inflation rate just eased out of overbought land

And for the 2nd consecutive week, the U.S. 3 month bill isn’t overbought.

Equities continued its slide with another woeful week.

Chinese equities were the odd ones out, rising 1.5%.

The silver lining is that more equity indices are registering oversold extremes.

The CAC, DAX, FTSE 250, IBEX and the DJ Transports are all in 6 week falling streaks.

The latter has declined 19% in13 weeks helping it complete a mean reversion to its 200 week moving average.

The Russell 2000 has fallen for 7 of its past 8 weeks, sinking 9% in the past 3 weeks.

The S&P Small Cap 600 has also eased lower in 7 of tis last 8 week, as it’s now in a ‘new’ 4 week consecutive slide and has sunk 16.5% over the past 13 weeks.

Indonesia’s main index has fallen for the past 5 weeks.

The Nasdaq Biotech index touched its first oversold quinella since May 2022. The Nasdaq 100 and the S&P 500 are at 2.5 standard deviations below their weekly mean for the first time since May and June 2022 respectively.

Copenhagen has registered 7 weekly losses out of its past 9.

The KOSPI Index is at its lowest close since January 2023.

And Stockholm, Toronto’s TSX, the MidCap 400, Singapore’s Strait Times and the ASX 200…..all reverted down to their respective 200 week moving average.

Commodities were mixed, again during the week.

Most energy contracts were weaker while industrial and precious metals firmed. 

Baltic Dry Index isn’t overbought after sliding 24% and breaking its 7 week winning streak.

Inversely, Hot Rolled Coil Steel moved out of its 8 week residence in oversold territory after it rallied 23% in the past week.

Urea prices were amongst the losers for the week while Natural Gas was a notable winner.

Gold (as priced in CAD) has risen 11% over the past 3 weeks. 

Uranium remains overbought for an 11th consecutive week.

while Lithium Hydroxide declining streak extends to 16 consecutive weeks.

Amongst currencies, the Australian Dollar was stronger agains all except the ZAR and THB.

The Loonie was weaker.

The BRL/USD has risen for the past 3 weeks after having declined steadily for the past 3 months to complete its mean reversion.

The GBP/AUD had a bearish outside week.

The JPY/USD is still floating around the extremes.

And the Indonesian Rupiah is in a 8 week losing streak versus the USD.

The larger advancers over the past week comprised of;

Aluminium 1.9%, Cocoa 4.3%, Cotton 2.4%, Lean Hogs 6.8%, Copper 2.3%, HRC 23.2%, Natural Gas 20.1%, Orange Juice 2.1%, Palladium 1.7%, Sugar 1.8%, Dutch TTF Gas 3.8%, Uranium 2.1%, Gold in CAD 2.5%, Oats 5.2%, CSI 300 1.5%, China A50 1.8%, HSCEI 1.8%, Mexico 1.5%, BIST 100 rose 2.6% and the ASX Materials Index rose 0.9%.

The group of decliners included;

Rotterdam Coal (5.8%), Baltic Dry Index (23.6%), WTI Crude Oil (2.9%), Gasoil (5.8%), Heating Oil (3.3%), Coffee (2.6%), LNG (4.2%), Newcastle Coal (4.9%), Nickel (2.1%), Gasoline (2.5%), Urea U.S. Gulf (5.2%), Brent Crude (3.9%), Urea Middle East (7.1%), Corn (3%), Wheat (1.8%), JKM (2.7%), KBW Banks (2.2%), DJ Industrials (2.1%), DJ Transports (6.2%), S&P SmallCap 600 (2.3%), Nasdaq Composite (2.6%), KOSPI (3%), Nasdaq Biotech’s (4.1%), Nasdaq 100 (2.6%), Nifty (2.5%), Russell 2000 (2.6%), S&P Small Cap 600 Value (2.9%), SOX (2.7%), S&P MidCap 400 (2.8%), S&P 500 (2.5%), TAEIX (1.9%), Nasdaq Transports (3.5%), TSX (2%), FTSE 100 (1.5%), ASX 200 (1.1%), ASX Industrials (2.4%) and the ASX Small Caps fell 1.9%.

October 29, 2023

by Rob Zdravevski

rob@karriasset.com.au
Even mega caps have volatility

Last night, Microsoft (MSFT:US) shares fell 4%, which means its market cap declined by US$92 billion.

In Australian Dollars that equals A$143 billion or nearly the total market capitalisation of the Commonwealth Bank of Australia.

But it’s OK, for in the previous day, its market cap rose by US$75 billion.

Even more impressively, 92 million shares traded over the past 2 days.

While that’s only 1.3% of their outstanding shares, it equates to US$31 billion worth of stock changing hands (or A$49 billion).

For some reference, the daily average value of the shares traded on the whole of the Australian (ASX) stockmarket is approximately A$5 billion (or US$3.2 billion).

Furthermore, Alphabet (Google) (GOOGL:US) has seen it’s stock price fall 12% over the past 2 days, meaning its market cap declined by US$211 billion or A$332 billion.

(The combined total market cap of Rio Tinto and BHP is ~ A$390 billion).

Over those days, 141.4 million shares traded or US$17.7 billion worth of stock.

And that’s just the Class A shares.

October 27, 2023

by Rob Zdravevski

rob@karriasset.com.au
ASX 200 Standard Deviations Extremes

The market swoon in the ASX 200 should be nearing its conclusion.

The ASX 200 is a whisker from trading 2.5 standard deviations below its weekly mean.

The study below shows the various moments it has done so over the past 10 years.

Probability suggests allocating money at such moments but you’ll be disappointed if you’re seeking quick results.

October 26, 2023

by Rob Zdravevski

rob@karriasset.com.au