Newsletter – When the ‘noise’ is the loudest
April 9, 2024 Leave a comment
Readers can also read and subscribe to this newsletter at this link
https://mailchi.mp/karriasset/listening-to-the-investing-noise_1
Trying to hear what's not being said
April 9, 2024 Leave a comment
Readers can also read and subscribe to this newsletter at this link
https://mailchi.mp/karriasset/listening-to-the-investing-noise_1
April 7, 2024 Leave a comment
A weekly Macro, Cross Asset review of prices trading at extremes which may generate future investment ideas and opportunities.
The following assets (on a weekly timeframe) either registered an Overbought or Oversold reading and/or have traded more than 2.5 standard deviations above or below its rolling mean.
Extremes “above” the Mean (at least 2.5 standard deviations
U.S. 10 year yield minus German 10 year yield
U.S. 10 year yield
Aluminium
Bloomberg Commodity Index
WTI Crude Oil
Copper
S&P GSCI
Brent Crude Oil
Silver in USD
AUD/JPY
AUD/THB
USD/IDR
USD/SEK
USD/PHP
USD/BRL
MXN/USD
COP/USD
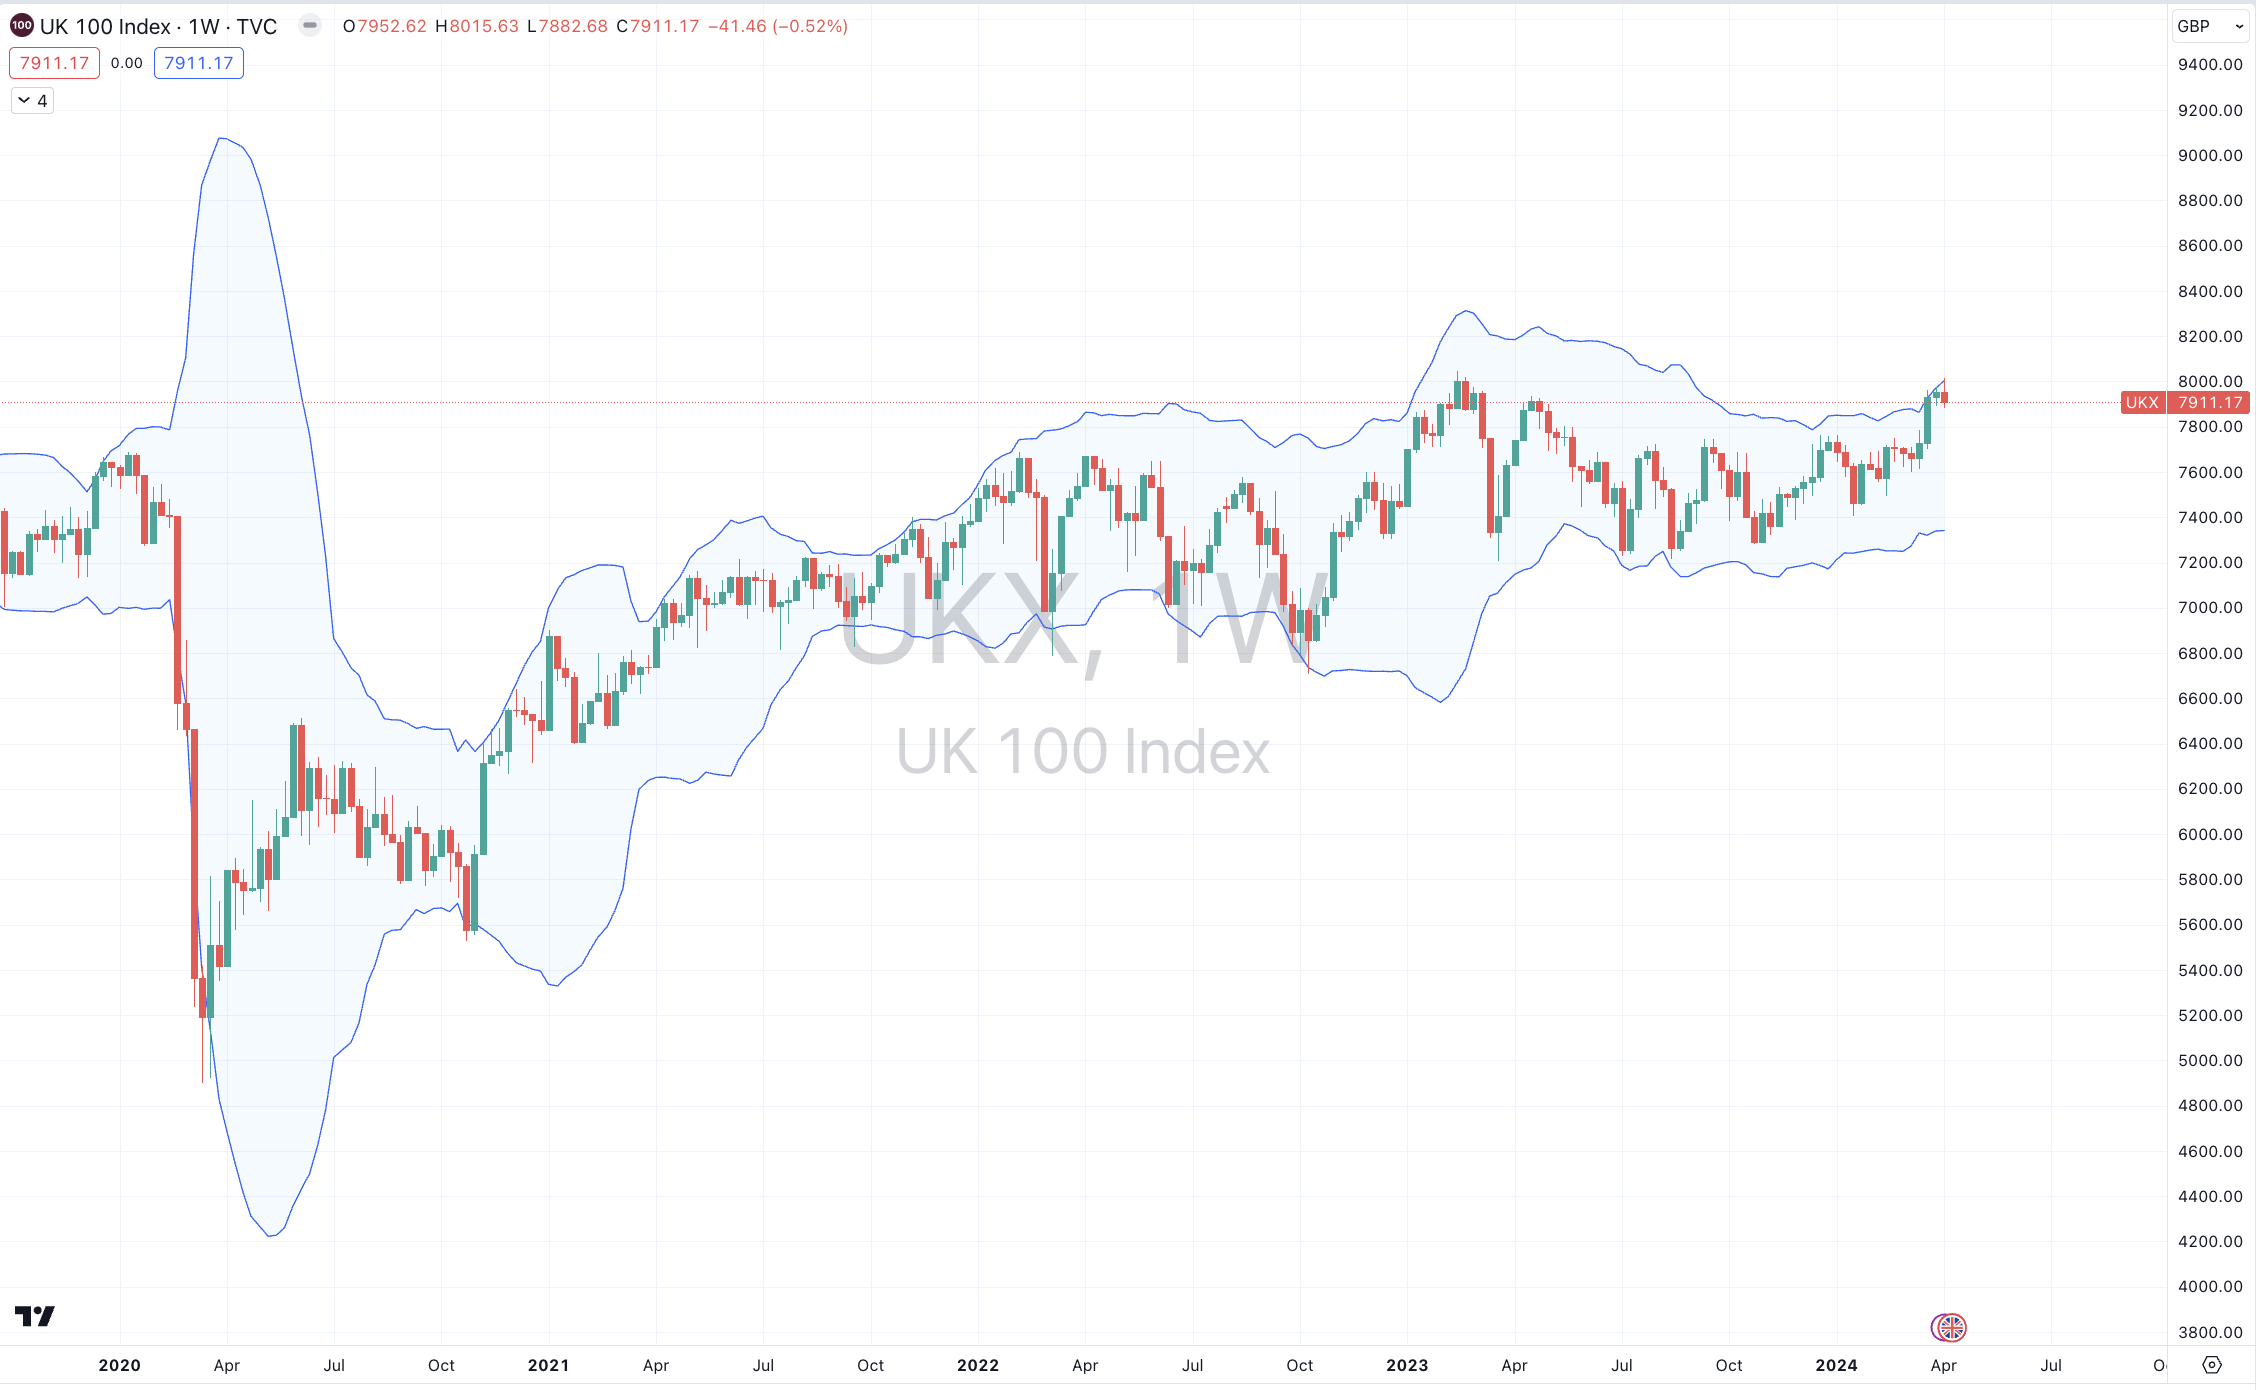
And Britain’s FTSE 100 Index
Overbought (RSI > 70)
Russian 10 year bond yield
Cocoa
Coffee (Robusta)
AEX
KBW Bank Index
Budapest
DAX
Pakistan’s KSE
Italy’s MIB
Nifty 50
TAIEX
Toronto’s TSX
BIST 100
And the S&P 500 Index
The Overbought Quinella – Both Overbought and Traded at > 2.5 standard deviations above the weekly mean)
Coffee (Arabica)
Biodiesel
CRB Index
Silver in AUD
Gold in AUD, CAD, CHF, EUR, GBP, USD and ZAR
Extremes “below” the Mean (at least 2.5 standard deviations)
Australia 10 year yield minus U.S. 10 year yield
North European Hot Rolled Coil Steel (HRC)
Lumber
Oats
Rice
CHF/AUD
Oversold (RSI < 30)
Chinese 10 year government bond yields
Lithium Hydroxide
Iron Ore
Shanghai Rebar
The Oversold Quinella – Both Oversold and Traded at < 2.5 standard deviations below the weekly mean)
Australian Coking Coal
Chinese Coking Coal
Notes & Ideas:
For the week, government bond yields rose.
While Chinese and Russian 10 year yields appearing either end of their pendulums, many yields are showing signs of breaking north of their recent sideways pattern.
The Japanese 2’s are amongst the nearest other bond yield to approach an extreme.
And we see some yield spreads appear in this week’s list.
Equities mainly fell for the week, across the world.
Regular readers wouldn’t be surprised about this weeks declines, considering the implied probability that rises when we saw the the long list of overbought equity indices appearing over the past few weeks editions.
The following equity indices dropped out of overbought territory;
KBW Bank Index, CAC 30, IBEX, Dow Jones Industrial Average, Nasdaq Composite, S&P MidCap 400, Vietnam, Nasdaq Transports & the Philadelphia SOX and the Nikkei 225.
The latter fell 3.4% of the week.
Oslo is in a 6 week winning streak, while Mexico’s main index has put together 4 weeks of consecutive higher prices.
Toronto’s TSX extends its winning streak to 8 weeks.
The DAX broke 8 week winning streak and Italy’s MIB broke its 9 week rising run. Both these indices joined the Nasdaq 100, SMI, ASX 200 and SOX in performing an bearish outside reversal week.
Commodities were generally higher and it is where most of the week’s action was.
The major commodity indices have returned to overbought status, mainly driven by the energy and the industrial and precious metals.
Gold prices across various currencies remains overbought, with their weekly performances listed below.
Renewed media noise about the rise in oil and copper prices coincides with them trading at overbought extremes.
Coffee prices were there largest gainers for the week. Arabica played catch up to Robusta Coffee, the latter having risen 22% over the past 6 weeks.
Prices related to steel production such as coking coal, iron ore, rebar, are all in oversold territory.
The “coking coals” have fallen for 7 straight weeks, with Australian Coking Coal prices falling 32% over that time.
The Baltic Dry Index has slumped 35% over the past 3 weeks.
While U.S. Midwest Hot Rolled Coil Steel is approaching oversold territory, the North European price did so, this past week.
Crude Oil, Copper, Tin and Silver moved out of overbought territory.
Rice has fallen for 6 consecutive weeks and its price has declined 15% over that time.
Oats are oversold and have produced a 35% decline from their overbought extreme seen in August 2023.
Cocoa has been overbought for 24 weeks.
Aluminium has risen for 6 straight weeks.
And Lithium Hydroxide has now spent 39 consecutive weeks in weekly oversold territory.
Currencies saw a bit more activity this week, with a few more currencies return to the ‘extremes’ list.
The AUD rose.
The CAD was weaker as was the Yen.
The Euro was mainly firmer, reversing last week’s weakness.
The British Pound was mixed for the week.
The USD was also mixed as we see it exhibit ‘extreme’ strength versus the Indian Rupee, Swedish Krona, Philippine Peso and Brazilian Real yet it is trading at ‘extreme’ weakness against the Colombian and Mexican Peso’s.
In fact, the USD has risen for 5 straight weeks against the BRL.
And the Kiwi has declined for 6 consecutive weeks versus the Aussie.
The larger advancers over the past week comprised of;
Aluminium 4.9%, Bloomberg Commodity Index 3.4%, WTI Crude 4.5%, Lean Hogs 3.1%, Copper 5.7%, Heating Oil 5.7%, Coffee 12.5%, Nickel 6.4%, Platinum 2.1%, Gasoline 2.5%, Biodiesel 5%, Robusta Coffee 8.3%, Raw Sugar 2.2%, S&P GSCI 3.3%, CRB Index 2.5%, Brent Crude Oil 4.5%, Gasoil 6.5%, Silver in AUD 9.1%, Silver in USD 10.1%, Gold in AUD 3.3%, Gold in CAD 4.7%, Gold in CHF 4.4%, Gold in EUR 3.9%, Gold in GBP 4.2%, Gold in USD 4.3%, Budapest 1.8%, Egypt 3.4%, MOEX 1.9%, Oslo 1.8% and Turkiye’s BIST 100 climbed 5.2%.
The group of largest decliners from the week included;
Australian Coking Coal (7.7%), Baltic Dry Index (10.6%), Cocoa in London (3.4%), China Coking Coal (3.6%), Cotton (5.6%), North Europe HRC (3.7%), Lumber (2.4%), Cattle (3.7%), JKM LNG in Yen (2%), Lithium (9%), Newcastle Coal (2.1%), Palladium (1.4%), Sugar (2.3%), Dutch TTF Gas (2.7%), Urea U.S. Gulf (2%), Corn (1.8%), Oats (7.2%), All World Developed ex-USA (1.3%), KBW Banking Index (2.8%), CAC (1.8%), DAX (1.7%), DJ Industrials (2.2%), DJ Transports (1.8%), MIB (2.1%), IBEX (1.4%), Indonesia (2.6%), S&P SmallCap 600 (2.6%), Russell 2000 (2.8%), KRE Banking Index (4.1%), S&P MidCap 400 (1.9%), Nasdaq Biotech (3.5%), Nasdaq 100 (0.8%), Nikkei 225 (3.4%), Phillipines PSE (2.3%), SMI (2%), SOX (1.8%), Chile (2%), S&P 500 (1%), Nasdaq Transports (1.6%), Vietnam (2.3%), ASX Small Caps (1.7%) and the ASX 200 fell 1.6%.
April 7, 2024
by Rob Zdravevski
rob@karriasset.com.au
April 7, 2024 Leave a comment
The #FTSE 100 is trading at what I’d call one of my ‘overbought extremes’.
Despite not being ‘stretched’ across all my measures, the lack of strength in its current upward trend suggests that its overbought state arrives with more significance.
The FTSE 250 is a different story.
April 7, 2024
by Rob Zdravevski
rob@karriasset.com.au
April 3, 2024 Leave a comment
Private Equity is about to become a forced buyer.
Private Equity Buyout Funds need to use its cash hoard (26% of the $1.2 trillion held is considered aged) or perhaps lose it.
You don’t earn any fees if you hand money back to investors.
But seldom do forced buyers find bargains.
And then let’s add some leverage (interest rates are 4 times higher than 2 years ago)……..then achieving an adequate return from ‘Private Equity’ may be stressed and ambitious, at the very least.
April 3, 2024
by Rob Zdravevski
Karri Asset Advisors
rob@karriasset.com.au

April 3, 2024 Leave a comment
How about buying #Tesla stock at $114.50 or $82?
That would be nice.
I’ll wait and watch but that might be a stretch.
Perhaps $146.60 is the interim entry point?
#TSLA is currently $166.63
April 3, 2024

April 2, 2024 Leave a comment
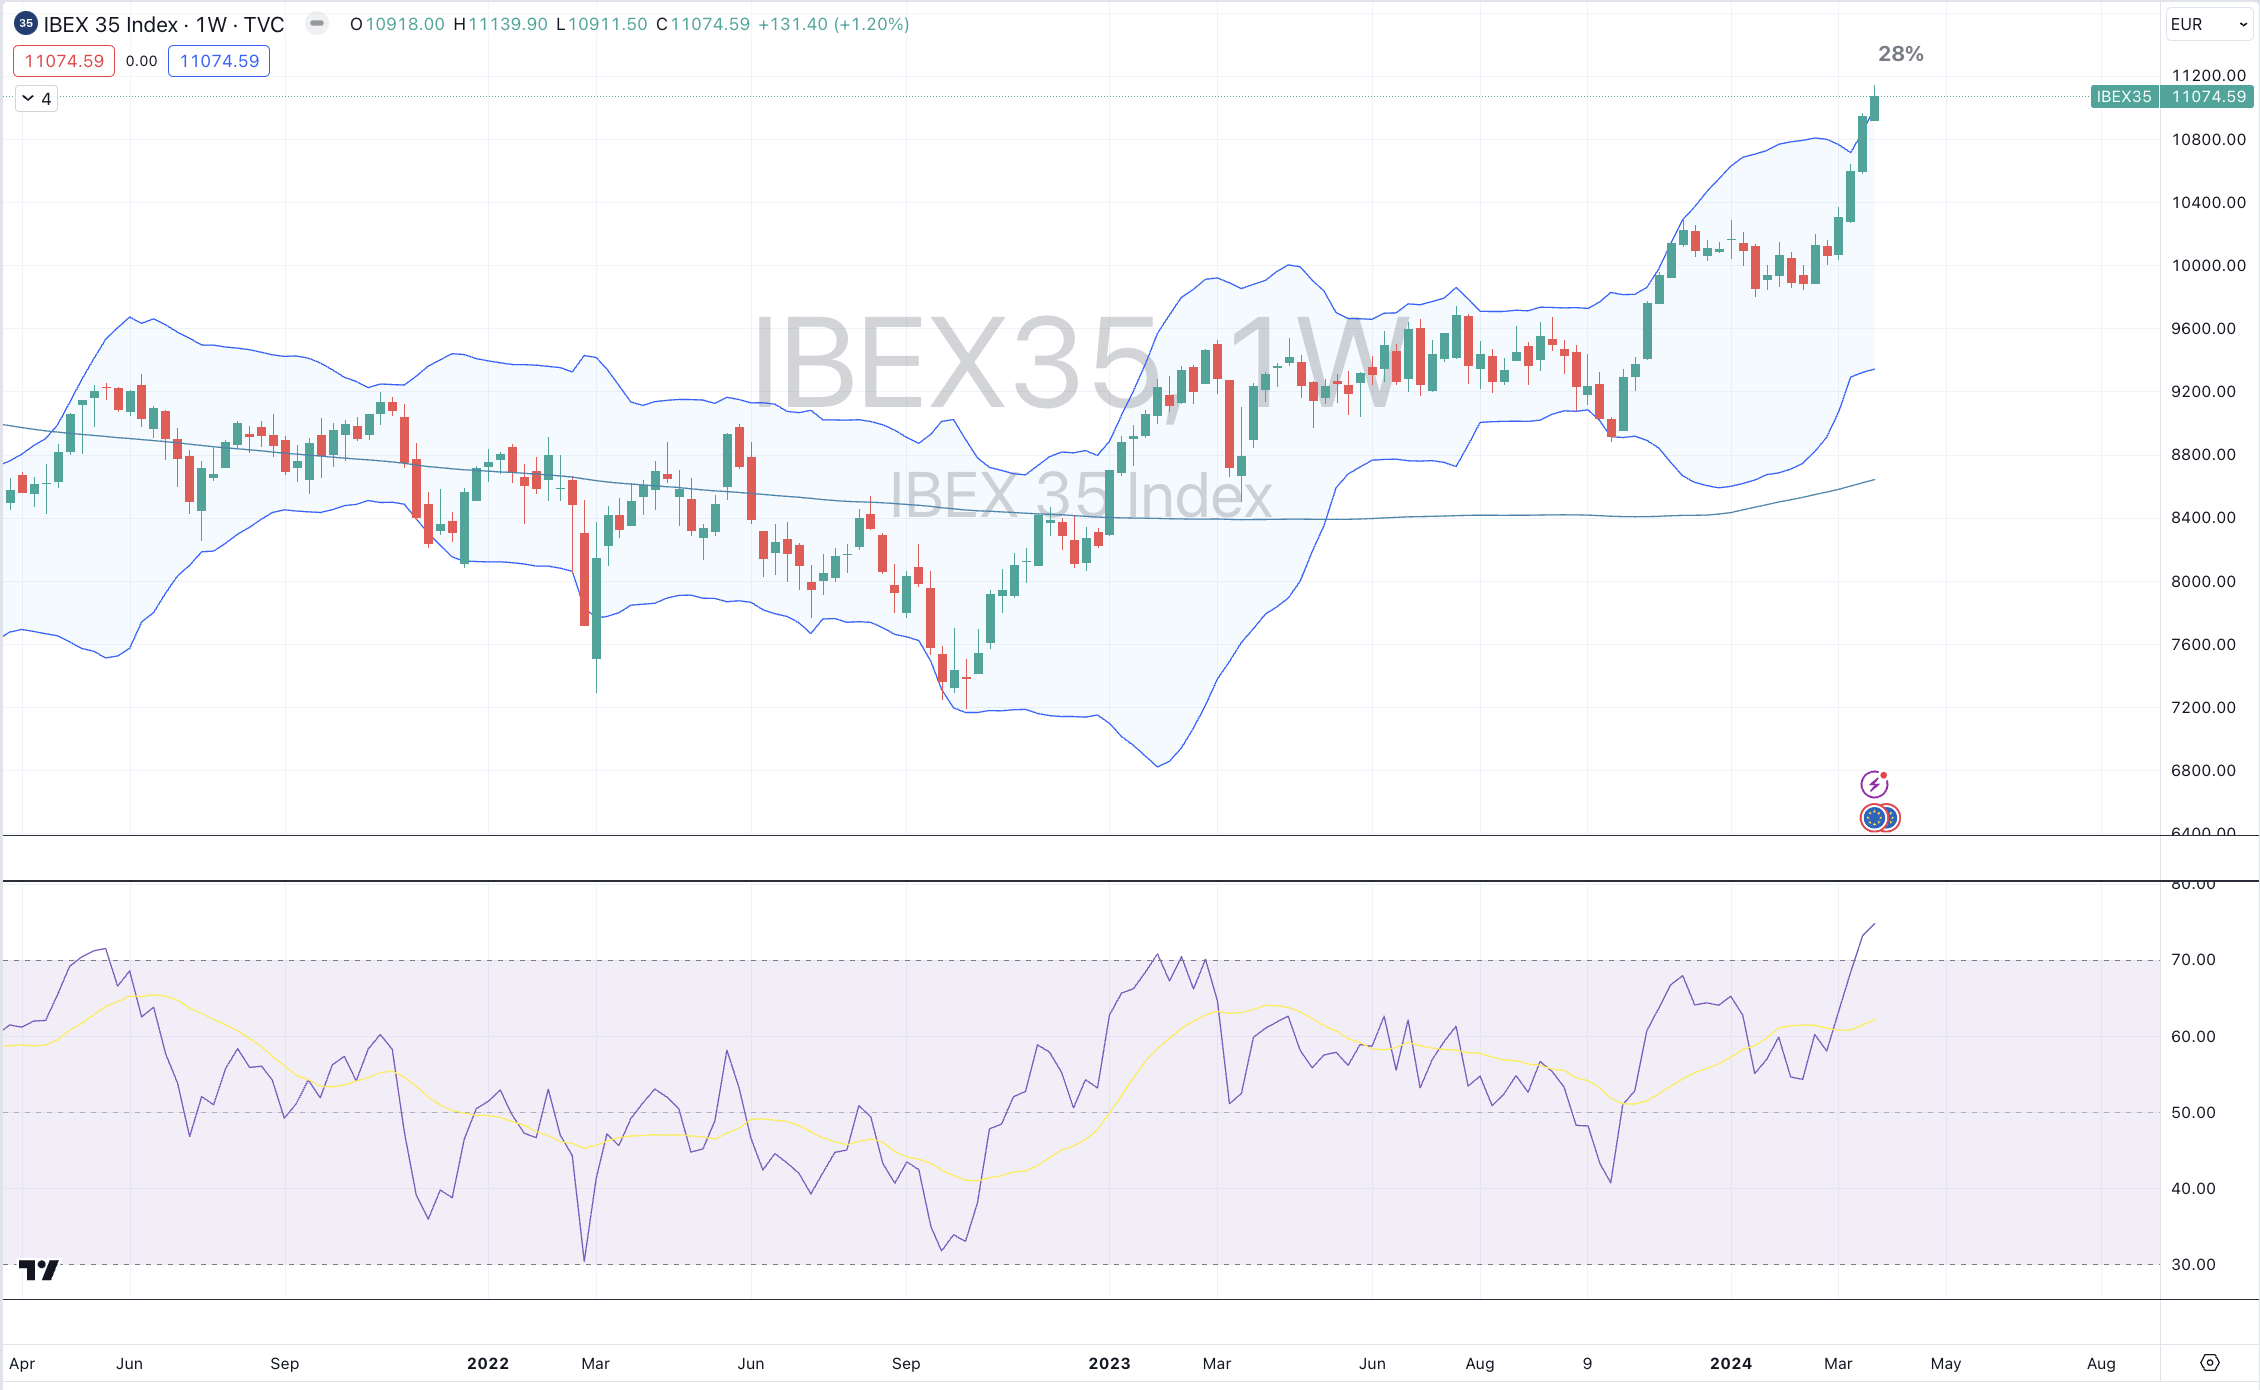
We are starting to reduce allocation to Spanish equities.
Our various measures tell us that #Spain‘s #IBEX index at 11,075 points is “full” and approaching the latter part of its advance and so probability suggests that the ‘fat part of the trade’ has been seen.
Hemos visto la parte suficiente del comercio.
April 2, 2024
by Rob Zdravevski
Karri Asset Advisors
rob@karriasset.com.au
#Espana

March 31, 2024 Leave a comment
A weekly Macro, Cross Asset review of prices trading at extremes which may generate future investment ideas and opportunities.
The following assets (on a weekly timeframe) either registered an Overbought or Oversold reading and/or have traded more than 2.5 standard deviations above or below its rolling mean.
Extremes “above” the Mean (at least 2.5 standard deviations
CRB Index
AUD/THB
MXN/USD
Overbought (RSI > 70)
Biodiesel
Robusta Coffee
AEX
KBW Bank Index
Budapest
CAC 30
DAX
Dow Jones Industrial Average
Italy’s MIB
Nasdaq Composite
S&P MidCap 400
Nikkei 225
Philadelphia SOX
TAIEX
Nasdaq Transports
Toronto’s TSX
FTSE 100
Vietnam
And the S&P 500 Index
The Overbought Quinella – Both Overbought and Traded at > 2.5 standard deviations above the weekly mean)
Russian 10 year bond yield
Gold in USD, AUD, CAD, EUR, GBP & CHF
Cocoa
IBEX
Extremes “below” the Mean (at least 2.5 standard deviations)
CHF/AUD
Oversold (RSI < 30)
Chinese 10 year government bond yields
Lithium Hydroxide
Rice
The Oversold Quinella – Both Oversold and Traded at < 2.5 standard deviations below the weekly mean)
Australian Coking Coal
Chinese Coking Coal
Iron Ore
Shanghai Rebar
Notes & Ideas:
For the week, government bond yields were mixed with a light bias towards weakness.
The Japanese 2’s and 5’s yield took a break from rising with the latter ending its 7 week winning streak.
Over the past several weeks, yields remain mostly in sideways travel.
Russian 10 year yields broke their 8 consecutive weeks of increases.
And there may be a change in trend for the U.S. 3 month bills.
Equities were higher, again.
Other than movers listed below, many indices remained subdued for the week.
The KBW Banking Index makes a return to overbought territory (having risen in 5 of the last 6 weeks) as does the S&P MidCap 400 and the FTSE 100.
While Stockholm eases out of that category.
Oslo is in a 5 week winning streak.
Toronto’s TSK extends its winning streak to 7 weeks.
The DAX is in 8 week winning streak.
Italy’s MIB advance extends to 9 consecutive weeks, has spent 7 weeks in overbought territory and is trading at its highest price since April 2008.
Egypt 30 index has tanked 12.4% over the past fortnight.
The Nasdaq 100 is 33% above its 2090 week moving average while the S&P 500 is 27% above the same measure.
Spain’s IBEX has registered an overbought quinella as it trades at its highest point since May 2017.
The FTSE 100 returns to the overbought territory.
And the CAC and DAX are still making new all-time highs.
Commodities were generally higher.
Gold prices across various currencies remains overbought.
Prices related to steel production such as coking coal, iron ore, rebar, are all in oversold territory.
The ‘coking coals’ have fallen for 5 straight weeks.
Furthermore, U.S. Midwest Hot Rolled Coil Steel is approaching oversold land too.
Crude Oil, Copper, Tin and Silver moved out of overbought territory.
Rice has fallen for 5 consecutive weeks and its price has declined 14% over that time.
Cocoa has been overbought for 23 weeks.
Aluminium has risen for 5 straight weeks.
And Lithium Hydroxide has now spent 38 consecutive weeks in weekly oversold territory.
Currencies were tempered for the week.
The AUD was mixed, while the CAD and GBP were stronger.
The Euro wea weaker.
The Yen eked out some small gains,
And the Kiwi has declined for 5 consecutive weeks versus the Aussie.
The larger advancers over the past week comprised of;
Roterdam Coal 5.7%, Cocoa 9.3%, WTI Crude Oil 2.8%, Lean Hogs 2.5%, Arabica Coffee 2.2%, LNH in Yen 1.9%, Newcastle Coal 5.7%, Palladium 2.3%, Robusta Coffee 3.8%, Sugar 3.1%, S&P GSCI 1.4%, Brent Crude Oil 1.6%, Gold in AUD 3.1%, Gold in CAD 2.8%, Gold in USD 3.2%, Gold in CHF 3.6%, Gold in EUR 3.3%, Gold in GBP 2.9%, KBW Bank Index 3.1%, DAX 1.6%, S&P Small Cap 600 2.6%, Russell 2000 2.6%, KRE Regional Banks 3.7%, Karachi 2.8%, S&P Midcap 400 2%, South Africa 2%, Chile 1.9%, ASX 200 1.6% and the ASX Materials, Industrials and Small Caps all rose 2% for the week.
The group of largest decliners from the week included;
Australian Coking Coal (10.5%), Baltic Dry Index (17.1%), China Coking Coal (10.5%), HRC Steel (3.2%), Iron Ore (9.3%), Lumber (3.9%), Natural Gas (3.8%), Nickel (2.8%), Nickel on MCX (4.2%), Shanghai Rebar (2.8%), Dutch TTF Gas (1.5%), Egypt 30 (5.2%) and the Nasdaq 100 fell 0.5%.
March 31, 2024
by Rob Zdravevski
rob@karriasset.com.au
March 30, 2024 Leave a comment
What if I don’t want to own and drive an electric vehicle?
I think the internal combustion engine is being discriminated against.
What if specialty fuels solve the lower emissions equation?
Why have #ethanol and #biofuels seemingly been removed from the vernacular?
And what if #hydrogen becomes a ‘thing’?
In amongst the hypocrisy of the #carbon ‘intensity’ that an #electricvehicle requires (or attracts), the internal #combustion #engine is not the ogre for those concerned….it is the #fuel or #energy required to fill up (or recharge) the vehicle.
What if my examples provide cleaner sources of propulsion than the mystical trickle of #electricity into an #EV?
then those fuels still require ‘combustion’…….
#ICE
#energy
March 29, 2024 Leave a comment
Spain’s IBEX is at its most overbought and stretched since April 2015…..but still NOT making an all-time high.
March 29, 2024
by Rob Zdravevski
Karri Asset Advisors
rob@karriasset.com.au
March 26, 2024 Leave a comment
The two most notable parabolic price moves in recent times is being seen in the price of Cocoa and NVIDIA shares.
Both prices are trading at stratospheric percentages above their 200 week moving averages.
Cocoa is trading 3.5 standard deviations above its rolling monthly mean and even more astonishing, at US$9,950 per ton, it is more expensive than Copper which is trading at US$8,870 per ton.
Mean reversion or mean convergence?
Gravity is real.


