Macro Extremes (week ending August 16, 2024)
August 18, 2024 Leave a comment
A weekly Macro, Cross Asset review of prices trading at extremes which may generate future investment ideas and opportunities.
The following assets (on a weekly timeframe) either registered an Overbought or Oversold reading and/or have traded more than 2.5 standard deviations above or below its rolling mean.
* denotes multiple week inclusion
Extremes above the Mean (at least 2.5 standard deviations)
Belgian and Danish 10 year government bond yields *
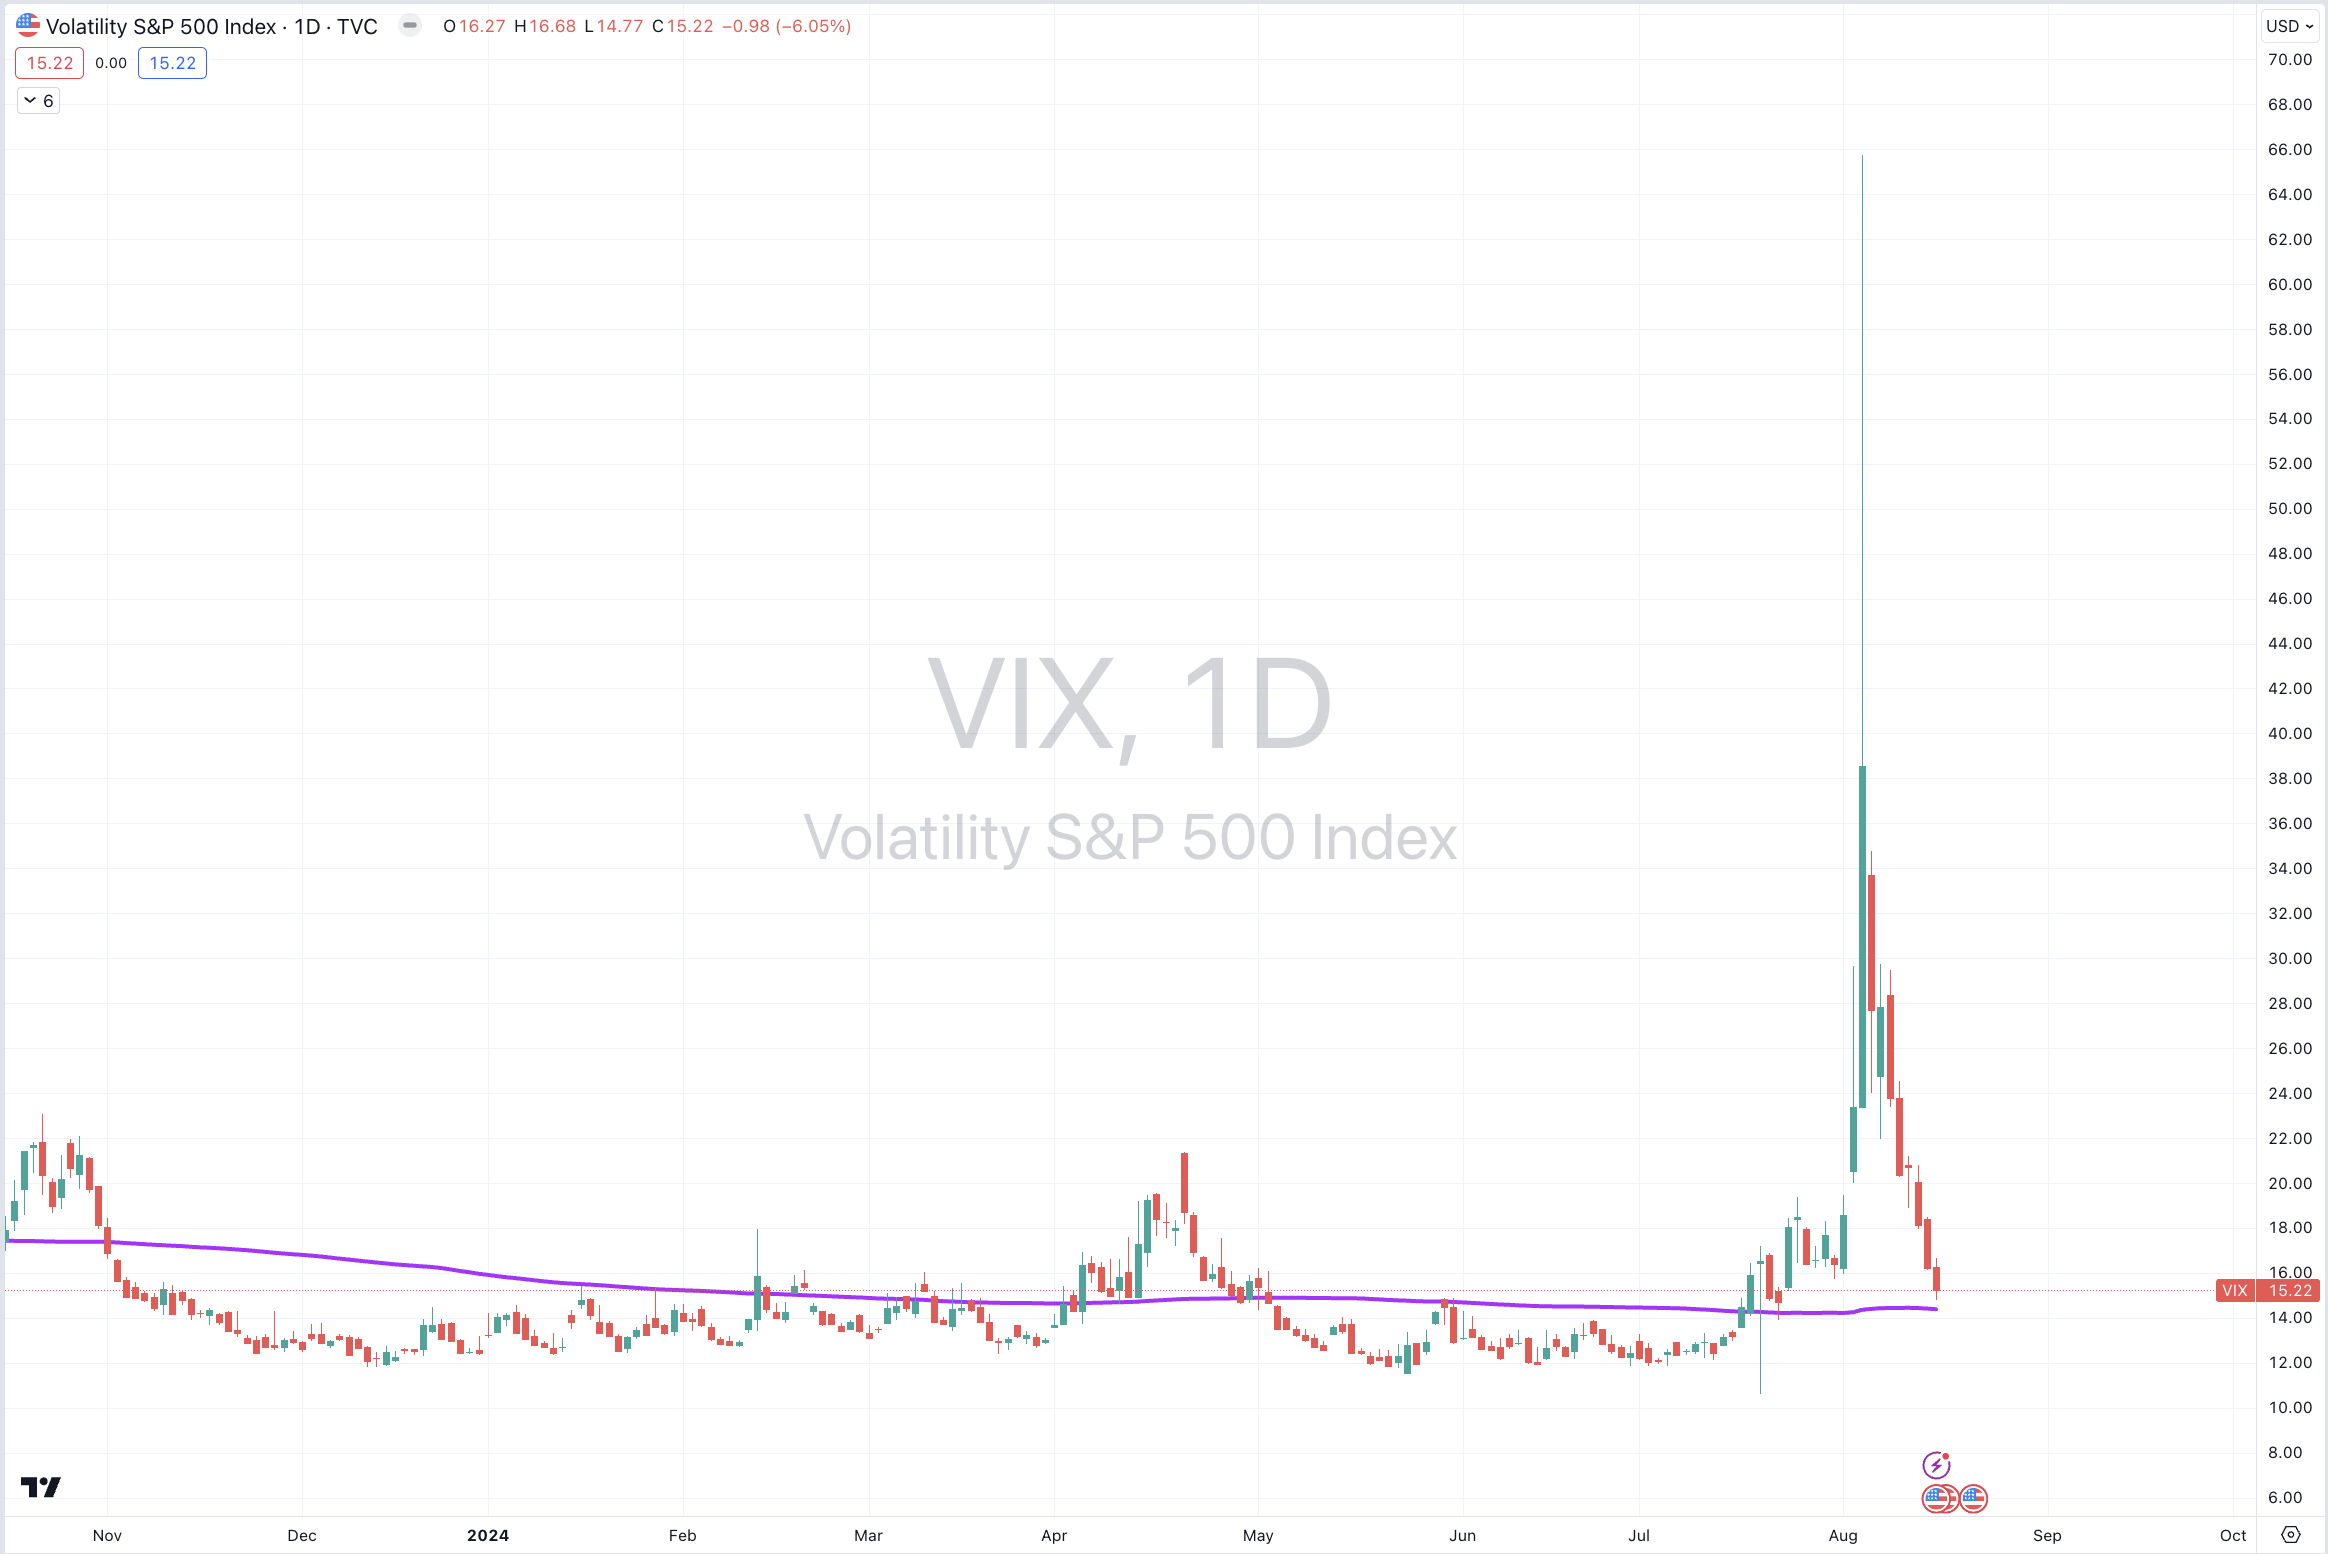
Gold Volatility Index *
CNH/USD *
EUR/USD *
THB/USD *
Brazil’s Bovespa
Overbought (RSI > 70)
Robusta Coffee
Gold as priced in AUD, CAD, EUR and GBP.
NIFTY
ASX Financials Index
The Overbought Quinella (Both Overbought and Traded at > 2.5 standard deviations above the weekly mean)
Gold in USD
MYR/USD *
Extremes below the Mean (at least 2.5 standard deviations)
Australian 3, 5 & 10 year bond yields
10 year Chilean, Spanish and Portuguese government bond yields.
Sugar No. 16
USD/IDR
ASX Materials Index
DXY (USD) Index
Oversold (RSI < 30)
Cotton *
North European Hot Rolled Coil Steel *
U.S. Midwest Hot Rolled Coil Steel *
Shanghai Rebar *
Lithium Hydroxide *
Corn *
Soybeans *
MOEX
The Oversold Quinella (Both Oversold and Traded at < 2.5 standard deviations below the weekly mean)
Australian Coking Coal
USD/SGD
Notes & Ideas:
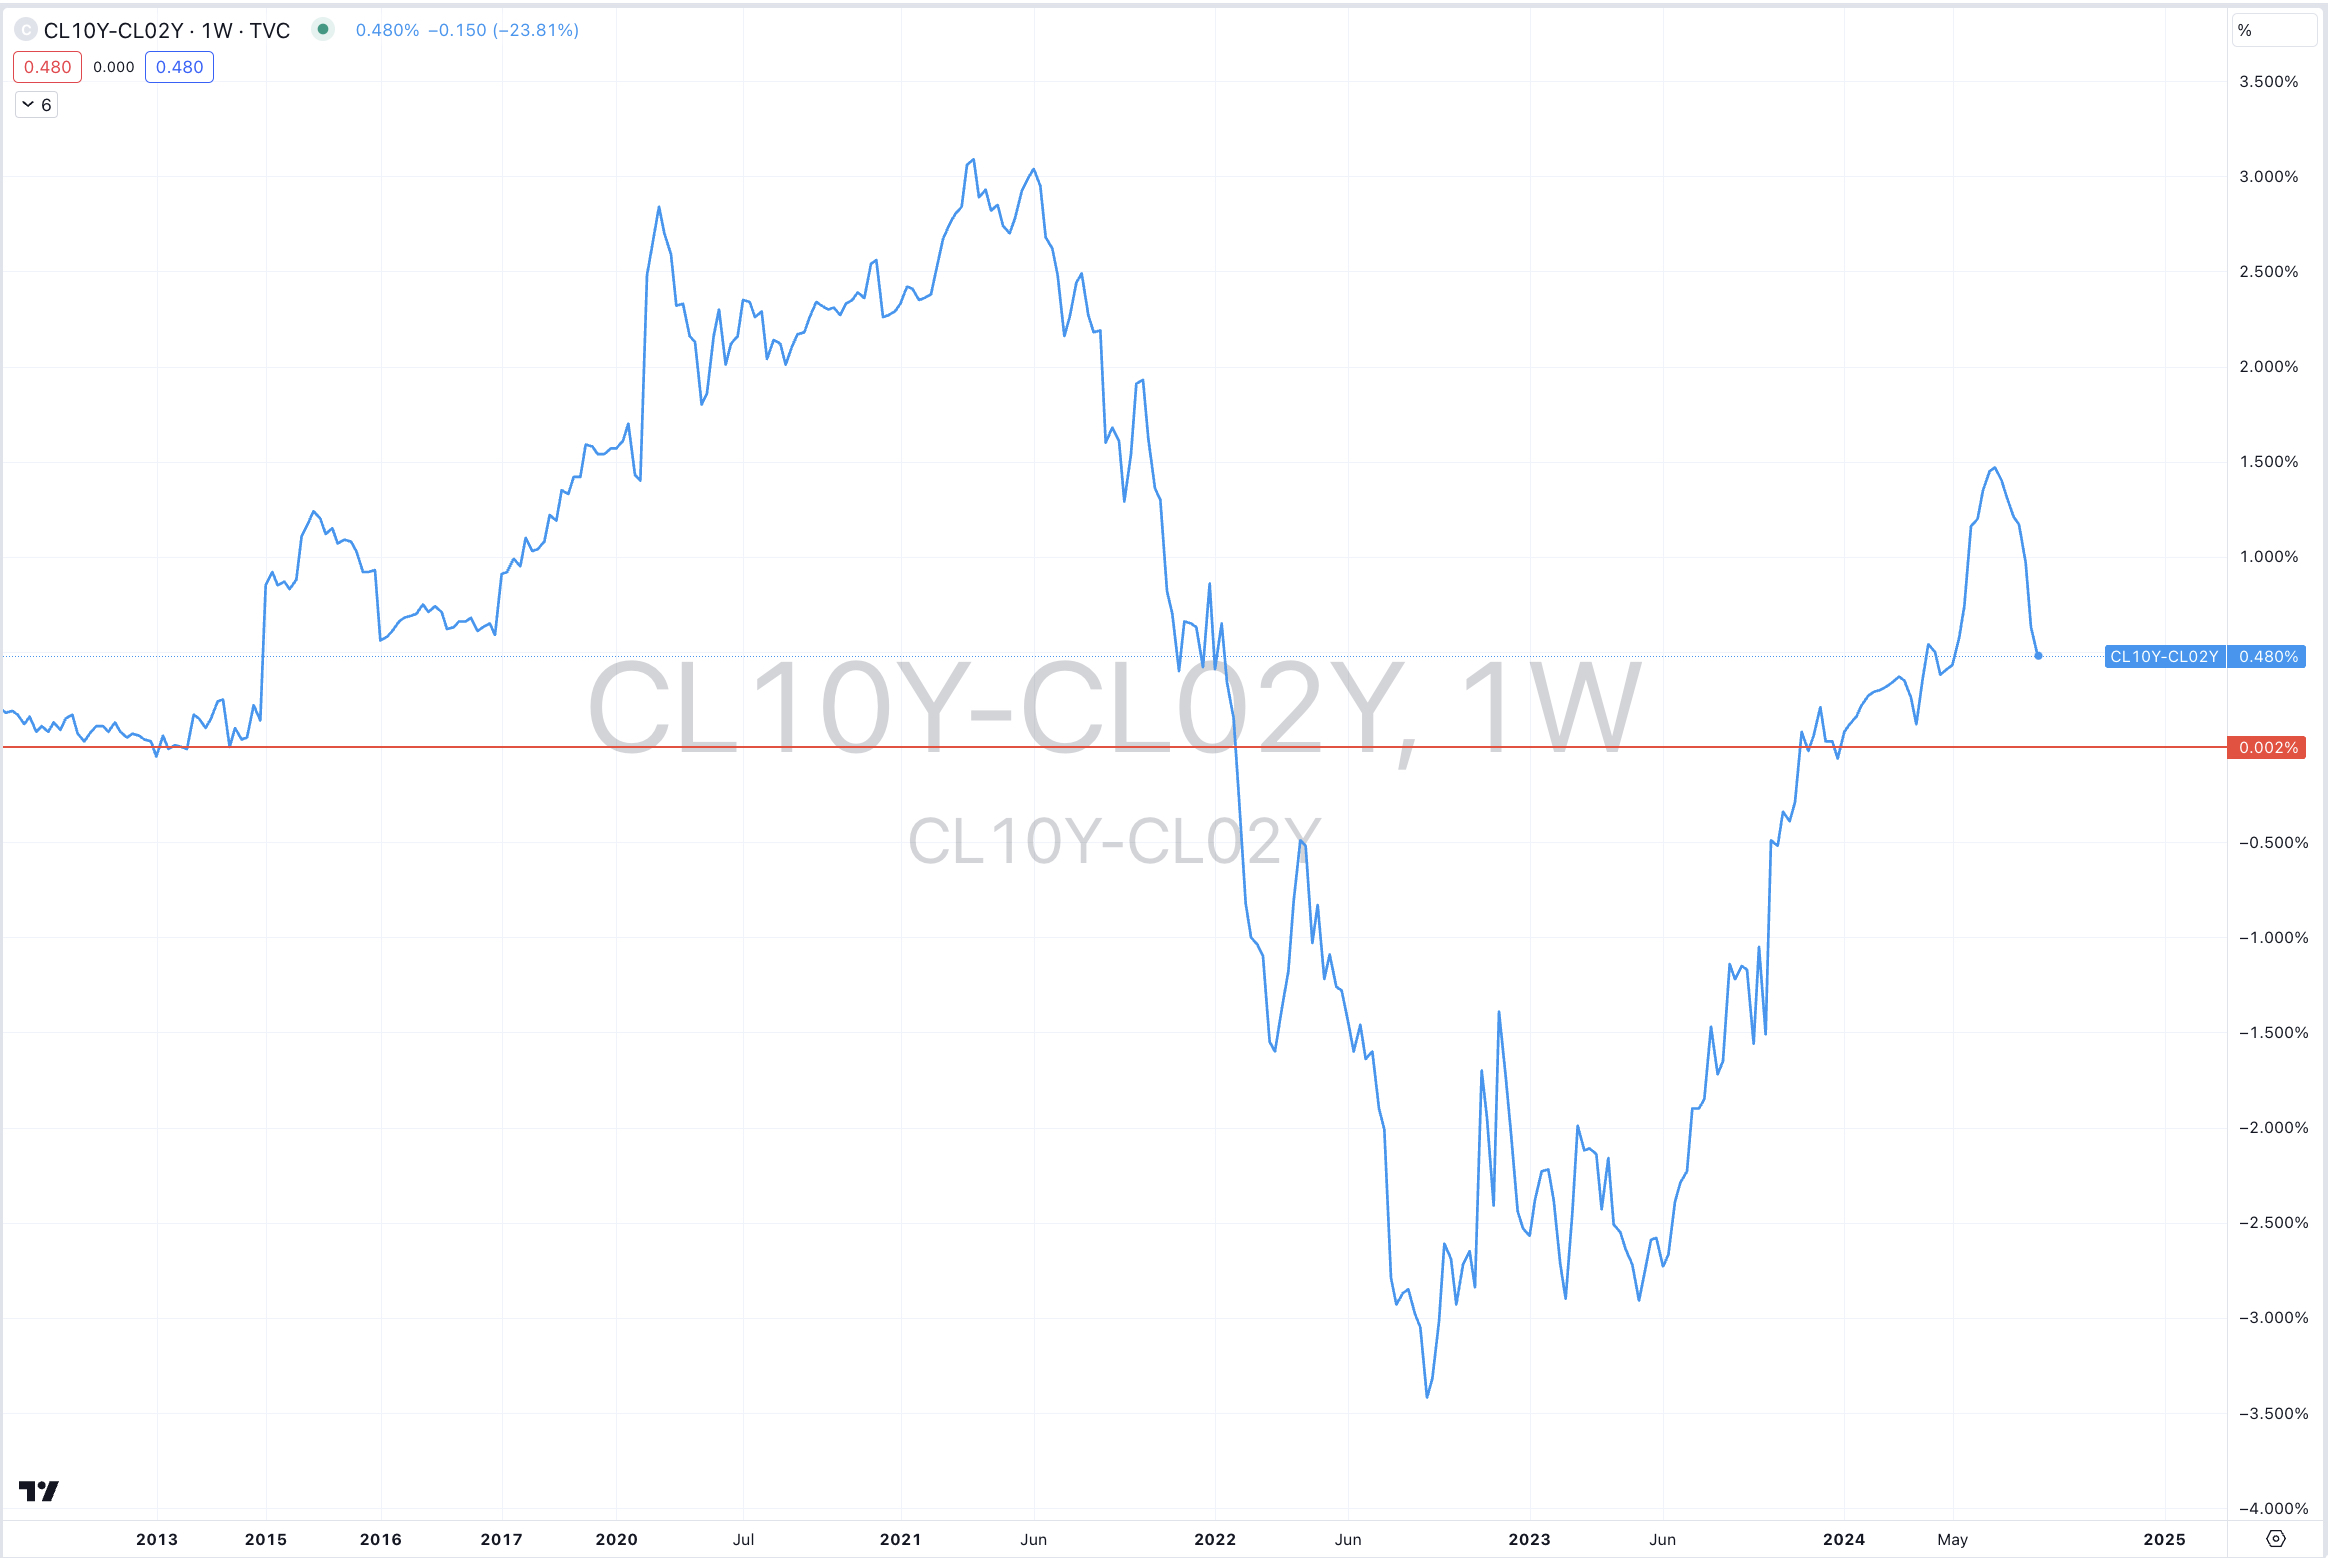
Global government bond yields fell.
The exception were Swiss, German, French, Norwegian yields along with shorter duration British paper and the the whole of the Japanese curve.
Many yields have left the oversold category this week with the remnants at the bottom end of their travels telling me that we should soon to see them reverse higher, at least back to their mid-point.
Rising yields will put pressure on any advance for ‘risk’ assets.
The Copper/Gold ratio broke its 5 week losing streak.
The Chilean yield streaks continue. The 2 year yield has risen for 9 straight weeks while the 10 year yield has fallen for 7 consecutive weeks.
Equities ripped higher.
The whole list of those invoices which rose 1.8% or greater are listed below.
All of those listed in last weeks list as being oversold, are no longer so.
Brazil’s BOVESPA and the SOX compounded last week’s gains.
The former is appearing in an overbought extreme category this week.
Australia’s Financials Index revisits overbought territory.
Inversely, the ASX Materials Index is in a 6 week losing streak and has registered an oversold entry.
The KOSPI broke its 5 week losing streak.
And the Nikkei 225 broke its 4 week streak of declines rising 9% and making up half of the 17% decline seen in the prior 4 weeks.
Commodities were mixed, again,
The list of winners and losers explains.
Precious metals had a good week with Gold in various prices appearing in the overbought section of this weeks list.
Unloved Coking Coal prices trying to find a floor.
Copper made up for last weeks loses and broke its 5 week losing streak.
Grains continue to suffer and fall.
Soybeans have fallen 7% in the past 3 weeks and tanked 22% over the past 3 months.
Corn prices have performed similarly.
All things steel related are in a trough.
And Lithium Hydroxide has now spent 57 consecutive weeks in weekly oversold territory.
Currencies were quiet for a change.
The Aussie rose again except for the AUD/IDR cross which is in a 6 week losing streak.
The Loonie fell
The DXY is in a 4 week losing streak. The weakness in the USD keeps in oversold territory.
The Euro was mixed while the EUR/GBP broke its 4 week winding streak.
Inversely, the GBP broke its 4 & 5 week losing streak versus the USD and the Yen, respectively.
The larger advancers over the past week comprised of;
China Coking Coal 5.2%, Copper 3.8%, JKM 3.4%, Coffee 6%, Tin 4.5%, Aluminium 2.9%, Orange Juice 8.2%, Palladium 5.3%, Platinum 3.5%, Robusta Coffee 7.8%, Silver in AUD 4.2%, Silver in USD 5.8%, Gold in AUD 1.7%, Gold in CAD 2.8%, Gold in CHF 3.3%, Gold in EUR 2.1%, Gold in USD 3.1%, All Developed World ex USA 4%, AEX 2.5%, ATX 1.9%, KBW Bank Index 3.9%, CAC 2.5%, DAX 3.4%, DJ Industrials 2.9%, DJ Transports 2.2%, Egypt 3.1%, MIB 4%, HSCEI 2.4%, Hang Seng 2%, IBEX 2.9%, Bovespa 2.6%, Indonesia 3.1%, S&P SmallCap 600 2.6%, Russell 2000 3.1%, TAIEX 4.1%, Nasdaq Composite 5.3%, KLSE 1.8%, KRE Regional Banks 3.9%, KOSPI 4.2%, FTSE 250 2.1%, Mexico 2%, Nasdaq Biotechs 1.9%, Nasdaq 100 5.4%, Nikkei 225 8.7%, Oslo 2.1%, Helsinki 2.4%, Stockholm 3%, PSE 3%, SA40 2.7%, SMI 2.7%, SOX 9.8%, Chile 2%, S&P MidCap 400 2.7%, S&P 500 3.9%, STI 2.8%, TA35 2.5%, TSX 3.3%, FTSE 1.8%, Vietnam 2.3%, WIG 6.4%, ASX Financials 4.8%, ASX 200 2.5%, ASX Industrials 3.7% and the ASX SmallCaps rose 3.3%.
The group of largest decliners from the week included;
Cocoa (4.1%), Hot Rolled Coil Steel (3.5%), Lithium Carbonate (2.6%), Lithium Hydroxide (2.7%), Gasoline (3.6%), Sugar (2.4%), Sugar No. 16 (8.1%), Iron China (China) (3.4%), Dutch TTF Gas (1.9%), Urea Middle East (1.8%), Corn (1.7%), Oats (1.6%), Rice (1.8%), Soybeans (4.5%) and Wheat fell 2.3%.
August 17, 2024
by Rob Zdravevski