Investment Theme – the anti ESG theme
May 4, 2021 Leave a comment
My latest newsletter is brief and not climate change friendly.
May 4, 2021
by Rob Zdravevski
rob@karriasset.com.au
Trying to hear what's not being said
May 4, 2021 Leave a comment
My latest newsletter is brief and not climate change friendly.
May 4, 2021
by Rob Zdravevski
rob@karriasset.com.au
May 2, 2021 Leave a comment
In an earlier post covering the Copper/Gold Ratio, I mentioned how the ratio is helpful in taking the ‘temperature’ of the economy but it is most correlated to the U.S. Government 10 Year Bond Yield, as the chart below shows.
In the chart below, the Copper/Gold Ratio is represented by the red line.
A sharp rise in this ratio is often driven by outsized price rises in copper when compared to the gold price, which is the case presently.
It’s difficult to discern who leads who but I can tell you that the Copper/Gold Ratio and the 10 Year Bond Yield are both Overbought on a longer term weekly basis’.
May 2, 2021
by Rob Zdravevski
rob@karriasset.com

May 2, 2021 Leave a comment
The following assets (on a weekly timeframe) registered an Overbought reading or traded more than 2.5 standard deviations above its rolling mean.
Extremes “above” the Mean (at least 2.5 standard deviations)
Coffee
Sugar
Italian Government 10 Year Bond Yields
Overbought (RSI > 70)
Canadian 10 year bond yields (for 11th consecutive weeks)
German, French, Korean Government 10 year bond yields
along with the U.S. 5 and 10 year bond yields
The Copper/Gold Ratio
The Commodities Indices (the CRB and Bloomberg’s)
Iron Ore (for the 3rd consecutive week)
Aluminium (for 10 consecutive weeks)
Copper (for the 20th consecutive weeks)
Lean Hogs (for the 11th consecutive week and its highest price since July 2014)
S&P 500 Index (for the 4th consecutive week)
Dow Jones Industrial Average (for the 4th consecutive week)
S&P Mid Cap 400 (8th consecutive week)
U.S. KBW Banking Index (9th consecutive week)
Nasdaq Transportation Index (8th consecutive week)
Dow Jones Transport Index (8th consecutive week)
Sweden’s OMX 30 Equity Index (9th consecutive week)
France’s CAC-40 Equity Index (for the 3rd consecutive week)
Ethereum
The Overbought Quinella – Both Overbought and Traded at > 2.5 standard deviations above the weekly mean)
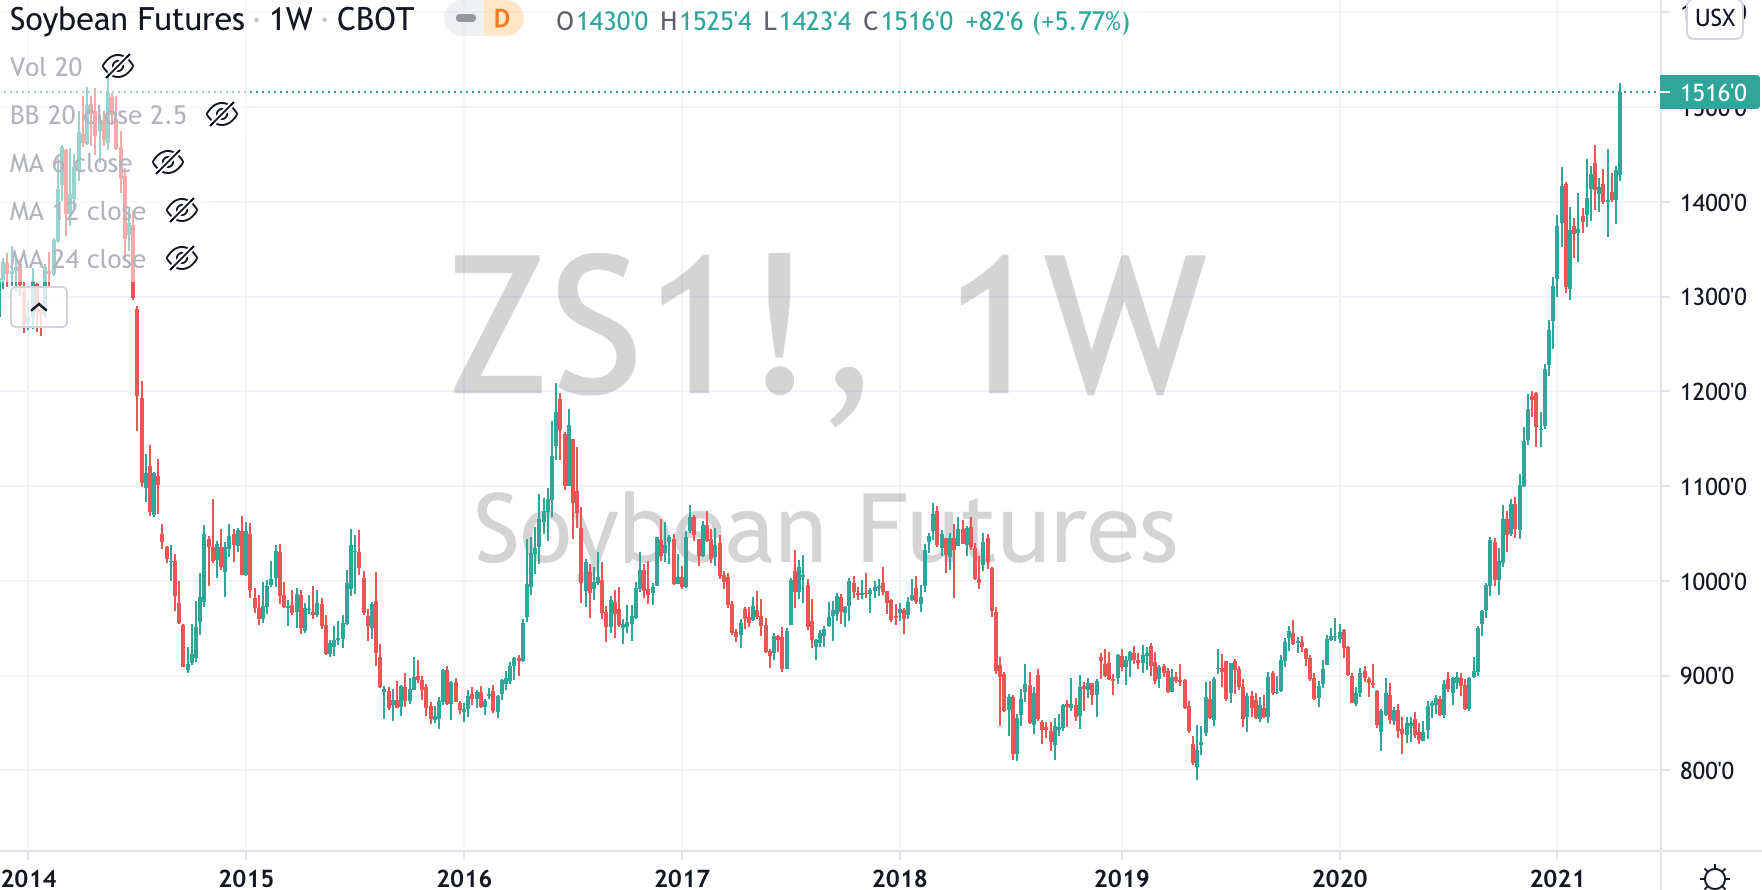
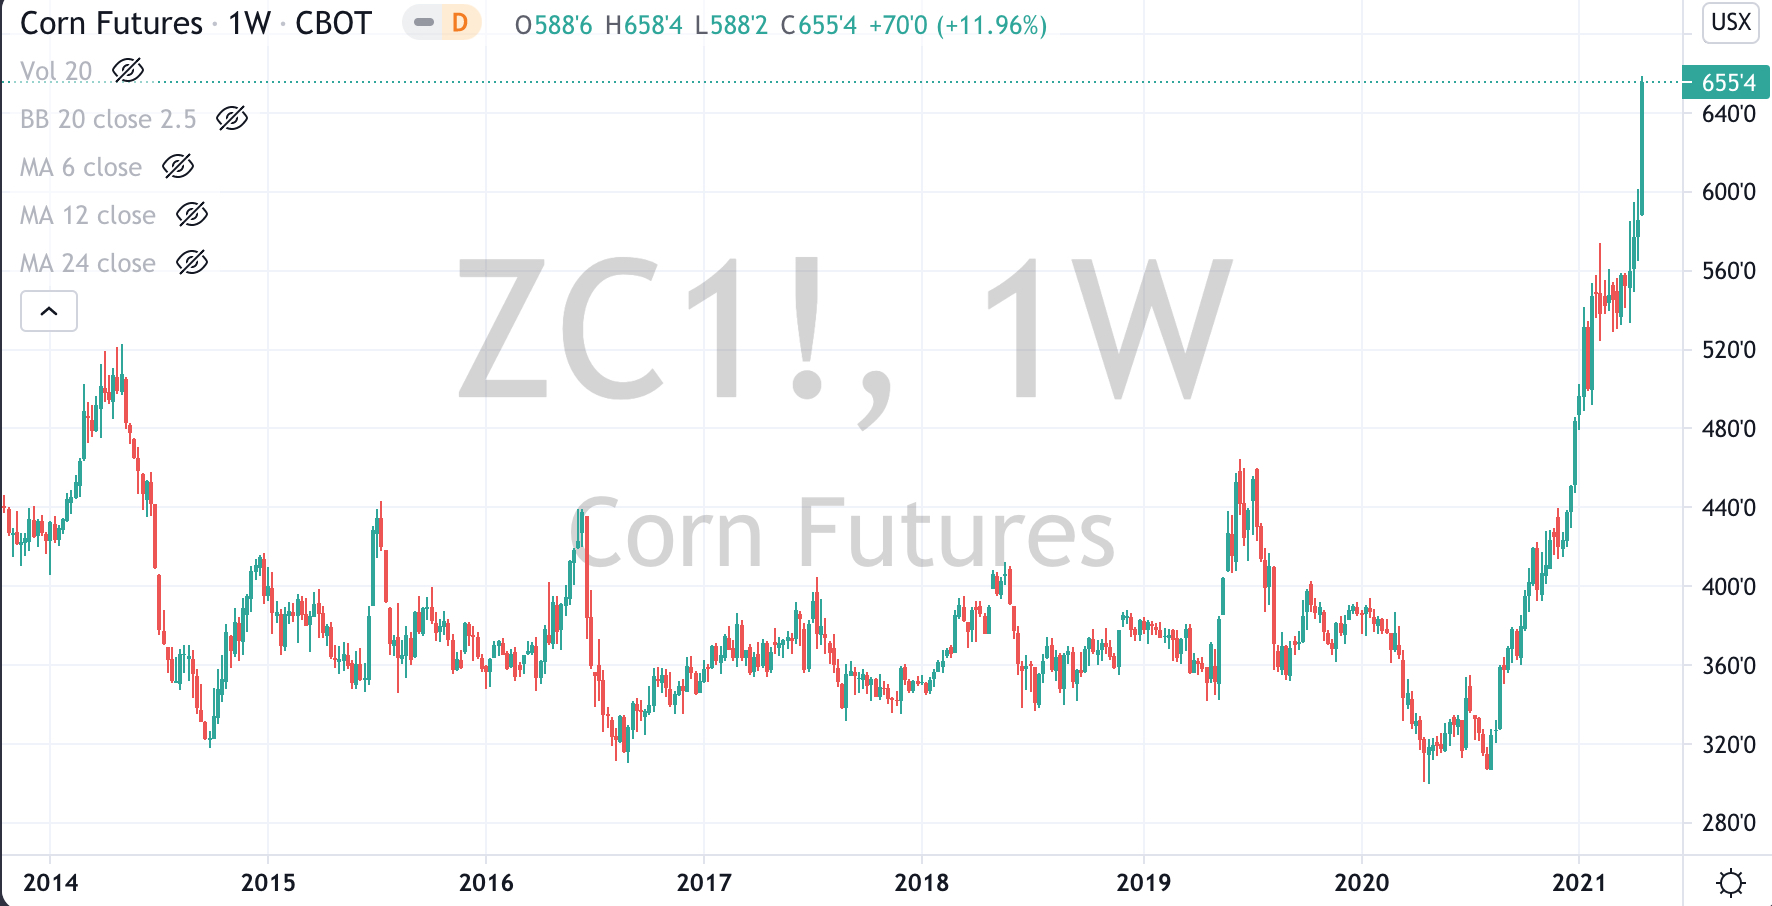
Corn (for the 21st consecutive week & trading 73% above its 200 Week Moving Average)
Soybeans (overbought for 8 consecutive weeks & 73%> its 200 Week Moving Average)
Lumber (having risen 55% in past 6 weeks)
Wheat
Cryptocurrencies Dogecoin, Ripple (XRP) & Monero
Assets (securities) within my immediate universe which touched the other side of the extreme, being Oversold (where the RSI is < 30) or were at least 2.5 standard deviations below its mean are;
Extremes “below” the Mean (at least 2.5 standard deviations)
Nil
Oversold (RSI < 30)
Nil
The Oversold Quinella – Both Oversold and Traded at < 2.5 standard deviations above the weekly mean)
USD/CAD
(meaning sell your strong Canadian Dollars against the weaker U.S. Dollar)
Notes & Ideas:
The ‘softs’ have continued their rise, more so this past week.
Another notable occurrence is the return of Government 10 Year Bond Yields to the Overbought side of the ledger.
On the equities front, the U.S indices continue to linger in overbought territory as does France’s CAC-40, while the ASX 200 has eased lower from its standard deviation stretch.
The only currency registering an extreme is the strong Canadian Dollar vs. the USD, which coincides with strength seen the broader Commodity Indices.
If you are wondering, the AUD/USD was last Overbought in mid-February 2021, when it traded to a high of 0.8007.
and selected cryptocurrencies remain overbought.
May 2, 2021
by Rob Zdravevski
rob@karriasset.com.au
May 2, 2021 Leave a comment
The watching the direction (not necessarily its value) of the Copper/Gold Ratio helps me reading the health of the economy.
And it has been healthy….
It’s particularly correlated with the direction of the U.S. Government 10 Year Bond Yield. More on that in the next post.
The chart below shows us the 6 moments when the Copper/Gold Ratio has registered an Overbought reading over the past 20 years.
Such occurrences correlate to and increase the probability of lower prices in the S&P 500 Index or at the very least see it trade sideways for the coming months. This also coincides with my thesis in my recent newsletter.
https://mailchi.mp/karriasset/quadrupling-yields-increases-equities-risk-2
What this chart tells you is that probability does not suggest ‘going long’ or making any meaningful capital deployment into equities at this juncture.
May 2, 2021
by Rob Zdravevski
rob@karriasset.com.au

April 30, 2021 Leave a comment
Copper is attracting much attention, which is not unusual once an asset price has doubled.
Fundamental bullish cases are being made for rising demand compared to its tighter supply…..
but in the meantime the long-term price action suggests caution if you are thinking of establishing a new ‘long’ position.
This is only the third time Copper has traded at 3 standard deviations above its monthly mean is past 25 years.

#trap #reversion #overbought #copper
April 30, 2021
by Rob Zdravevski
rob@karriasset.com.au
April 30, 2021 Leave a comment
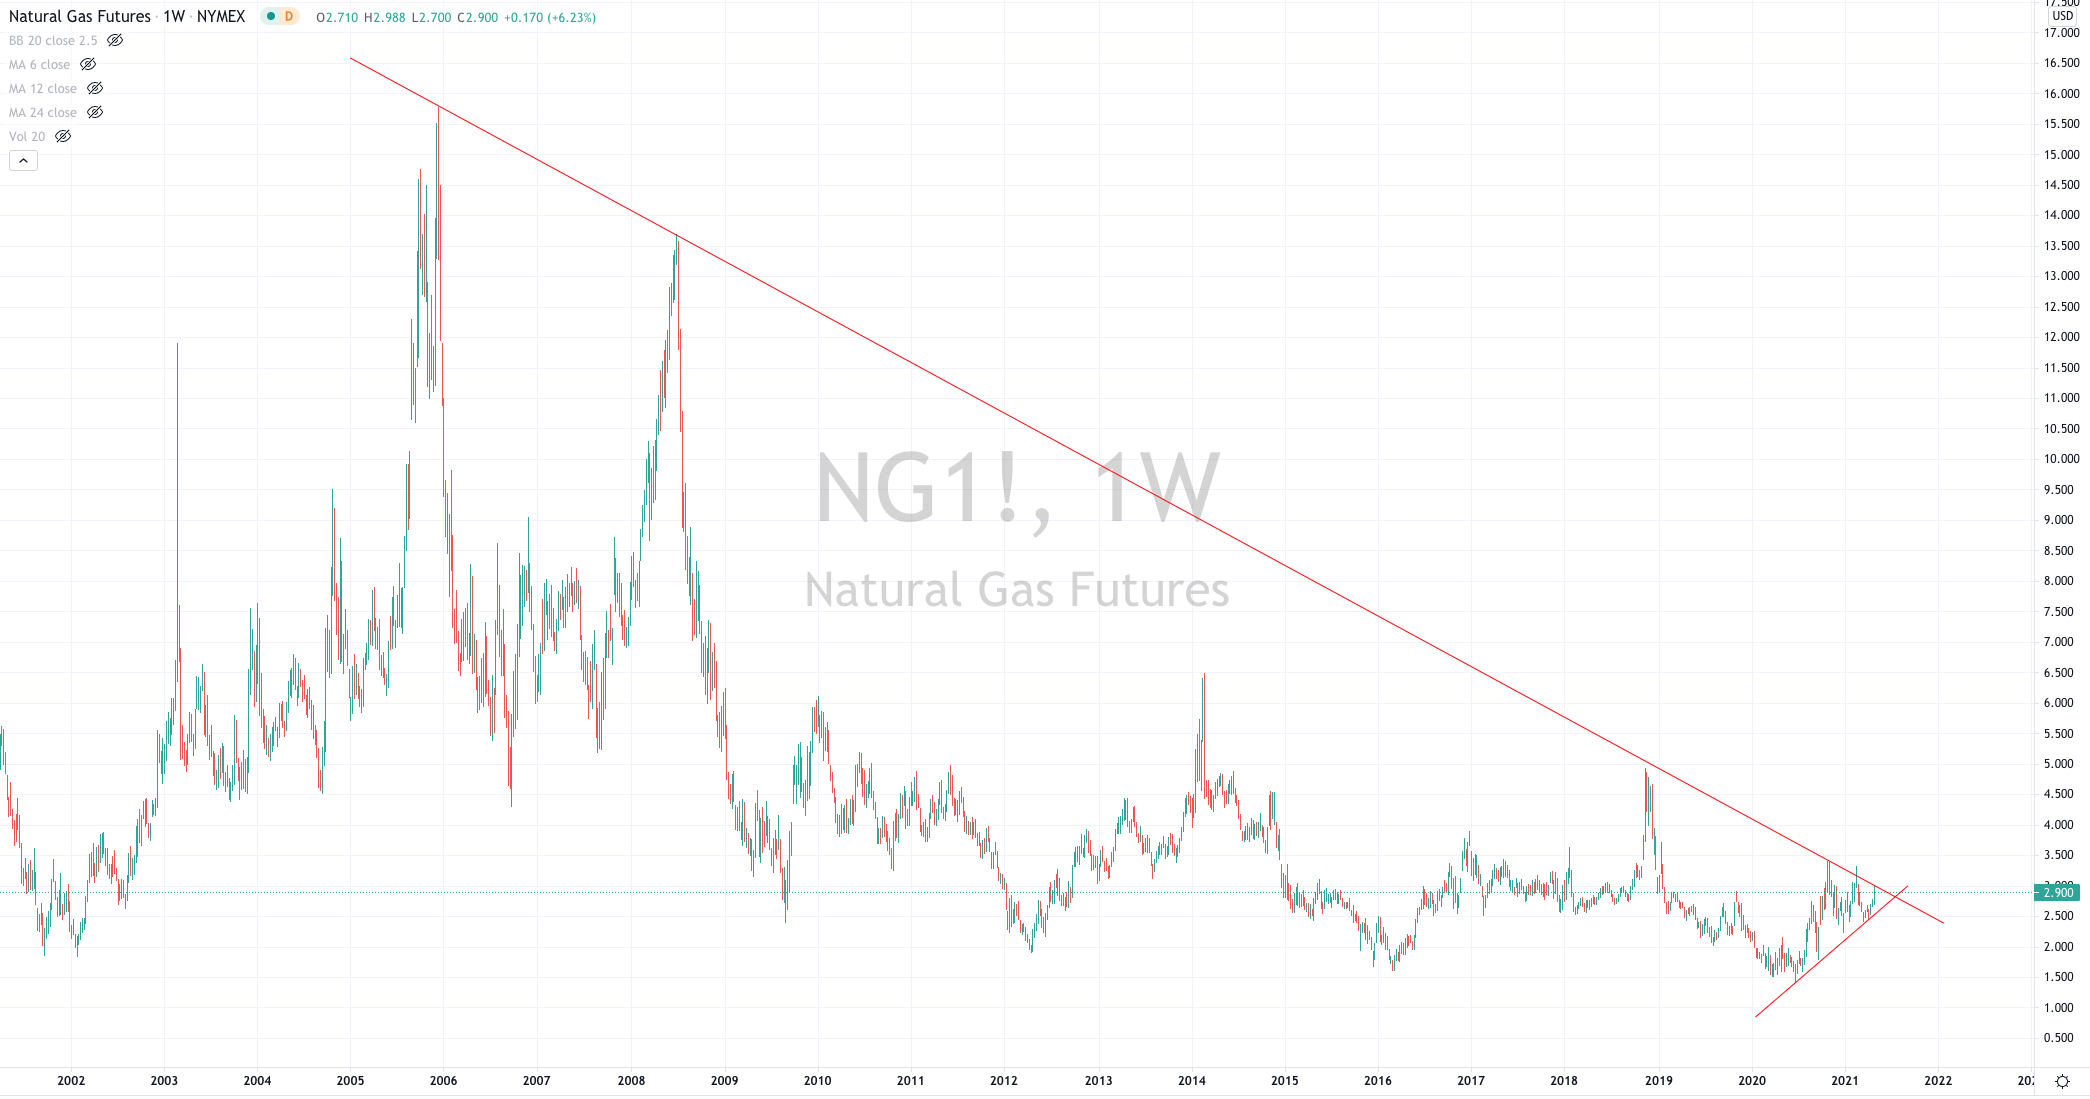
Here is a 20 year chart covering the price of Henry Hub Natural Gas, plotted on a weekly basis.
I’ve been watching this potential Long trade for months and the timing will play out by mid-July 2021, at the latest.
A weekly close above $3.03 could see this commodity move to $4.90 reasonably quickly.
*this is my personal commentary, not advice.
* as always do your own research.
#naturalgas
April 30, 2021
by Rob Zdravevski
rob@karriasset.com.au
April 30, 2021 Leave a comment
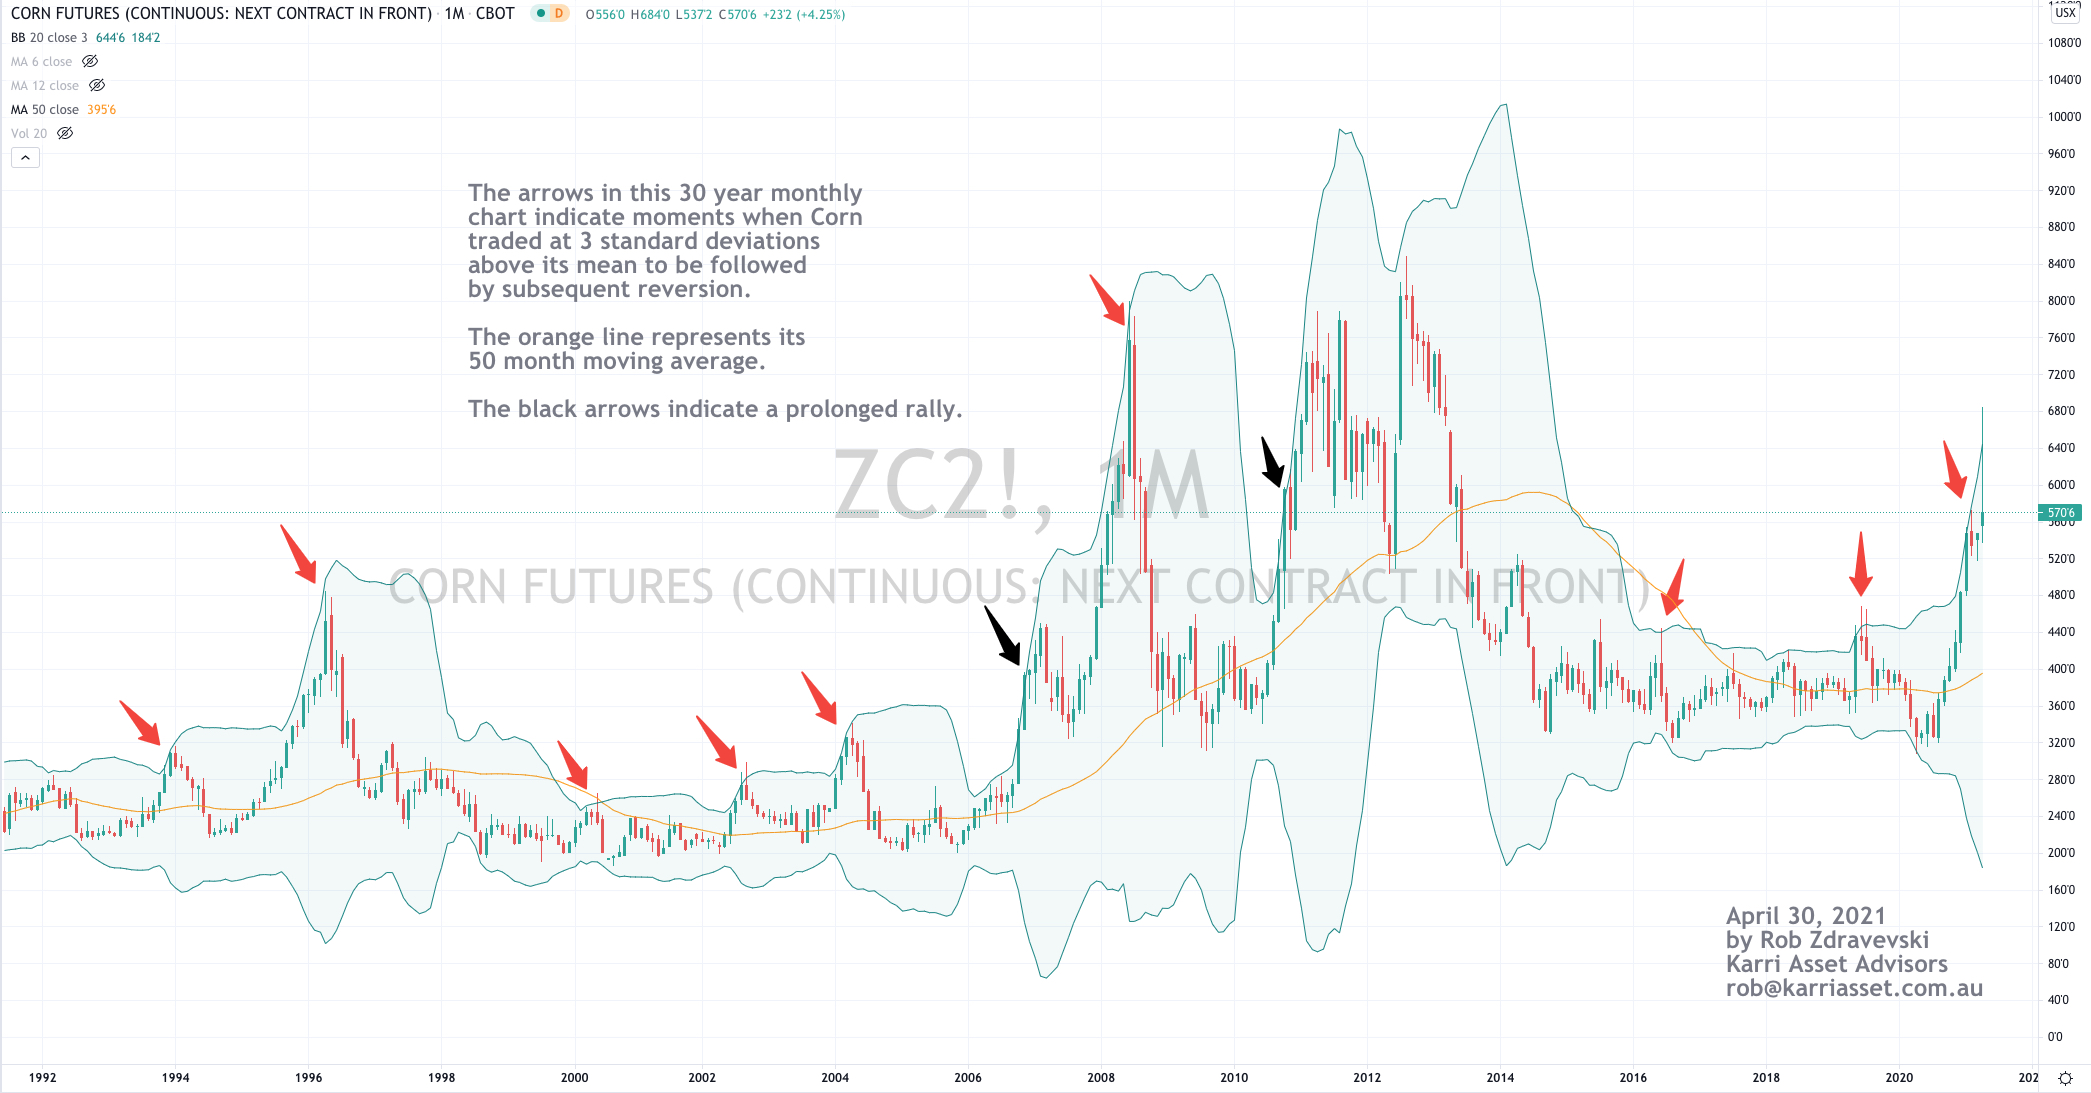
The arrows in the 30 year chart below (plotted on a monthly basis) shows Corn’s various moments when it has traded 3 standard deviations above its mean.
Such extremes are more interesting and mean reversion is more relevant when a commodity is seasonal and replenishes.
April 30, 2021
by Rob Zdravevski
rob@karriasset.com.au
April 28, 2021 Leave a comment
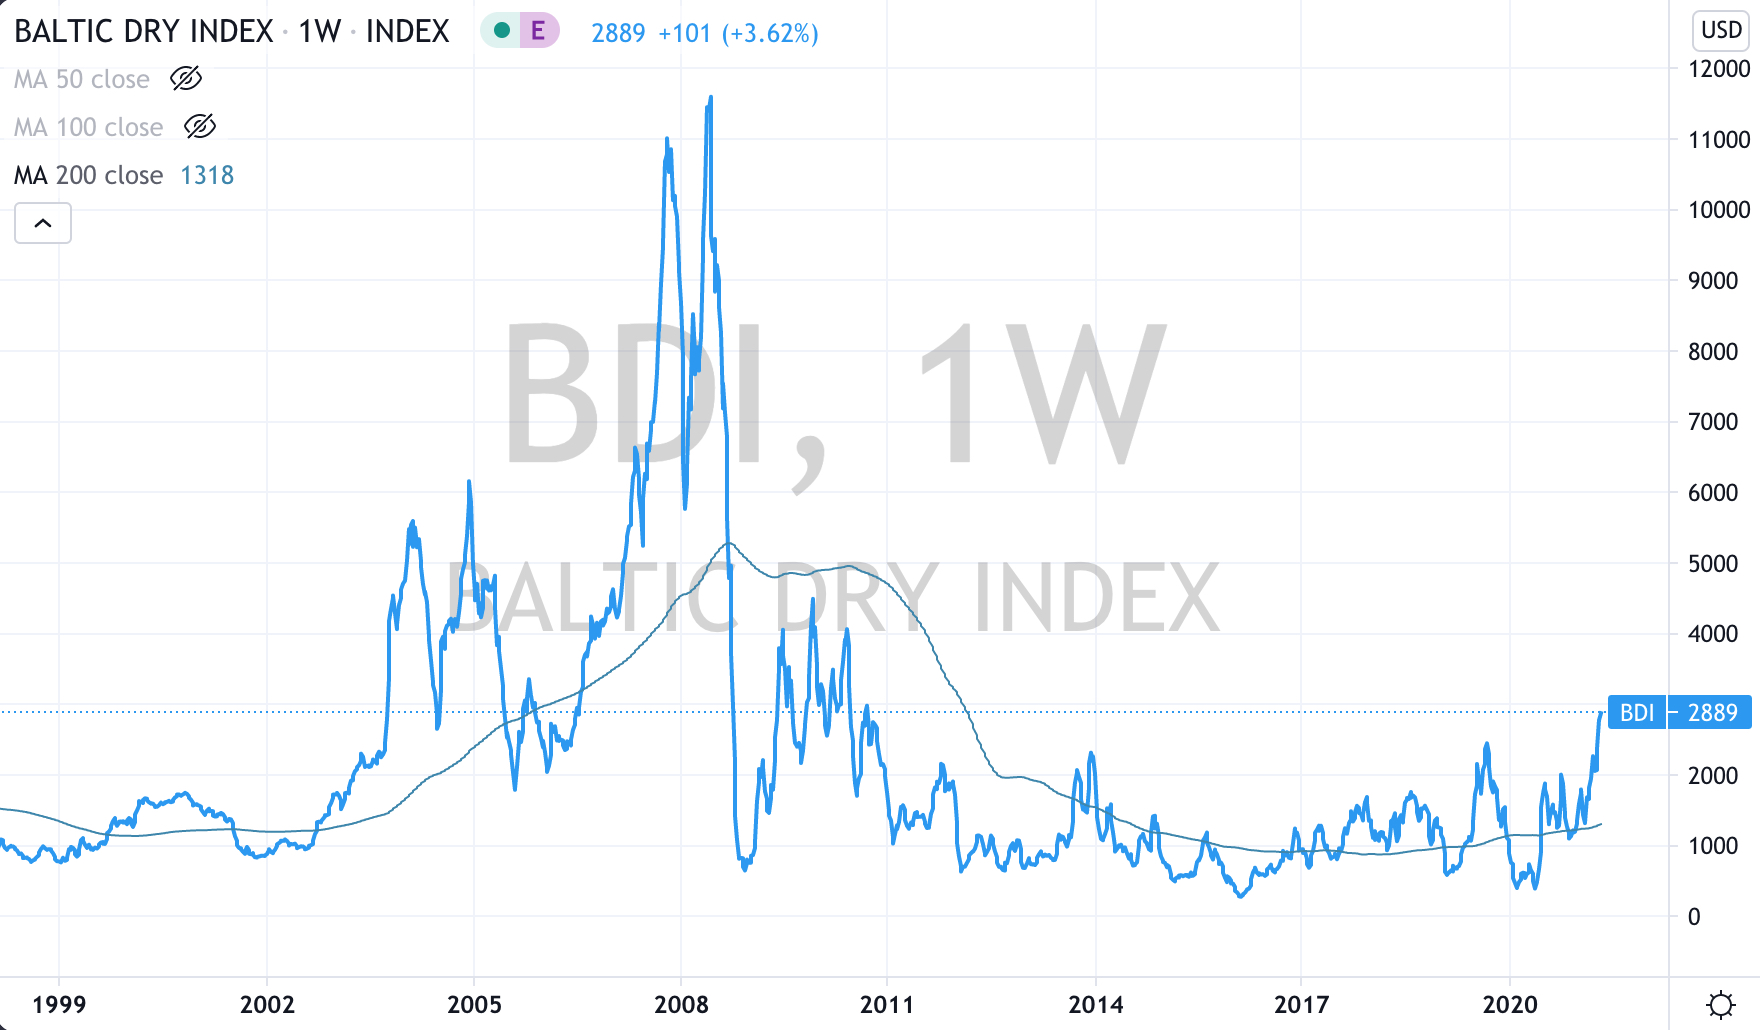
The daily cost of chartering a large ship has risen 6-fold over the past 12 months.
I wanted to highlight the quantum of the rise instead of the absolute price. This increase is surely contributing to the rise in global producer price indexes.
Over the same time, the price of Coal, Iron Ore, Corn, Soybeans & Wheat have also doubled. These commodities account for approx. 65% of the global dry bulk trade. Steel products, sugars and cement account for the other third.
While many will compare where the Baltic Dry Index has been historically, but for now it is Overbought and trading at an ‘extreme’ high on my various measures.
For now, I’ll ponder how the rising shipping costs will work themselves into the goods being currently delivered and if buyers are willing pay for the higher prices being passed on?
April 28, 2021
by Rob Zdravevski
rob@karriasset.com.au
April 28, 2021 Leave a comment
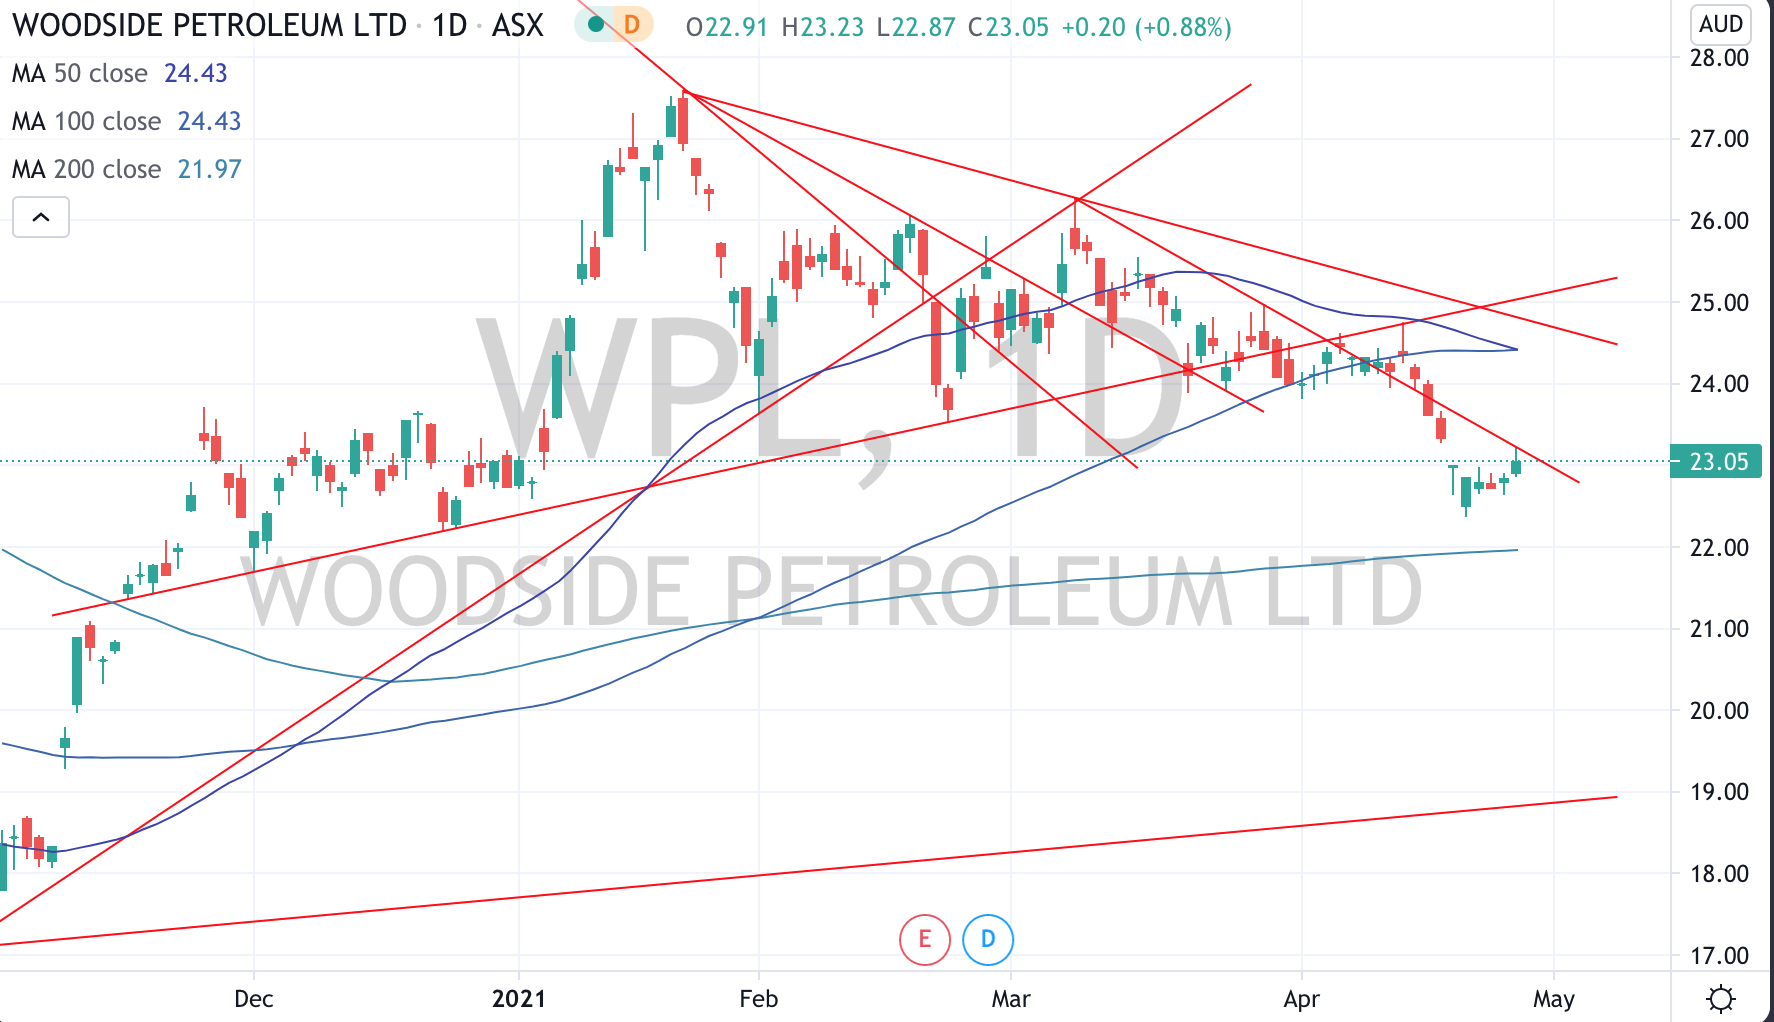
I am seeing similar chart patterns mimicked in many global Oil & Gas equities.
Below is some commentary around Woodside Energy’s (WPL.AX) price action.
WPL’s failure to hold $24 wasn’t good although holding a $22.30 support deemed to be important. Today, the stock is challenging a downward sloping resistance line and needs to break and close above $23.35 in order to increase probability of a visit back to $24 and above. Failing to break $23.35 means the 50 day moving average crosses below its 100 day moving average and likely heralds in a new short term bear trend with a break below $22 suggests a visit to $19.
This all coincides with the acute point where Brent Crude is trading. Brent is edging towards a new bullish move and needs to trade above $67.50 to add to this case however a break below $64.50 negates such a move.
April 28, 2021
by Rob Zdravevski
rob@karriasset.com.au
April 25, 2021 Leave a comment
The following assets (on a weekly timeframe) registered an Overbought reading or traded more than 2.5 standard deviations above its rolling mean.
Extremes “above” the Mean (at least 2.5 standard deviations)
Coffee
Wheat
Ripple (XRP)
ASX 200 Index
Overbought (RSI > 70)
Canadian 10 year bond yields (for 10th consecutive weeks)
The Commodities Indices (the CRB and Bloomberg’s)
Iron Ore (2 consecutive weeks)
Aluminium (for 9th consecutive weeks)
Copper (for 19th consecutive weeks)
Lean Hogs (for the 10th consecutive week and its highest price since September 2014)
Soybeans (for the 7th consecutive week)
S&P 500 Index (for the 3rd consecutive week)
Dow Jones Industrial Average (for the 3rd consecutive week)
S&P Mid Cap 400 (7th consecutive week)
U.S. KBW Banking Index (8th consecutive week)
Nasdaq Transportation Index (7th consecutive week)
Dow Jones Transport Index (7th consecutive week)
Sweden’s OMX 30 Index (7th consecutive week)
South Korea’s KOSPI Index
Ethereum
The Quinella – Both Overbought and Traded at > 2.5 standard deviations above the weekly mean)
Corn (for the 20th consecutive week & trading 70% above its 200 Week Moving Average)
Lumber (having risen 31% in past 3 weeks)
Cryptocurrency Dogecoin
Assets (securities) within my immediate universe which touched the other side of the extreme, being Oversold (where the RSI is < 30) or were at least 2.5 standard deviations below its mean are;
Extremes “below” the Mean (at least 2.5 standard deviations)
Nil
Oversold (RSI < 30)
Nil
Notes & Ideas:
The list of ‘Over Bought’ extremes is shrinking as many of those extremes have eased off their highs and some are on their way to reverting back to their mean.
The most obvious trend amongst the rising price brigade are commodities from the ‘softs’ agricultural complex such Corn, Soybeans, Wheat, Coffee. Many advancing more than 5% for the week and exhibiting parabolic moves.
Once again, no currencies are Overbought this week. All those listed as ‘extremely’ overbought in the past few weeks have corrected and have since traded 2-3% lower.
Equally, extreme ‘high’s in global government bond have seen yields decline.
Overbought cryptocurrencies have eased lower from last week’s highs as have European equity indices……..
while the Dow Jones Industrials, the S&P 500 and the Mid-Cap 400 continue to register Overbought readings.
April 25, 2021
by Rob Zdravevski
rob@karriasset.com.au