Understanding credit will set you free
February 9, 2021 Leave a comment
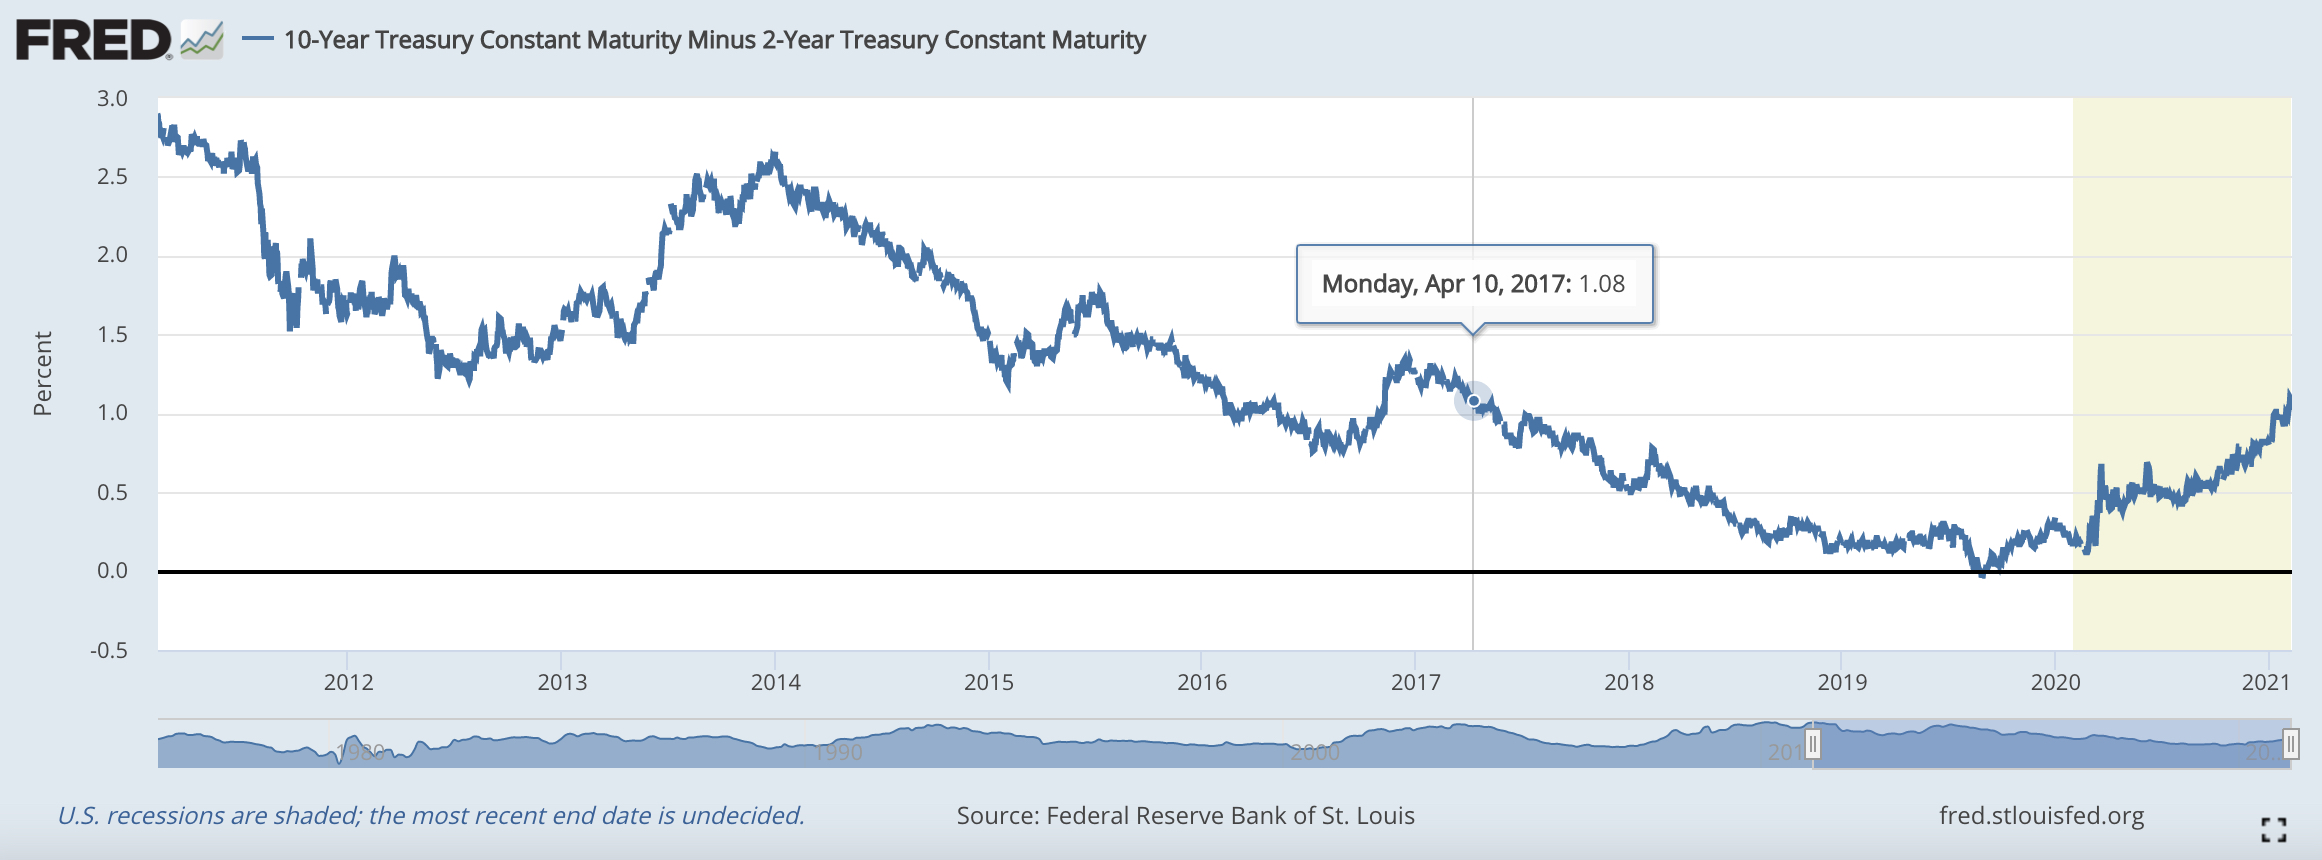
The first graph illustrates the spread between yields of the U.S. Government 2 year bond and 10 year bond.
Today, the yield spread between the 2-10 year bonds is at its highest (1.08%) since April 2017…..but doesn’t mean much other than a financial news headline.
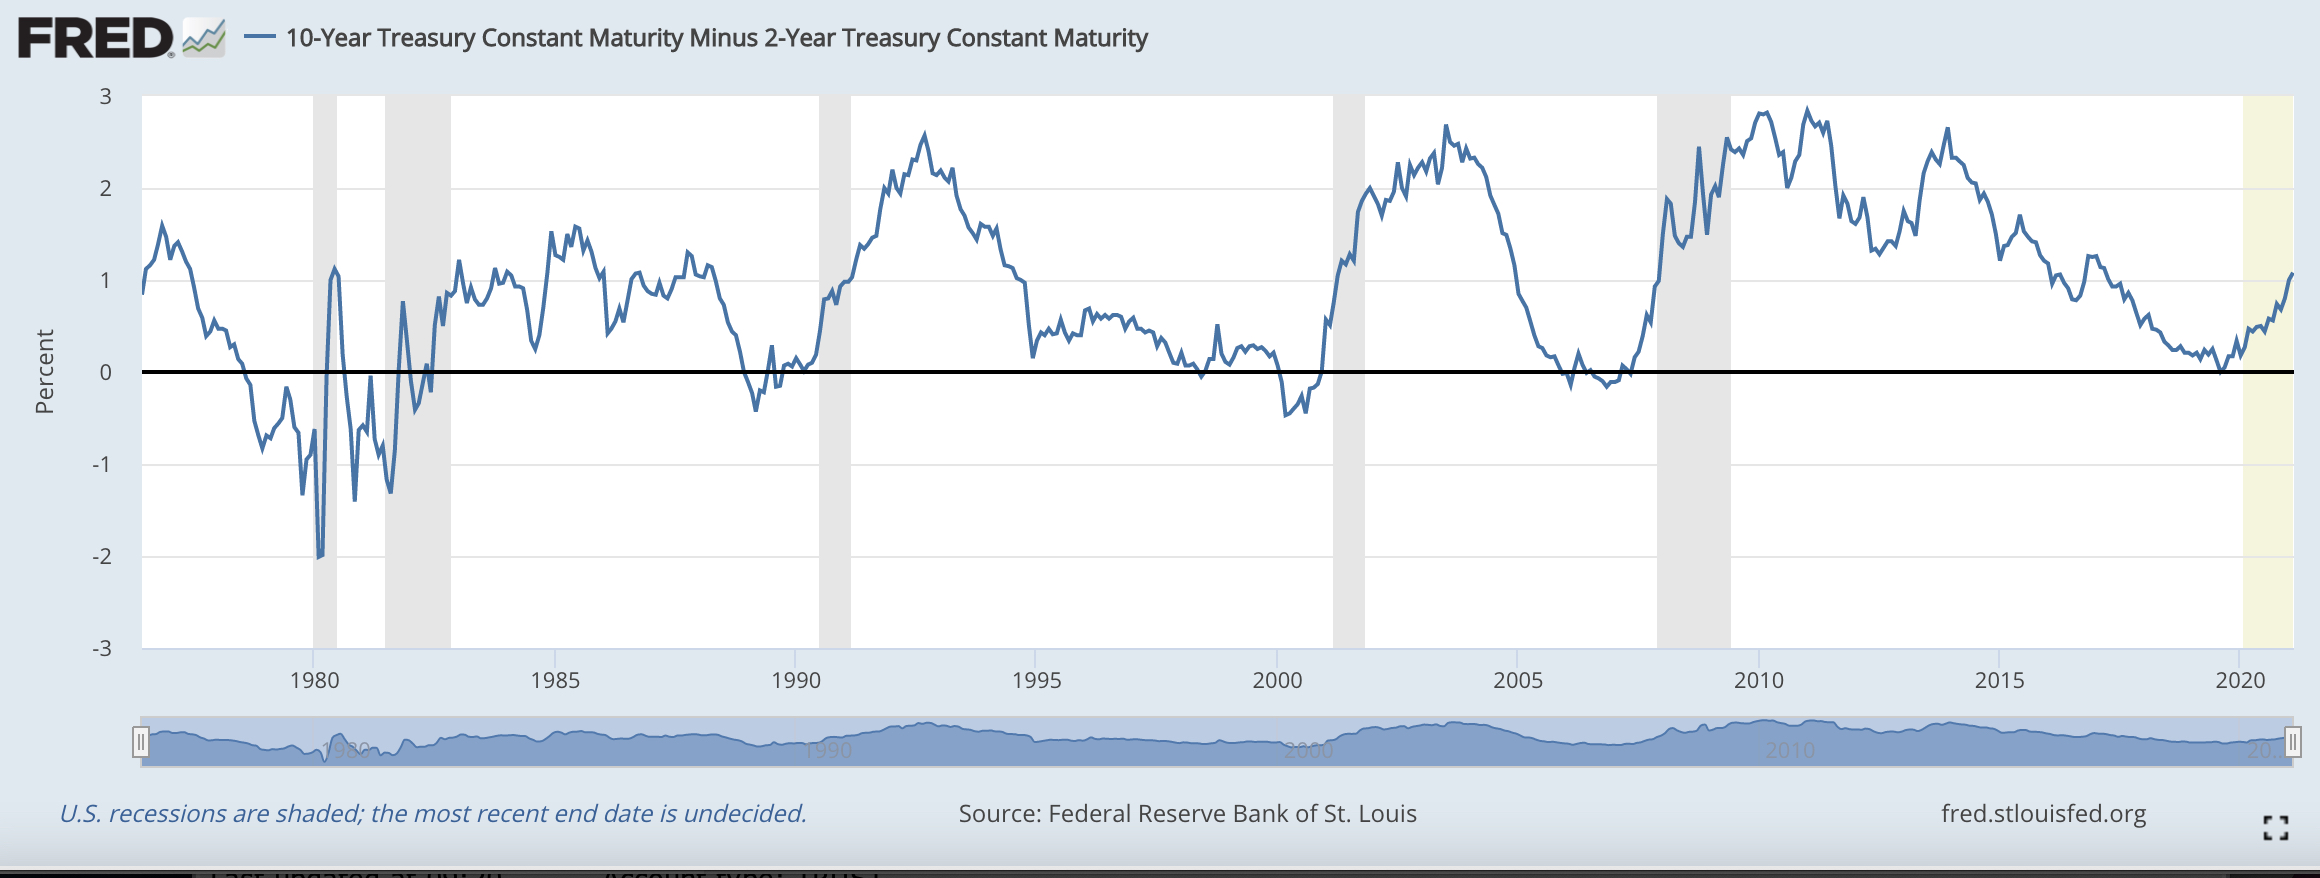
The second graph shows the history of the same spread over 45 years.
I say……until the 10 year bond is yielding more than 2% above that of the 2 year bond…….then there is no recession in sight and the ‘dance” in equity markets continues.
Equity corrections may be sharp but brief.
February 9, 2021
by Rob Zdravevski
rob@karriasset.com.au