I think that the criteria placed and expected by the ESG ‘movement’ will accelerate the current rise in inflation.
In fact, I believe that ‘ESG’ requirements pose a risk towards economies experiencing a period of stagflation.
The supply chain disruptions coupled with a return to normal demand (if not slightly higher due to increased savings pools) and rising food prices are part of the normal inflationary effects.
But when you combine ESG pressures and expectations along with legislation, we are beginning to see a decrease in industrial capacity.
Collectively, this will occur through a combination of facilities closing, a dearth in capital expenditure and difficulty gaining new approvals for replacement construction.
Stagflation occurs when we see inflation coupled with stagnating or falling GDP and usually declining productivity.
It’s a most fascinating topic occupying my time how I position investment portfolios.
At a recent investment forum, the topic of the prospect of a U.S. Dollar losing its reserve currency status was raised.
Consensus pointed at the Chinese Yuan (Renminbi) taking over that mantle over varying range of timeframes.
But when I asked the gathering would they buy the Chinese currency once it becomes the world’s reserve currency, the majority of answers featured the response ’No’ and “I don’t trust the Chinese’.
But I thought,
we have been happy purchase products manufactured in China, for low competitive prices.
In fact, we probably aren’t aware how many Chinese made items we actually consume or utilise, ironically mostly commissioned/ordered by Western corporations.
And we are equally happy for ’the Chinese’ to buy the goods or assets which ’the West’ wants to sell to them.
After all, China flirts with Japan as being the largest owner of U.S. Government Bonds.
So, I pondered the hypocrisy of ‘westerners’.
The thing is…..we will need to, at some point ’trust the Chinese’
Interestingly, JP Morgan Chase CEO, Mr Jamie Dimon (in the recent Senate Banking Committee Hearings) said that Chinese banks will be the prominent competition for the American banking industry in the next 30 years.
The following assets (on a weekly timeframe) registered an Overbought reading or traded more than 2.5 standard deviations above its rolling mean.
Extremes “above” the Mean (at least 2.5 standard deviations)
Chinese Government 10 Year Bond Yields
Overbought (RSI > 70)
French & Korean Government 10 year bond yields (4th consecutive week)
The Commodities Indices (the CRB and Bloomberg’s)
Aluminium (following a 12 week streak and rest last week, it returns to the list, )
Tin (for the 5th week)
Copper (returning after last week’s break from a 22 week overbought streak)
Gasoil
Heating Oil
Lean Hogs (for the 14th consecutive week and its highest price since July 2014)
U.S. KBW Banking Index (13th consecutive week)
Dow Jones Transport Index (12th consecutive week)
France’s CAC-40 Equity Index (for the 7th consecutive week) and
Spain’s IBEX (3rd week)
the Helsinki 25 and Stockholm 30 equity indices
The Overbought Quinella – Both Overbought and Traded at > 2.5 standard deviations above the weekly mean)
Canadian Dollar / USD (4th consecutive week of the quinella, where the CAD is exhibiting strength against the U.S. Dollar)
Assets (securities) within my immediate universe which touched the other side of the extreme, being Oversold (where the RSI is < 30) or were at least 2.5 standard deviations below its mean are;
Extremes “below” the Mean (at least 2.5 standard deviations)
Nil
Oversold (RSI < 30)
AUD / GBP (signifying a strong British Pound)
USD / CNY (a weak USD is translating into a strong Chinese Renminbi)
The Oversold Quinella – Both Oversold and Traded at < 2.5 standard deviations above the weekly mean)
Nil
Notes & Ideas:
The most notable observation is that many assets which were Overbought over the past few weeks have either mean reverted or are on their way to doing so.
Something to watch are a host of global equity indices are nearing extreme Overbought readings.
The British Pound is strong against many currencies and within a whisker of being Overbought across a range of them.
A deletion from the list is Iron Ore, which was in its 7th week in overbought territory. It’s price fell 8% for the week to close at $189. Incidentally, it fell 15% during the week the it touched a low of $176. This is all considerably lower from its $225 high, only a few weeks ago,
The U.S. 10 year bond yield it yet to break above 1.75%. Yields eased further this past week to close at 1.58%.
Last week, I wrote that the the Russell 2000 seems to be in the early stage of a new downtrend. This is yet to be confirmed as it rose 2.5% in the past week. Interestingly, the index has been trading sideways since early February and odds are increasing of a break either way.
Gold as priced in USD and AUD (not in CAD) traded to 2 standard deviations (SD’s) above its weekly mean, although it’s not an ‘extreme’ as per this notes criteria of 2.5 SD’s.
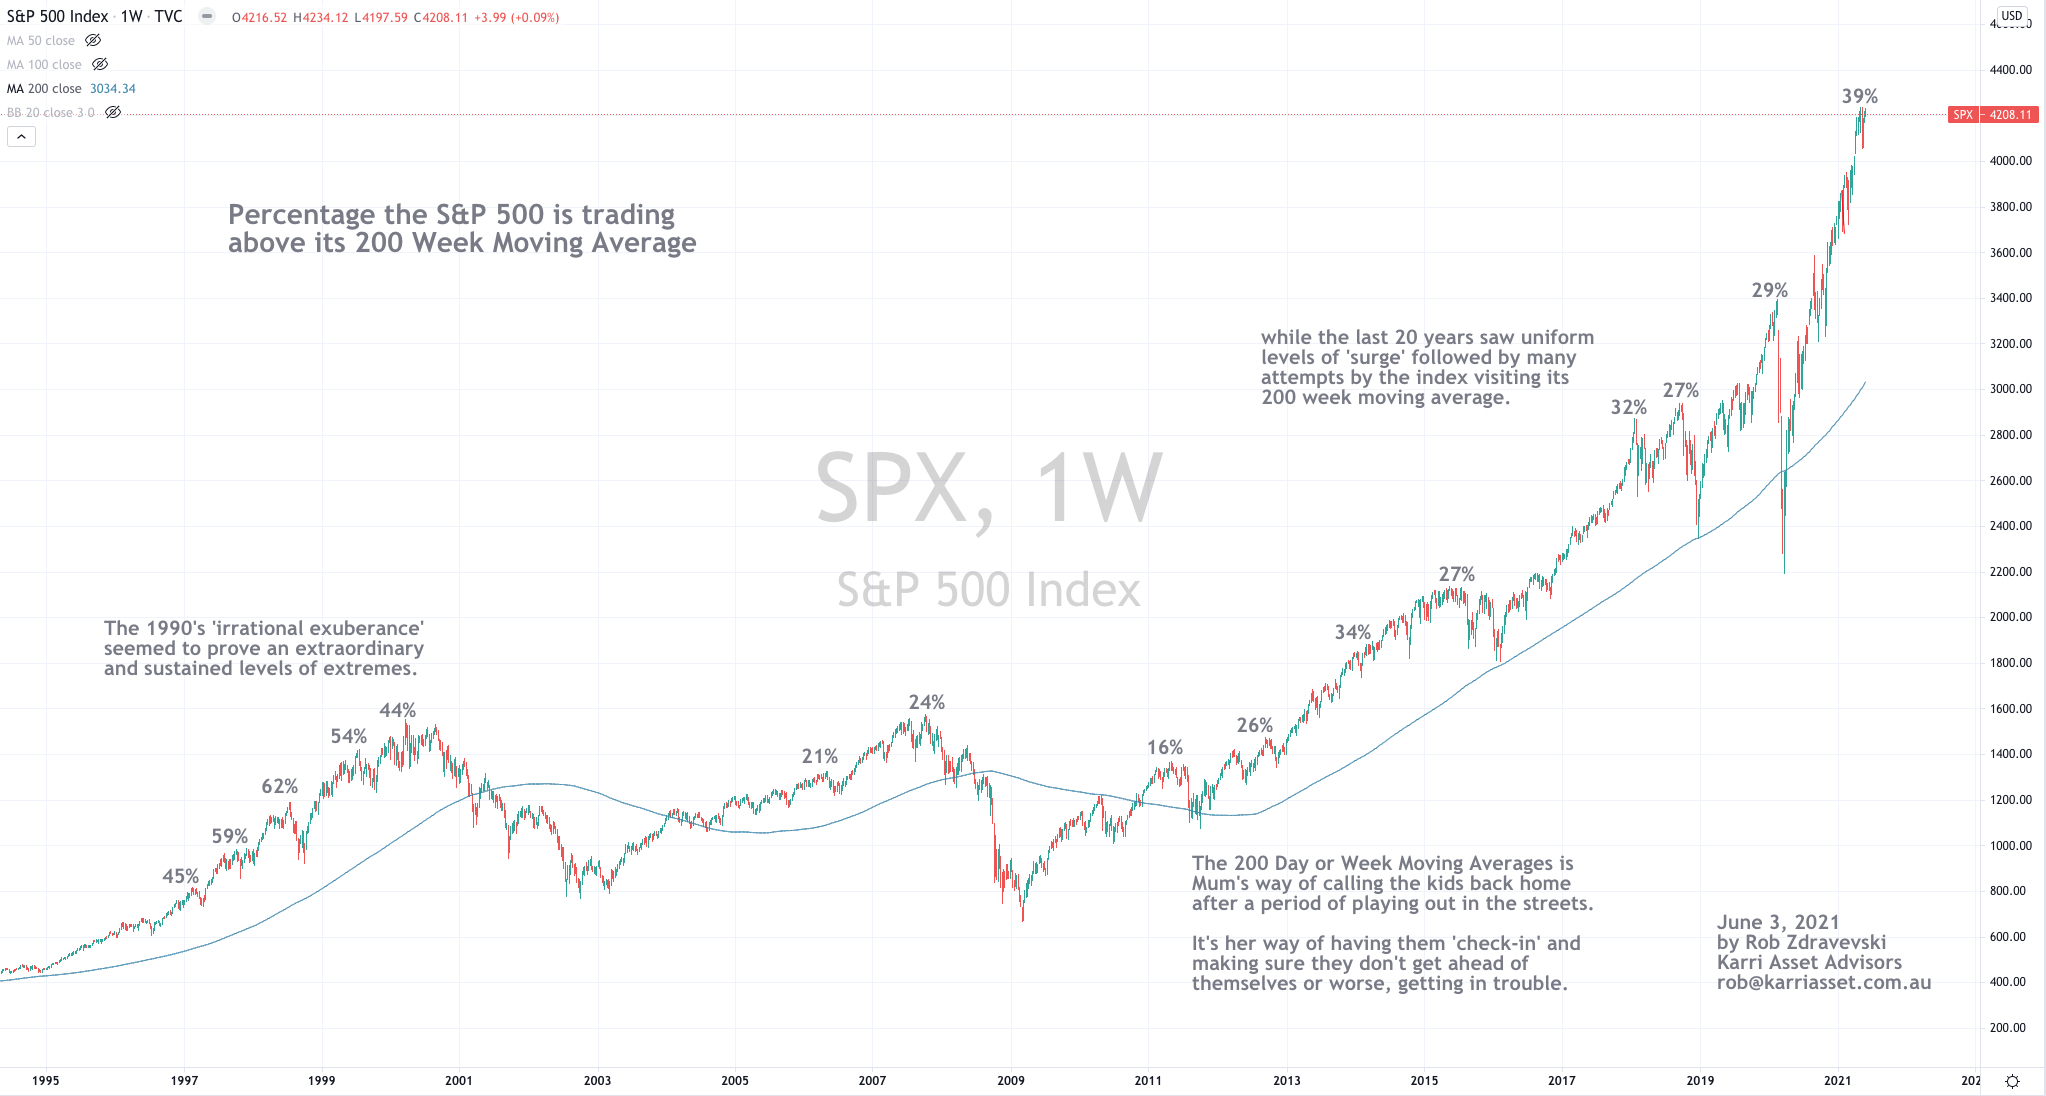
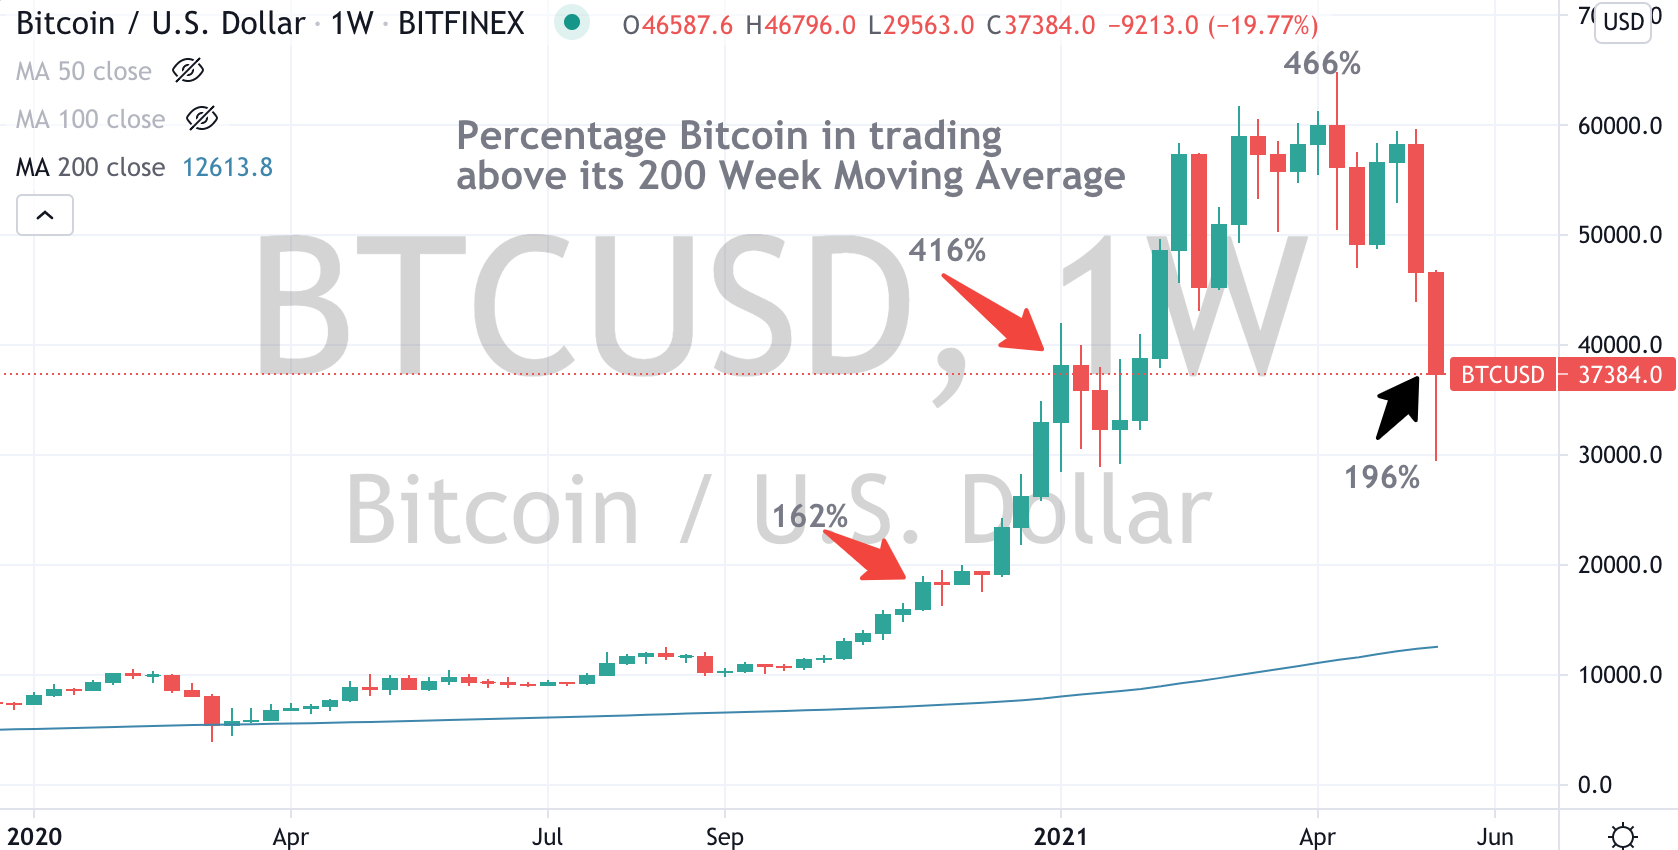
And lastly, Bitcoin is 175% above its 200 Week Moving Average, which is down from last week’s 196% reading and certainly lower when compared to its 466% peak in mid-April 2021
The following assets (on a weekly timeframe) registered an Overbought reading or traded more than 2.5 standard deviations above its rolling mean.
Extremes “above” the Mean (at least 2.5 standard deviations)
Italian Government 10 Year Bond Yields (4th consecutive week)
Zinc (although it closed 5% below its intra-week high)
GBP/USD (indicating a strong British Pound against the U.S. Dollar)
Overbought (RSI > 70)
French & Korean Government 10 year bond yields (3rd consecutive week)
German and Canadian 10 year bond yields (for the 2nd consecutive week)
The Commodities Indices (the CRB and Bloomberg’s)
Tin (for the 4th week)
Iron Ore (in its 7th overbought week)
Lean Hogs (for the 13th consecutive week and its highest price since July 2014)
U.S. KBW Banking Index (12th consecutive week)
Dow Jones Transport Index (11th consecutive week)
France’s CAC-40 Equity Index (for the 6th consecutive week) and
Spain’s IBEX (2nd week in)
The Overbought Quinella – Both Overbought and Traded at > 2.5 standard deviations above the weekly mean)
Canadian Dollar / USD (4th consecutive week of the quinella, where the CAD is exhibiting strength against the U.S. Dollar)
Assets (securities) within my immediate universe which touched the other side of the extreme, being Oversold (where the RSI is < 30) or were at least 2.5 standard deviations below its mean are;
Extremes “below” the Mean (at least 2.5 standard deviations)
Nil
Oversold (RSI < 30)
Nil
The Oversold Quinella – Both Oversold and Traded at < 2.5 standard deviations above the weekly mean)
Nil
Notes & Ideas:
The most notable price action over the past week saw more aggressive purchasing of government bonds (resulting in yields easing lower) and a decline in many commodity prices (such as Lumber, Sugar, Coffee and Corn) as they continue their reversion from their recent Overbought Extremes and in some cases, parabolic moves.
Specific moves include;
a 4.5% decline in Platinum and Wheat (adding to the latter’s 7% fall in the previous week),
while Brent Crude, Aluminium, Copper, Soybeans, Heating Oil and Gasoline all retreated 3.5% for the week,
It was a week where Copper & Aluminium ended 6 and 12 week respective overbought streaks while Gasoline is now 7% below its previous week’s high as bullish trades chasing high on news of the Colonial Pipeline cyber security attack proved to be a trap.
and the Nasdaq Transportation Index declined (after 9th consecutive weeks) while the Dow Jones Transports continues its Overbought streak.
While many western government bonds were being sold (resulting in rising yields), the Chinese Government 10 year bond yields are nearing an Oversold extreme, meaning the world’s 2nd largest bond market is attracting a bid. After all, only 3% of its is foreign-owned.
The major bond market yield I am watching continues to be U.S. 10 year yield and whether it breaks above 1.75%. It closed the week at 1.62%.
The Russell 2000 seems to be in the early stage of a new downtrend. Today’s price of 2,215 is 6% below its March 15, 2021 high of 2,360 and I continue to watch a similar setup for the MidCap 400.
We aren’t seeing the Dow Jones Industrials (DJI) and S&P 500 in the overbought realm, more so because the DJI’s prior week’s bearish outside reversal week is important to watch.
And lastly, it wouldn’t be a Macro Extreme post if I didn’t mention Ethereum’s 36% collapse during the week and Bitcoin’s 20% decline adding to the previous week’s 20% fall.
Bitcoin is now only trading 196% above its 200 week moving average compared to its 466% peak in mid-April 2021
Surely, the U.S. Dollar should’ve collapsed by now.
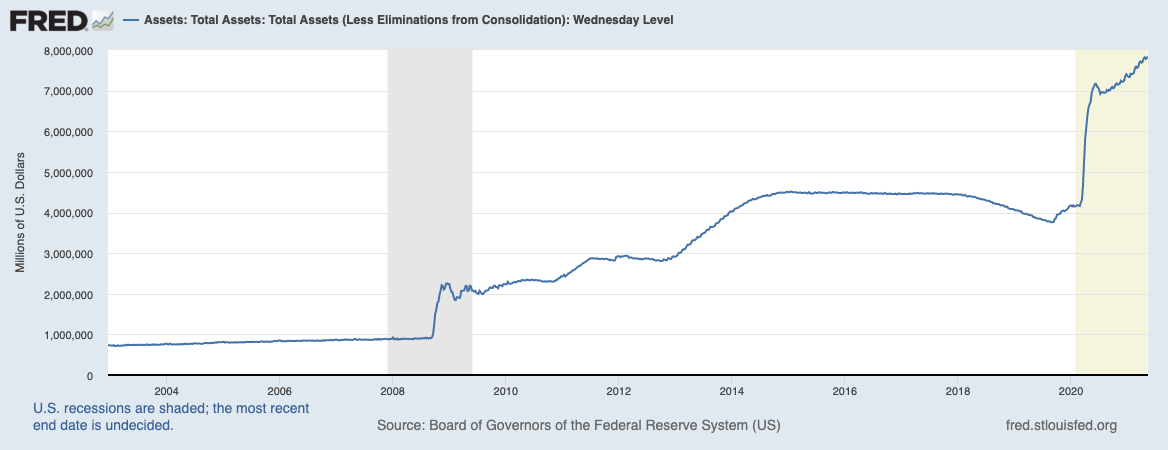
As a follow up to immediately prior post about U.S. M2 Money Supply increasing…..
I think market pundits need to find a better reason when making the case for a weaker U.S. Dollar than just spinning out the same old tune of ‘money printing’.
Well, it’s not money printing exactly, but that’s another argument.
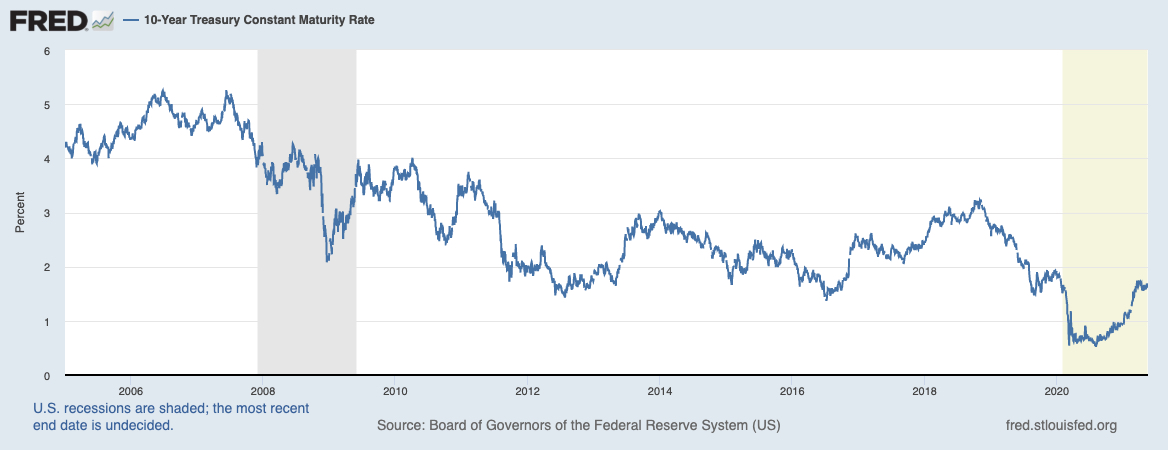
The U.S. Federal Reserve has tripled its balance sheet since 2009 and the U.S. Dollar Index (DXY) is the same price as then….
and the 10 Year government bond yield has fallen from 4% to 1.6%…
Feel free to keep parroting on about money printing.