The following assets (on a weekly timeframe) registered an Overbought reading or traded more than 2.5 standard deviations above its rolling mean.
Extremes “above” the Mean (at least 2.5 standard deviations)
Australian 2 and 10 bond yeilds
Canadian 10 year bond yields
U.S. 10’s
Nickel
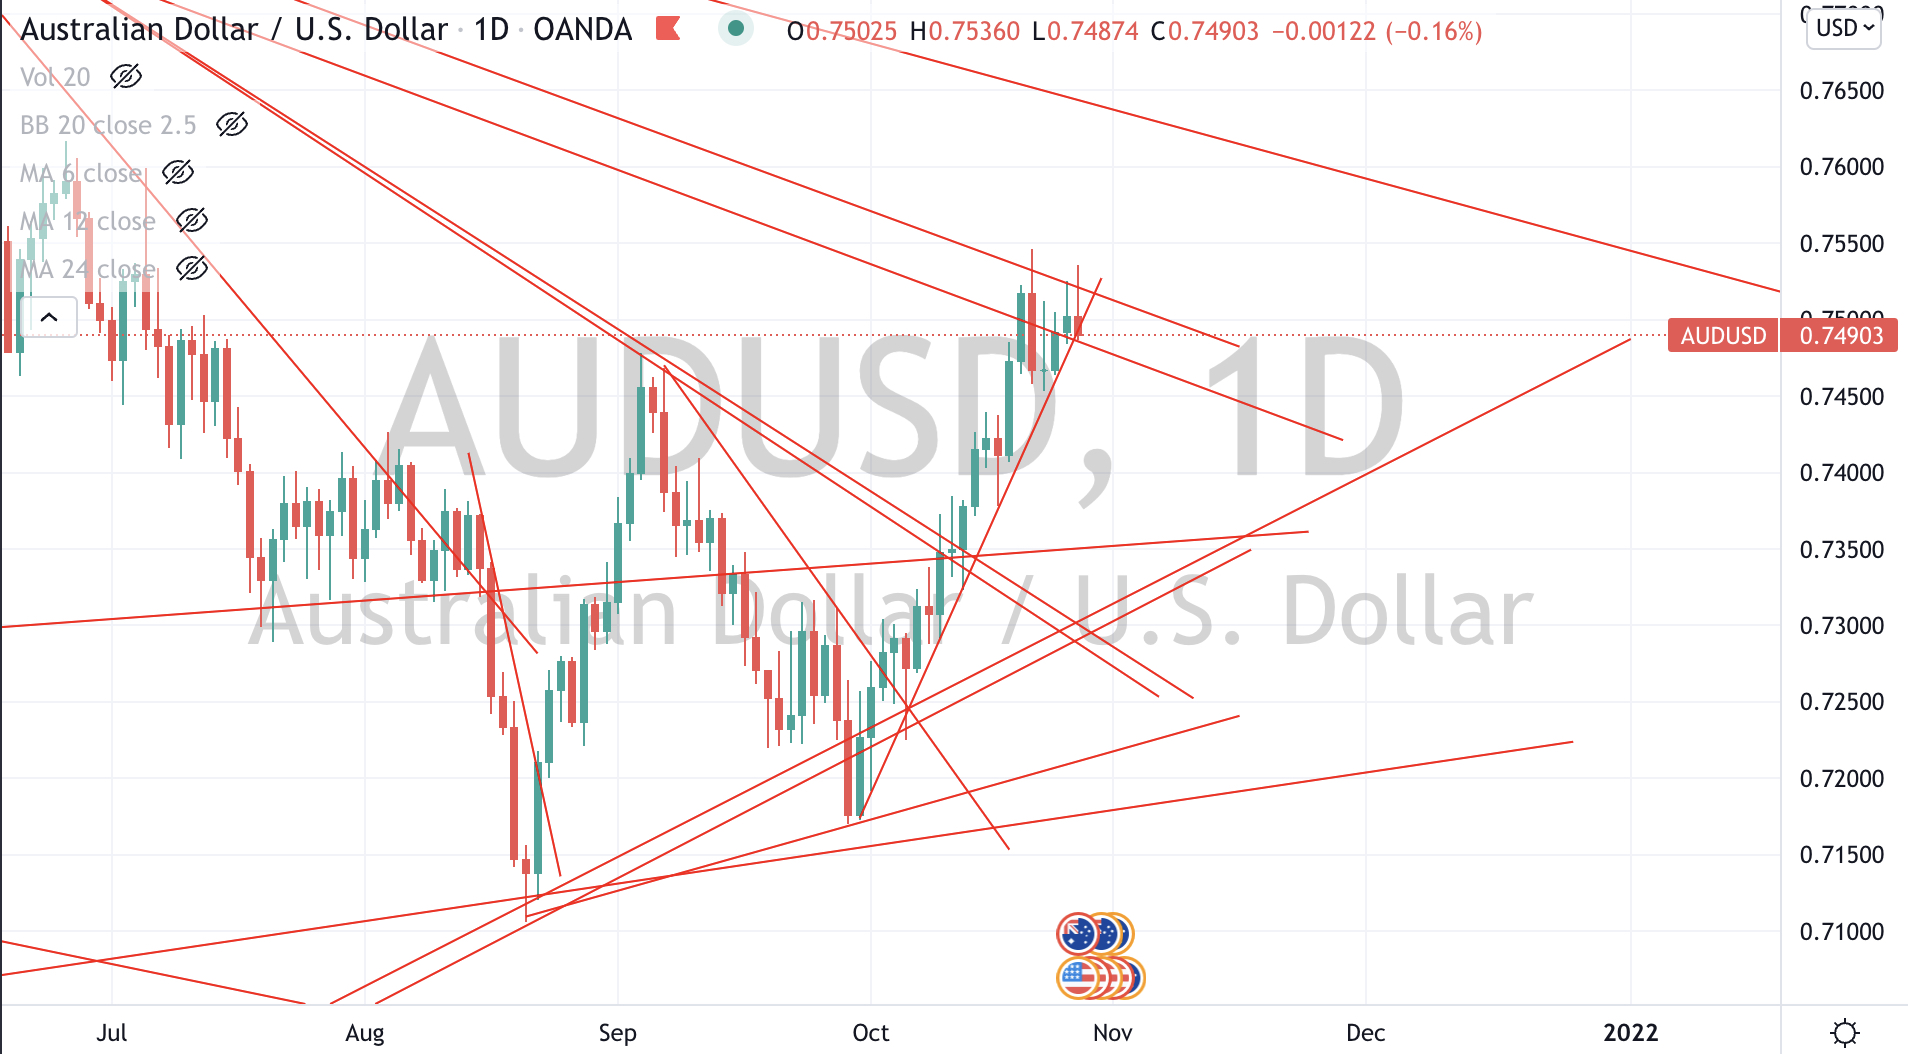
AUD/JPY
NZD/USD (the Kiwi is powering higher)
KBW U.S. Banking Index
DJ Transports Index
And Bitcoin
Overbought (RSI > 70)
U.K. 10 year government bond yields (Gilts)
South Korean 10’s
Bloomberg and CRB commodity indices
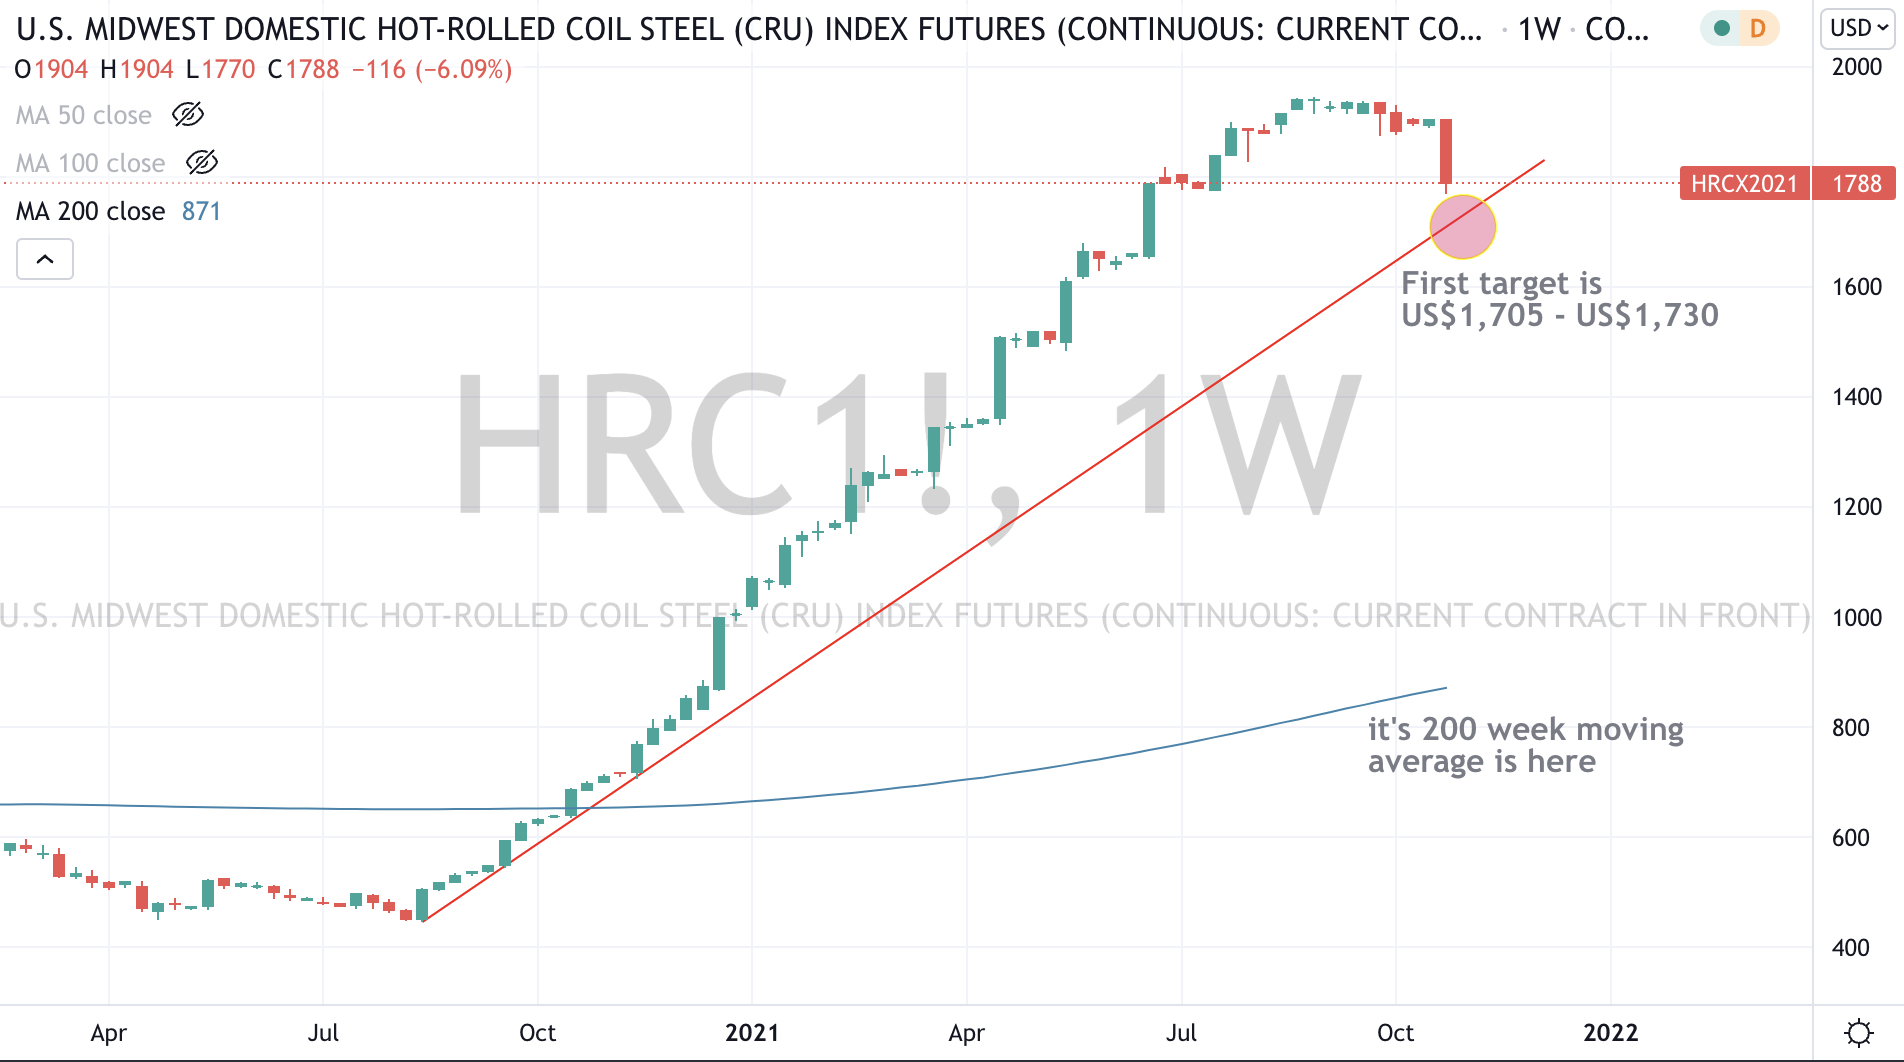
Hot Rolled Coil Steel (for the 56th consecutive week)
the JKM “Japan/Korea (LNG) Marker”
Natural Gas
Gasoline
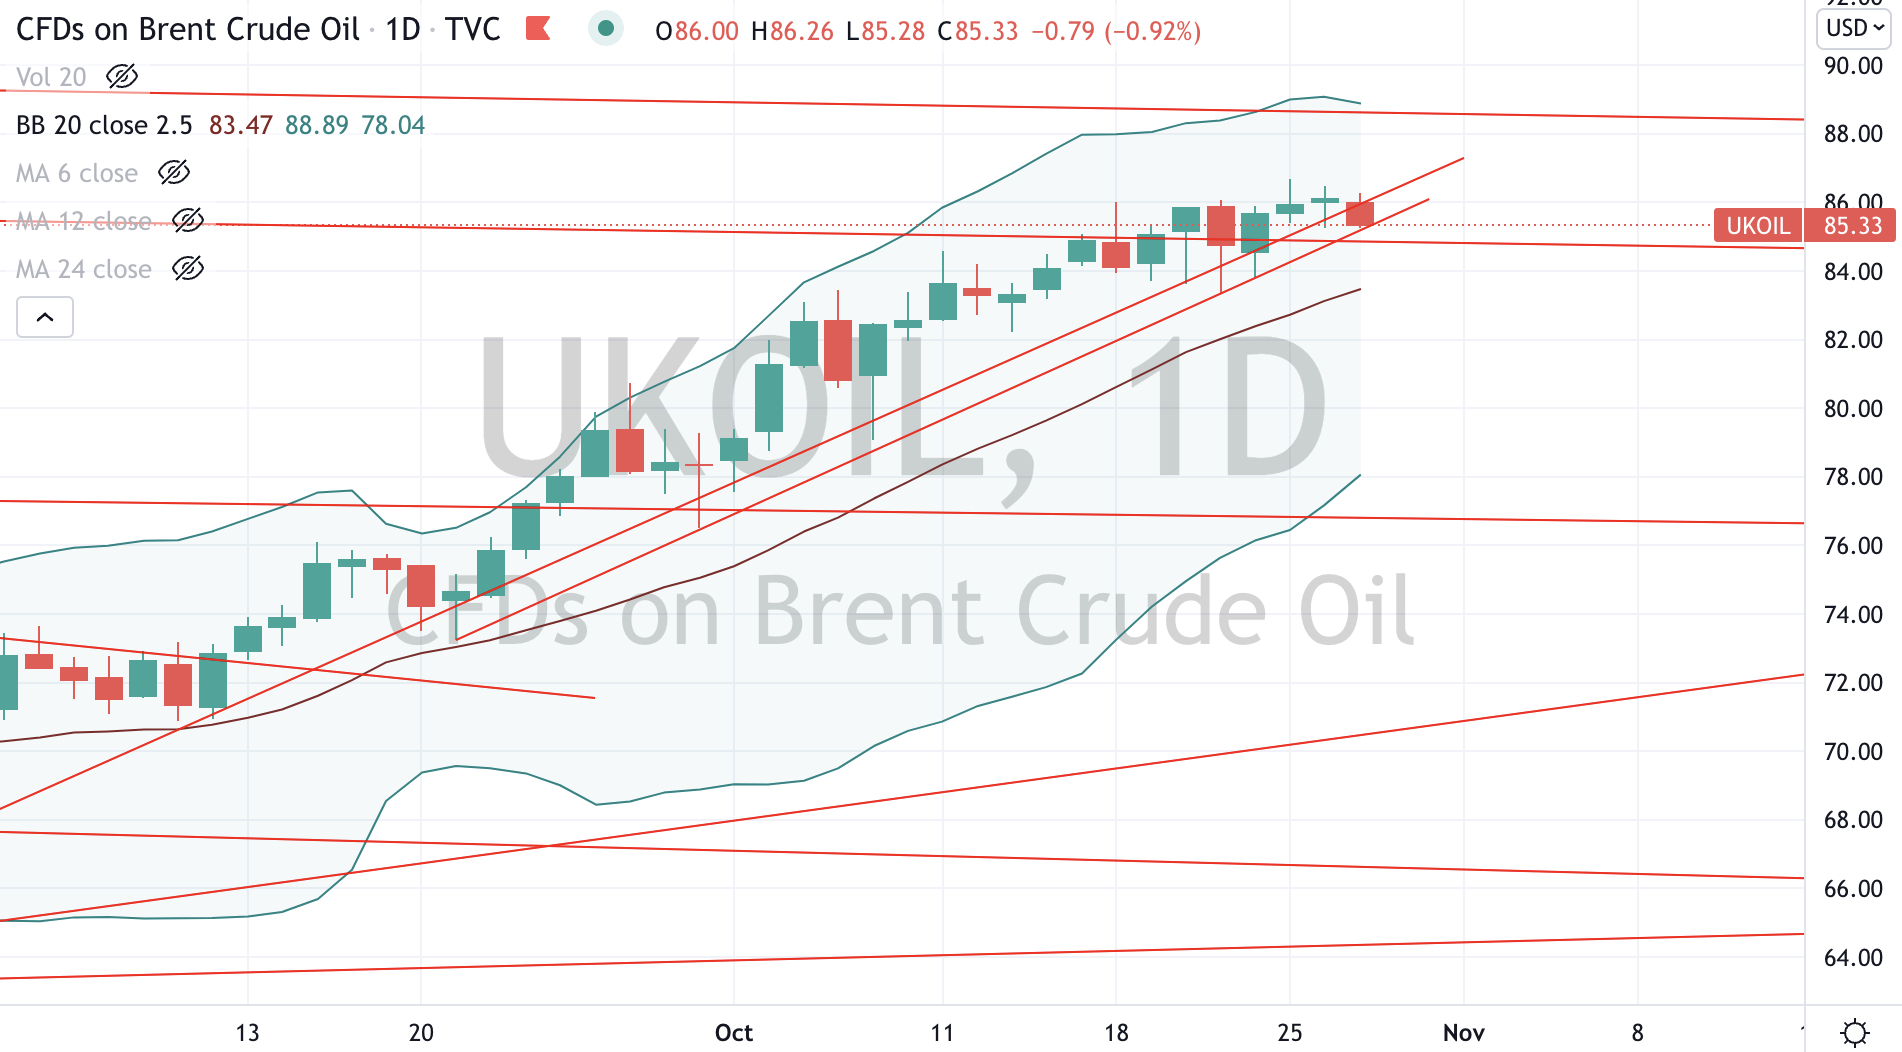
Brent & WTI Crude Oil
Australian coal
Coal, Rotterdam delivery
Dutch TTG Natural Gas
Russia’s MOEX equity index
Amsterdam’s AEX equity index
and India’s Sensex & NIFTY 50 equity indices
The Overbought Quinella – Both Overbought and Traded at > 2.5 standard deviations above the weekly mean)
Australian 5 year government bond yields
German 5 year bond yields
U.S. 2 year and 5 year govn’t bond yields
New Zealand 10 year bond yields
Turkish 10’s
Gasoil
Heating Oil
Oslo OBX 25 equity index
USD/JPY (suggesting a strong USD and weak Yen)
It’s the weakest since early 2019, so sell USD and Buy JPY and use it to buy cheap Japanese equities.
USD/TRY (obviously we expect a weak Turkish Lira)
Assets (securities) which touched the other side of the extreme, being Oversold (where the RSI is < 30) or were at least 2.5 standard deviations below its mean are;
Extremes “below” the Mean (at least 2.5 standard deviations)
Brazil’s BOVESPA equity index
USD/CNH – suggesting a strong Chinese Yuan
EUR/AUD – telling us the Euro is weaker and we have a strong Australian Dollar, so sell your AUD and Buy EUR (there are some bargains amongst European equities)
Oversold (RSI < 30)
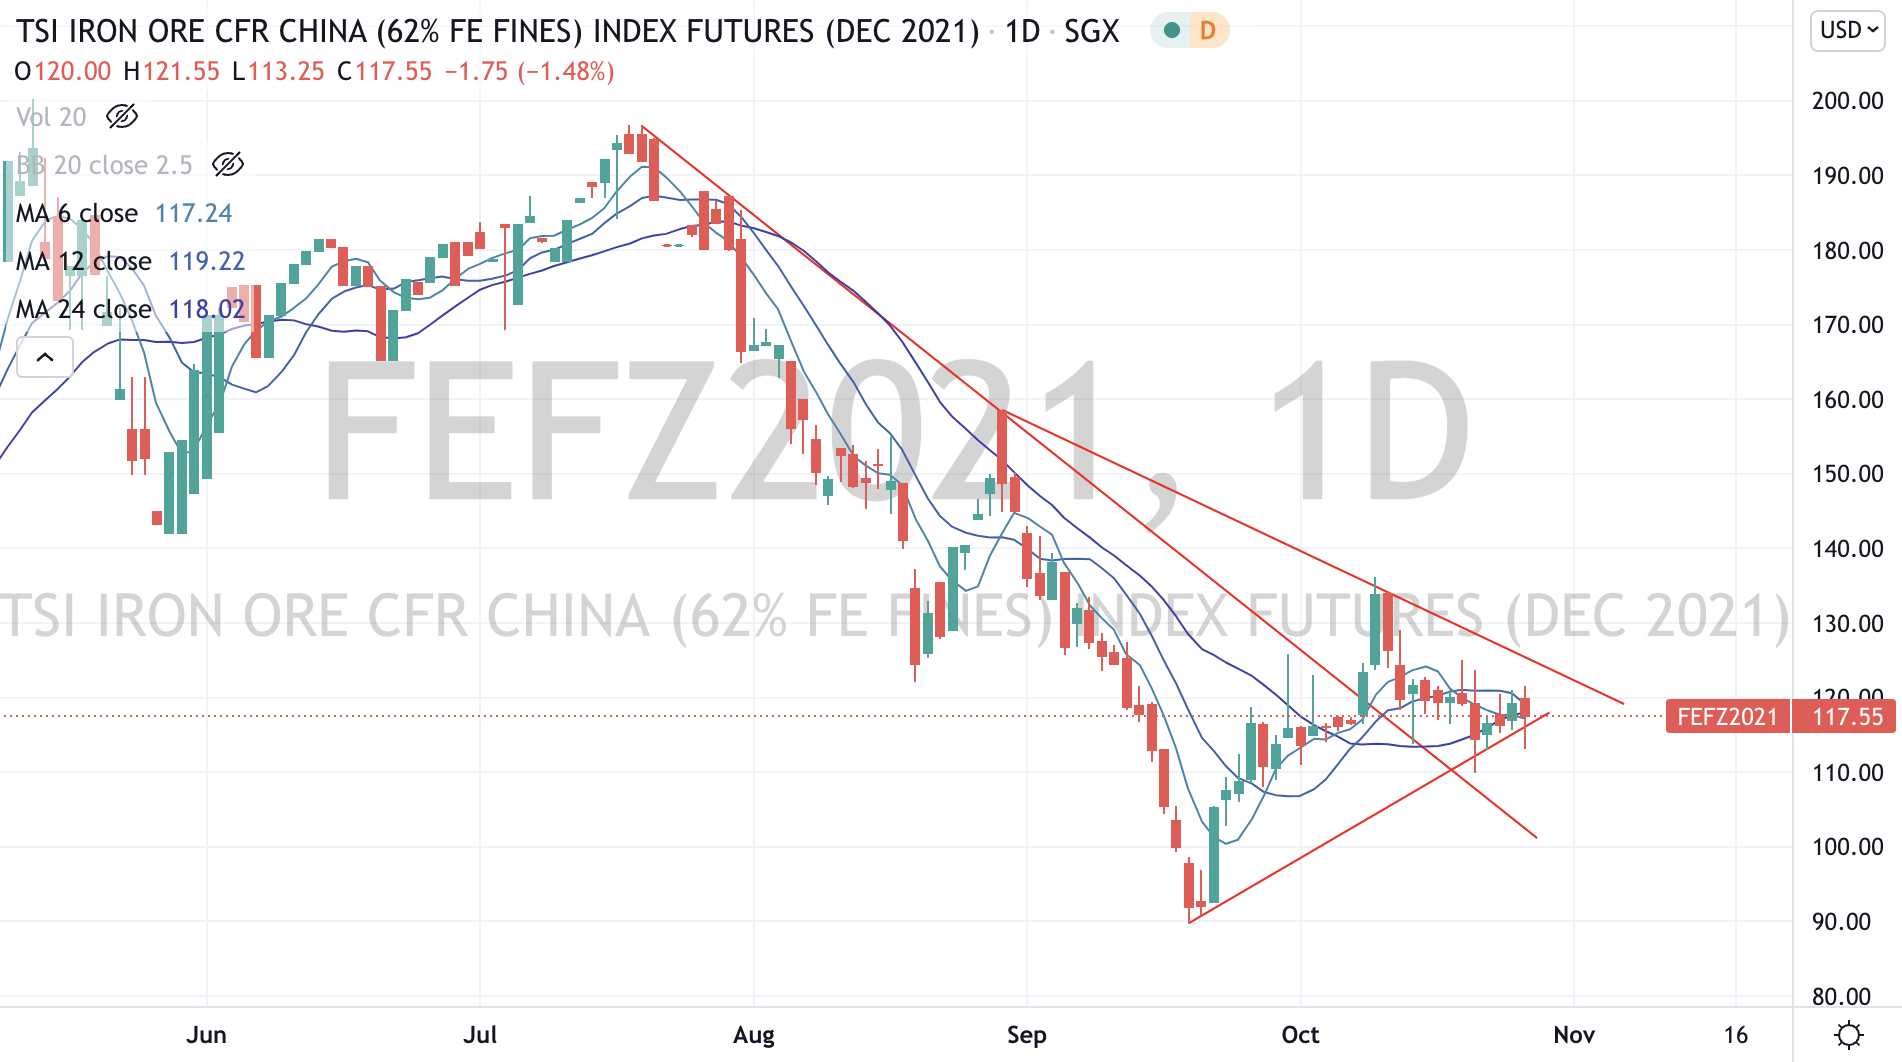
Iron Ore
The Oversold Quinella – Both Overbought and Traded at > 2.5 standard deviations above the weekly mean.
None
Notes & Ideas:
A more muted week of price movements registering+/- of 2% than previous editions.
We mainly saw decliners in energy and base metals while advancers were seen in agricultural commodities and selected equity indices.
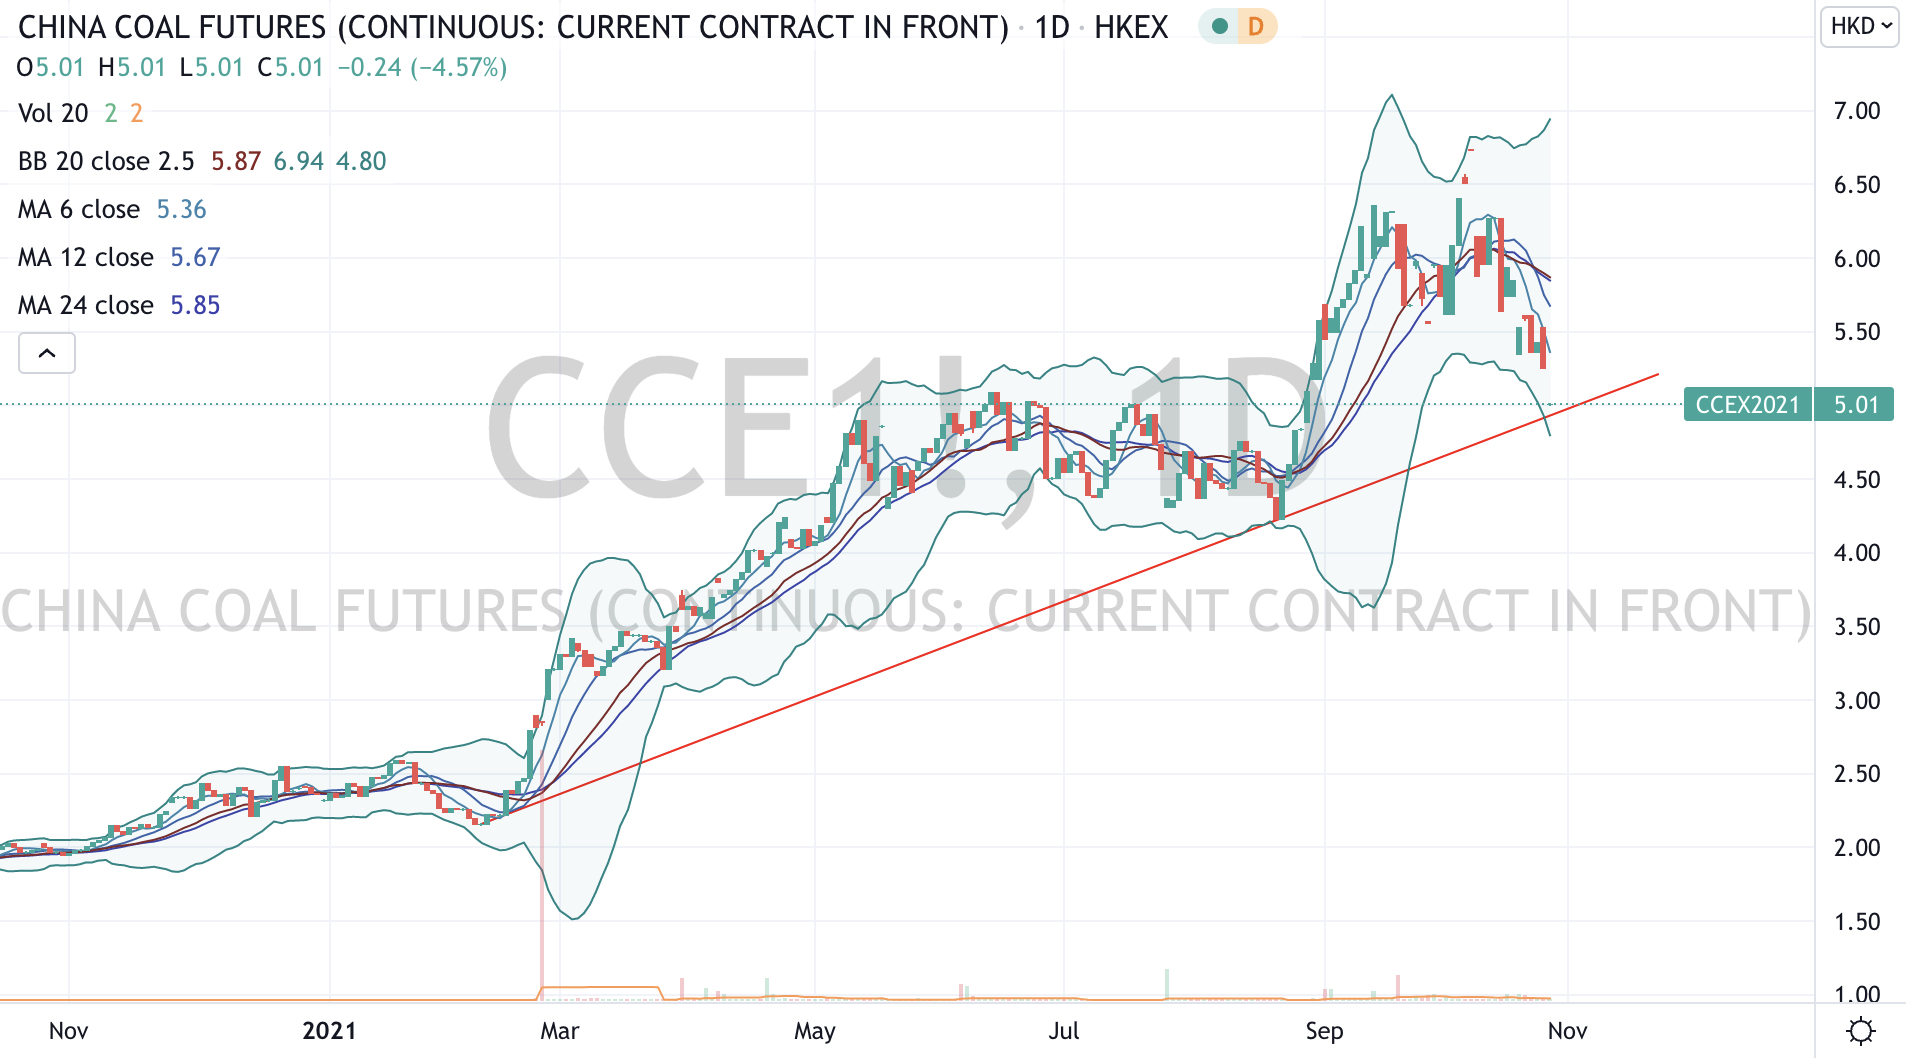
Remember how unloved the Chinese equity market was only a month ago?
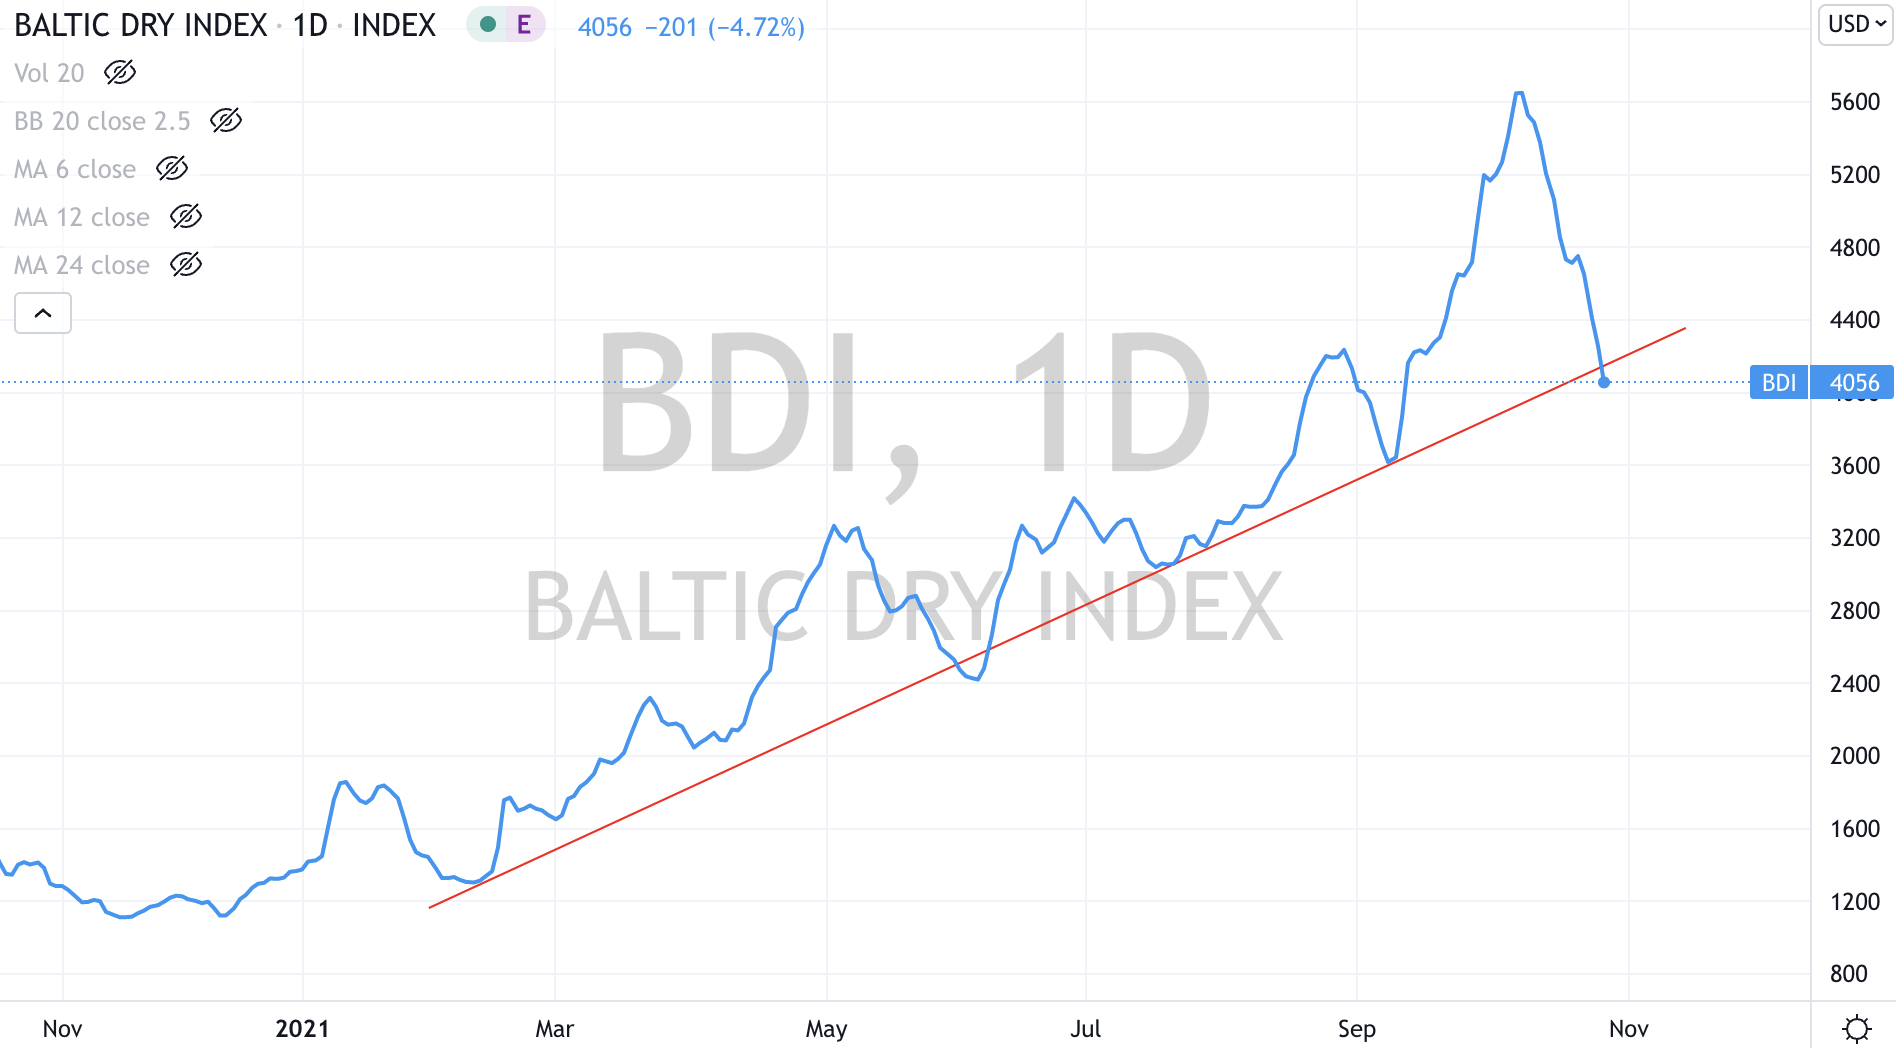
Other highlights were the continued decline in the Baltic Dry Index and LNG prices along with a smashing of Brazil’s BOVESPA equity index.
Rising government bond yields also continue to rise and seem stretched at this moment and the AUD/USD traded up to 0.7510 as mentioned in last week’s post.
The larger advancers over the past week comprised of;
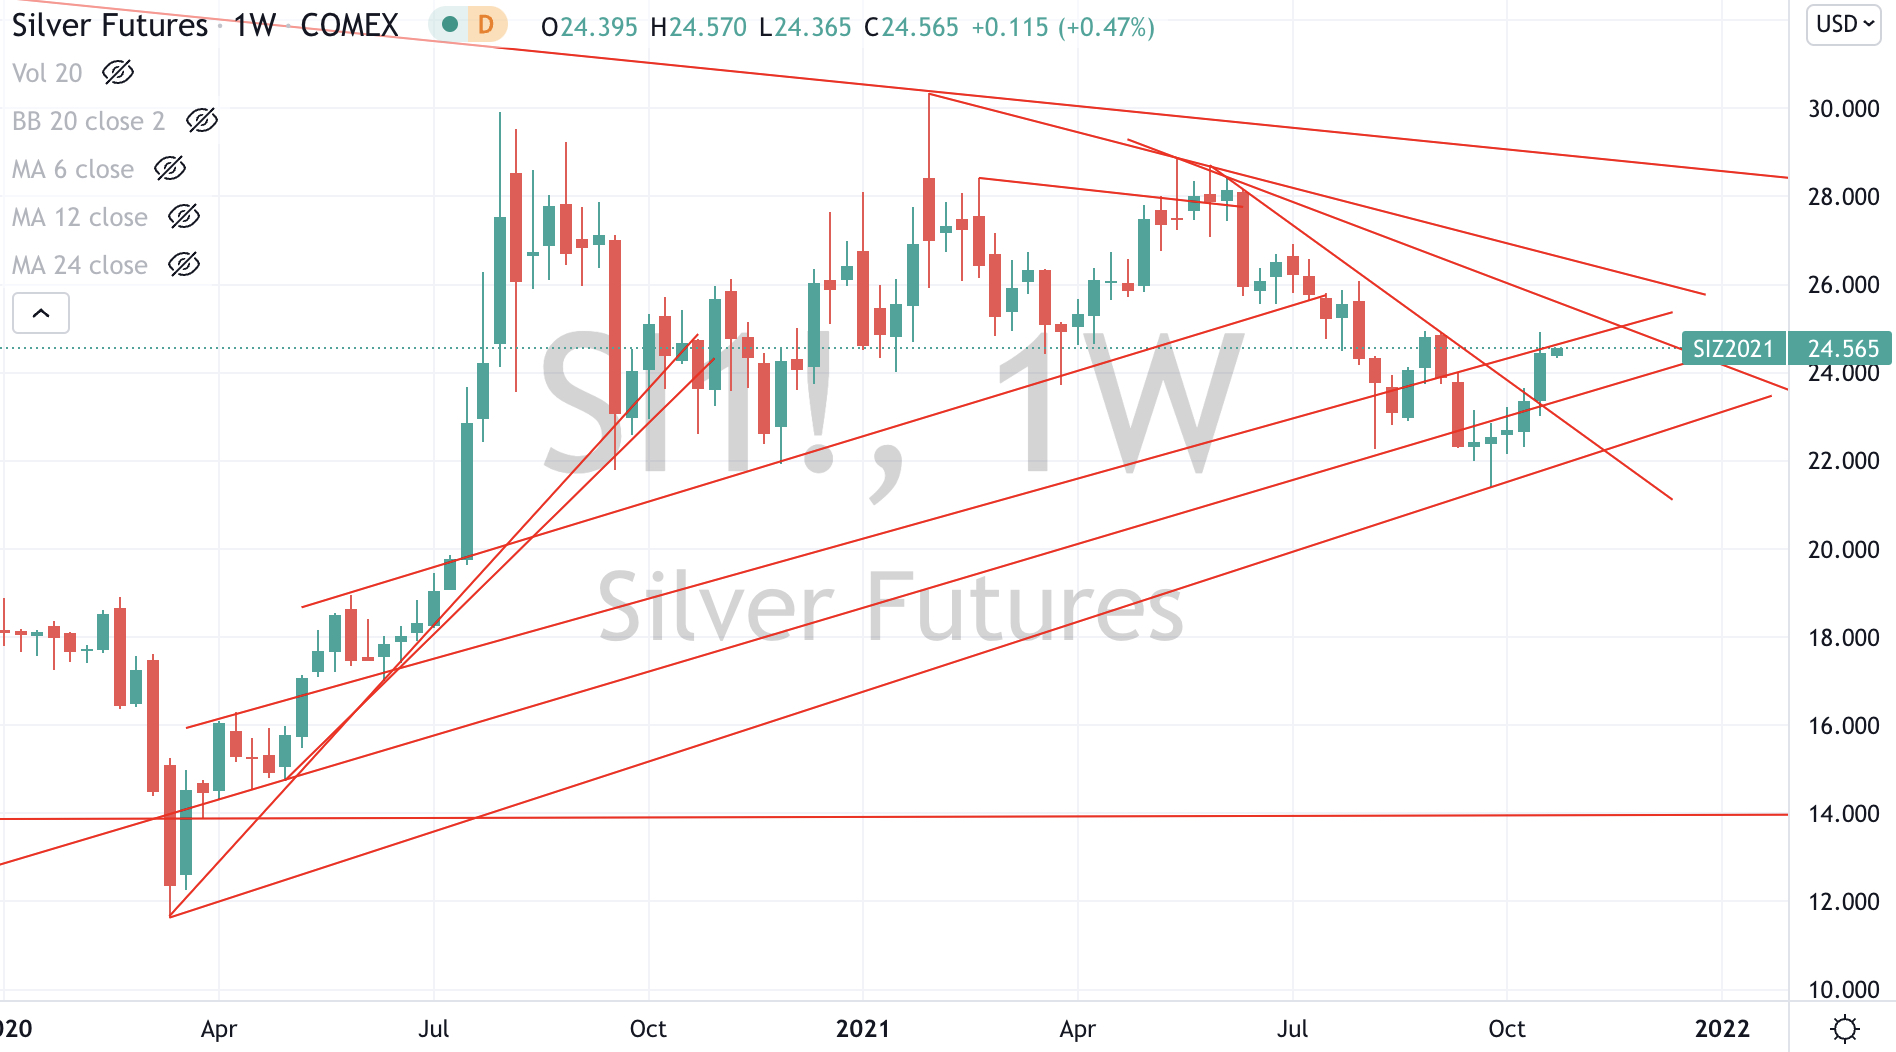
Orange Juice 4%, Silver 4.7%, Corn 2.3%, Wheat 3%, Uranium 4%, KBW Banking Index 4.1%, Dow Jones Transports Index 3.8%, HSCEI 4.3%, Hang Seng Index 3.1%, Copenhagen equity index 3.6% (both Maersk and Vestas rose 9%) and BIST Istanbul 3.7% (in light of a 2% central bank rate cut)
The group of decliners included Aluminium (8.3%), Lean Hogs (6.3%), Gasoil (2%), Baltic Dry Index (9.1%), Copper (4.9%), LKM LNG (2.9%), Coffee (2%)_, LNG (6.7%), Natural Gas (2.4%), Sugar (3.6%), China Coal (5%), Rotterdam Coal (3.7%)m, Dutch TTF Gas (6.7%), BOVESPA (7.3%).
Please refer to last weeks edition for key levels which I continue to watch.
October 24, 2021
by Rob Zdravevski
rob@karriasset.com.au