A rare occurrence for the Nasdaq
January 26, 2022 Leave a comment
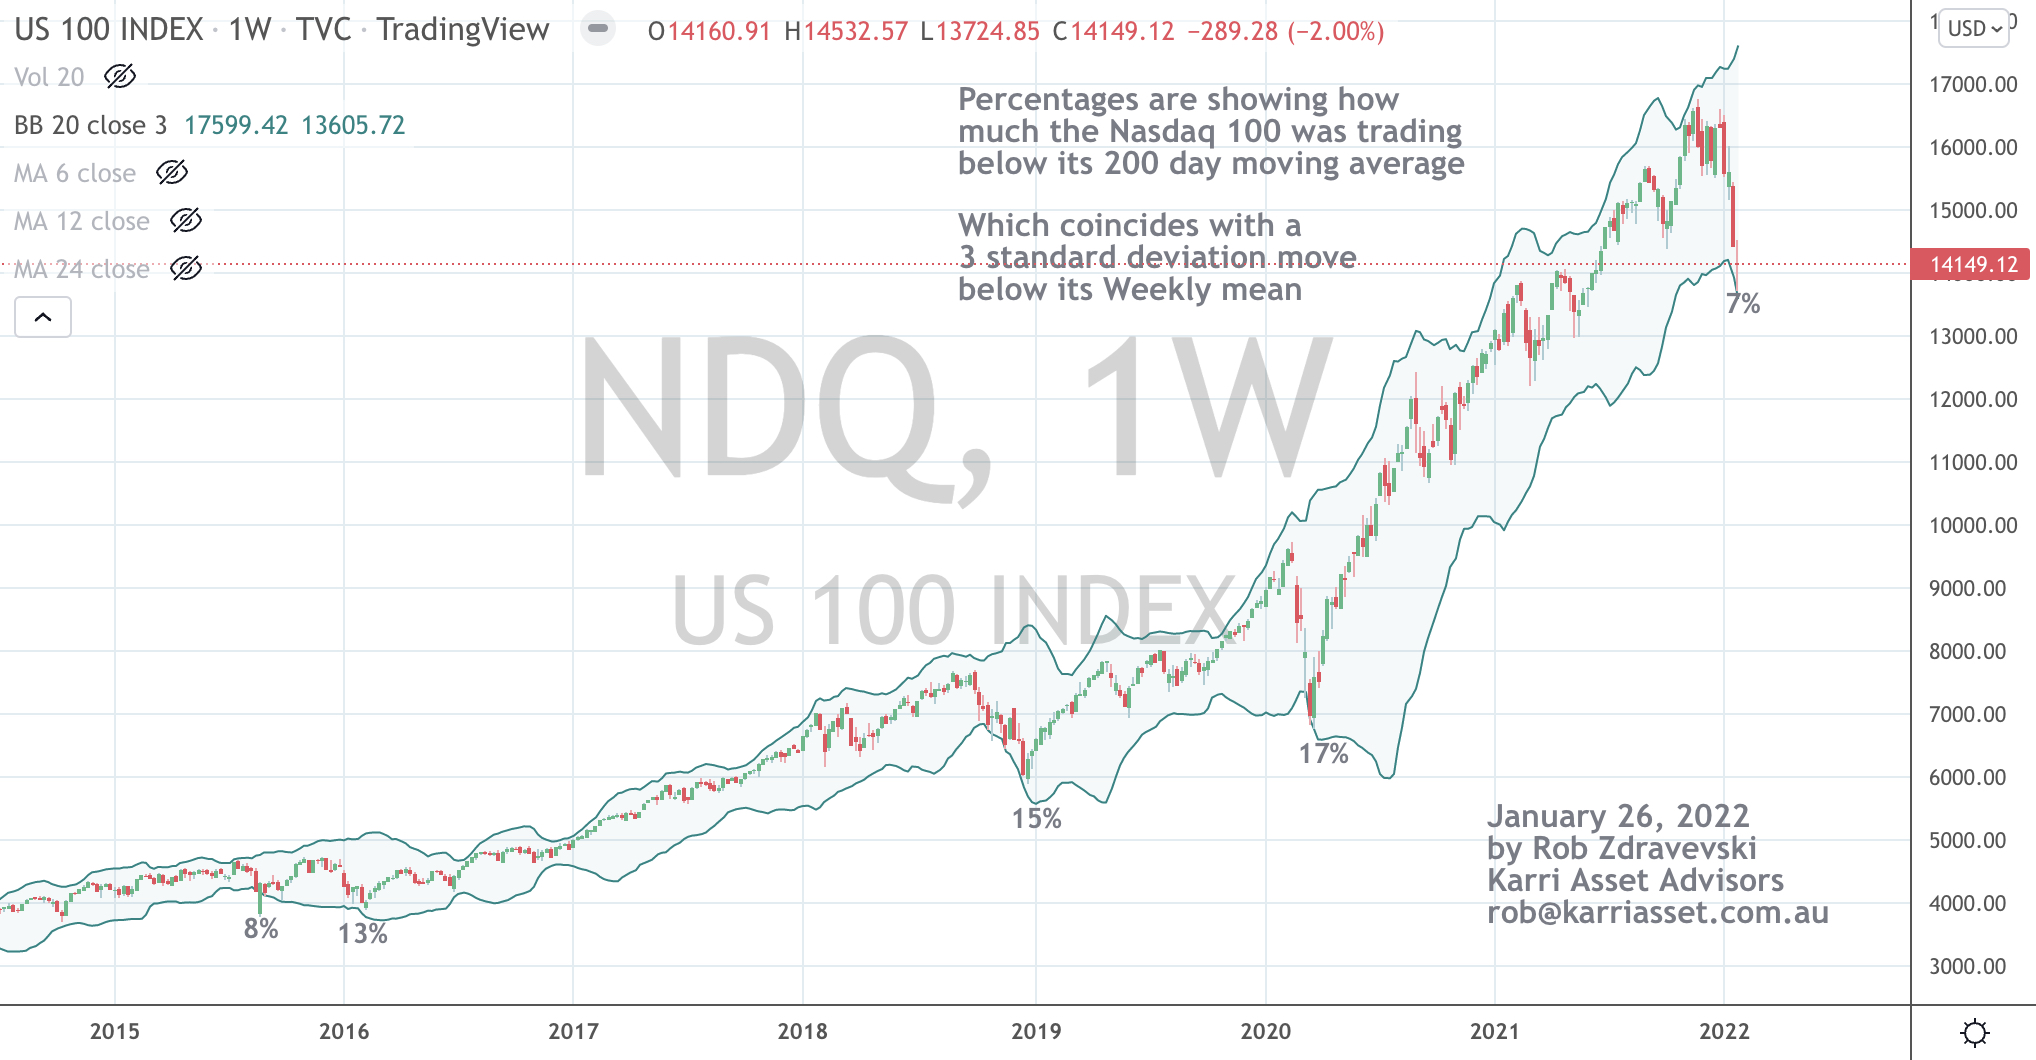
This is only the 6th time in 10 years (starting with a 9% reading in September 2011) that the Nasdaq 100 has traded at a notable percentage below its 200 day moving average, which I have marked on the chart below.
And at each time, it also coincided with a 3 standard deviation move below its Weekly mean.
There is also a reasonable omen with the U.S. 2 year Treasury Note yield registering a Weekly Overbought signal (for only the 6th time in 15 years).
Past mean reversion’s in those 2’s had aided a Nasdaq advance.
January 26, 2022
by Rob Zdravevski
rob@karriasset.com.au