Chasing rainbows and jumping at shadows

It pays and saves to observe where the noise is coming from.

Furthermore, it’s wise to identify where the most crowded trades are.

In the past weeks, the froth which appeared in the financial media included;

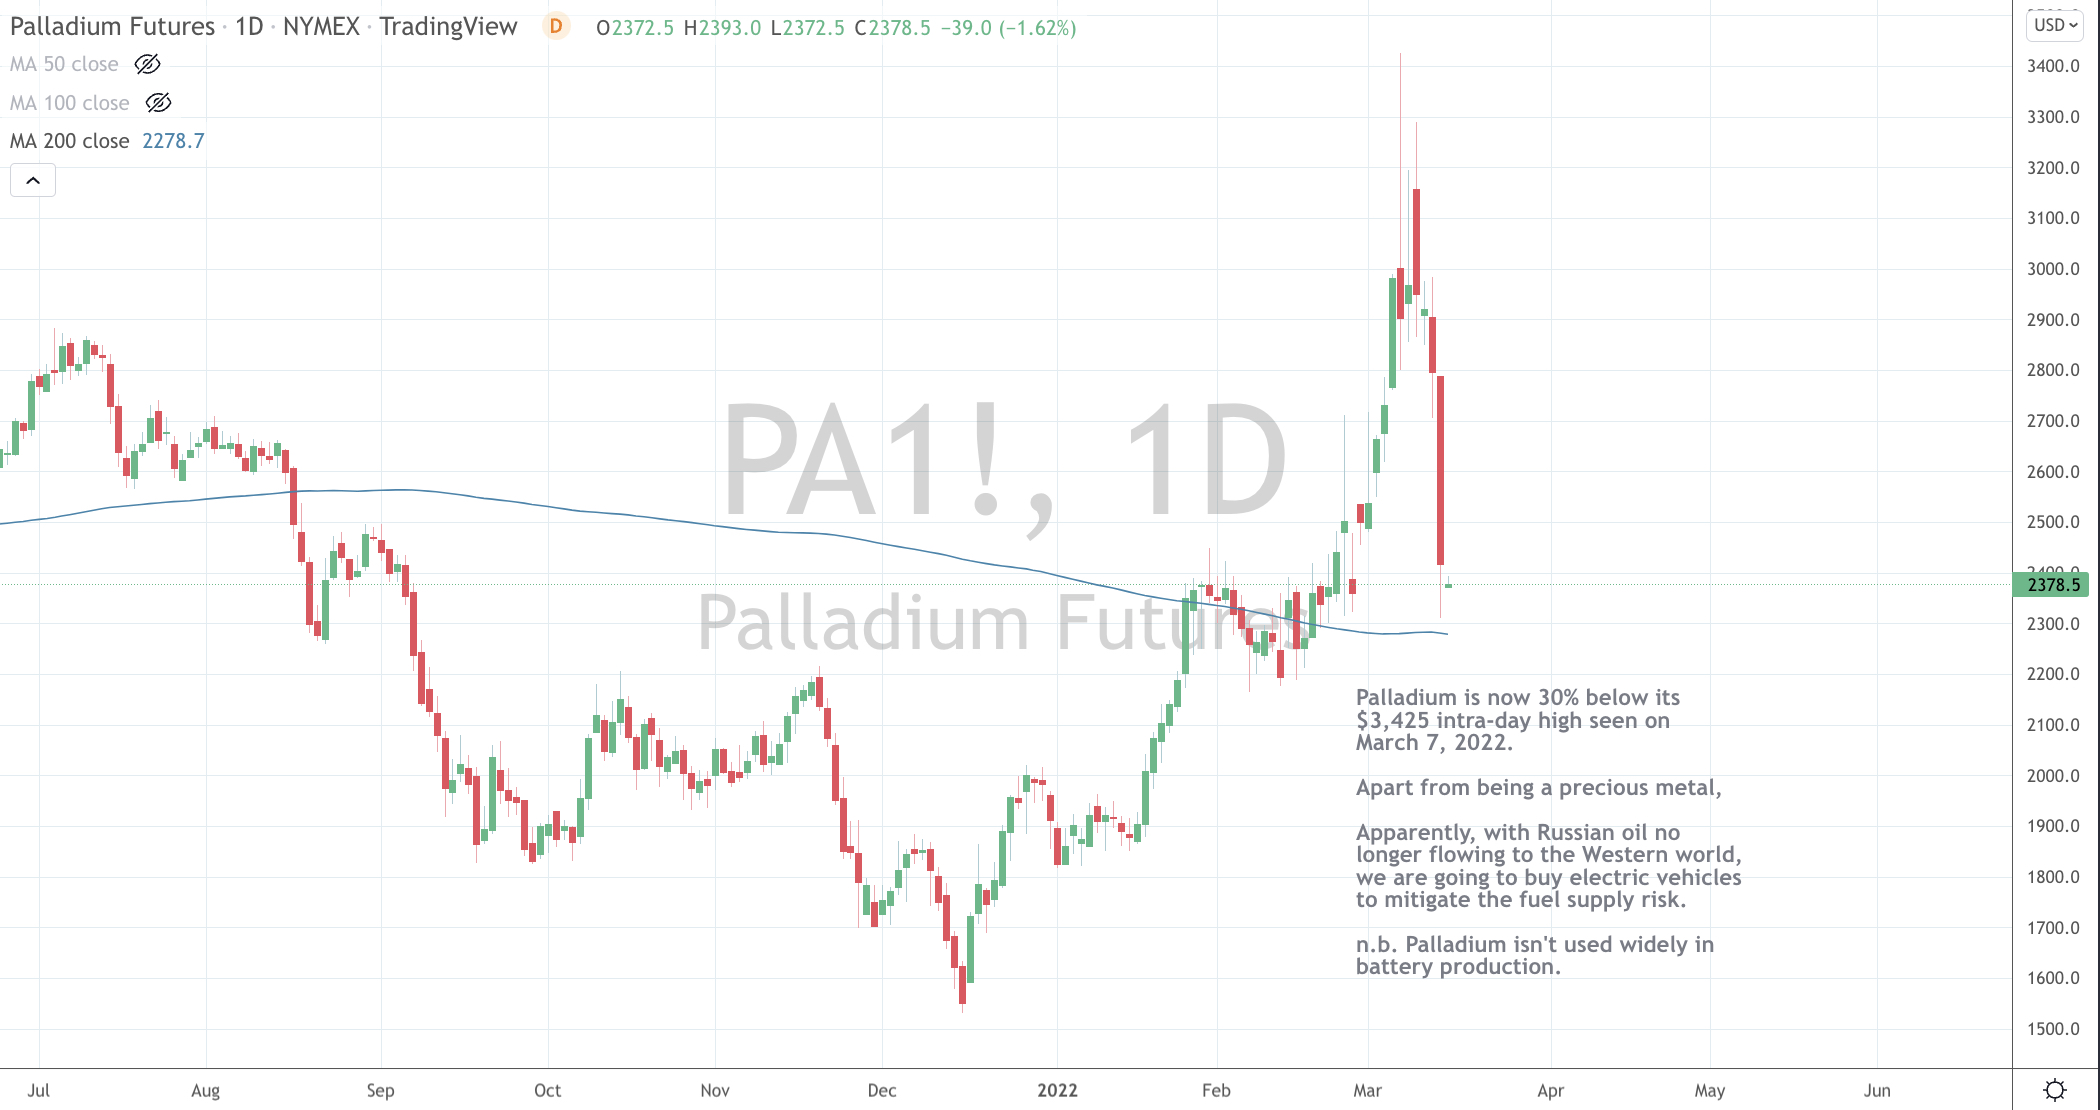
Oil rising from $94 to $130. It’s now $96, which is the same price when Russia invaded Ukraine.

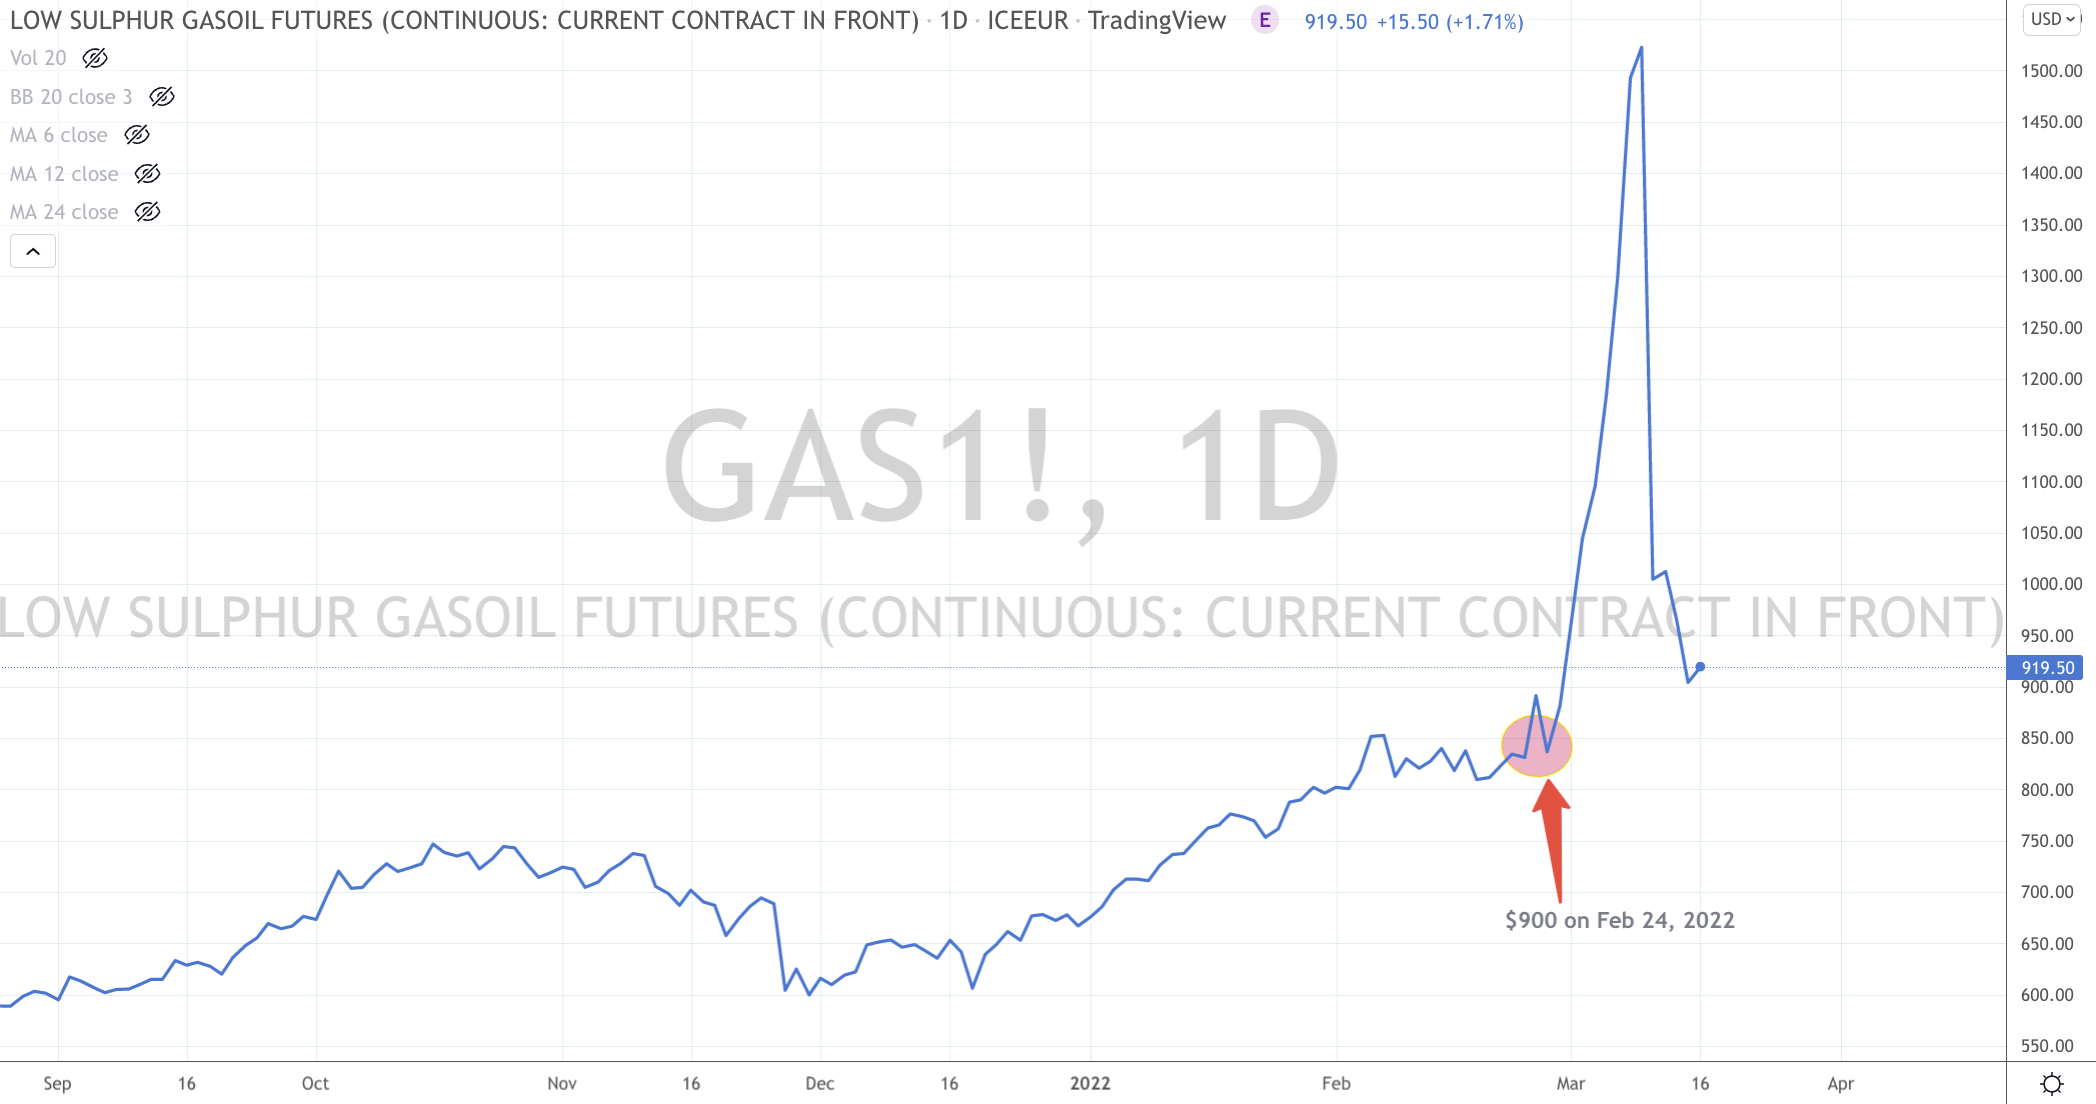
Gasoil (diesel) futures contract rose from $900 (on February 24, 2022) to $1,665 and its now back to $900.

Wheat went from $8.40 to $13.60 to now trade at $10.50.

The price of Rotterdam delivered coal went from $193 to $460 only to fall back to $312.

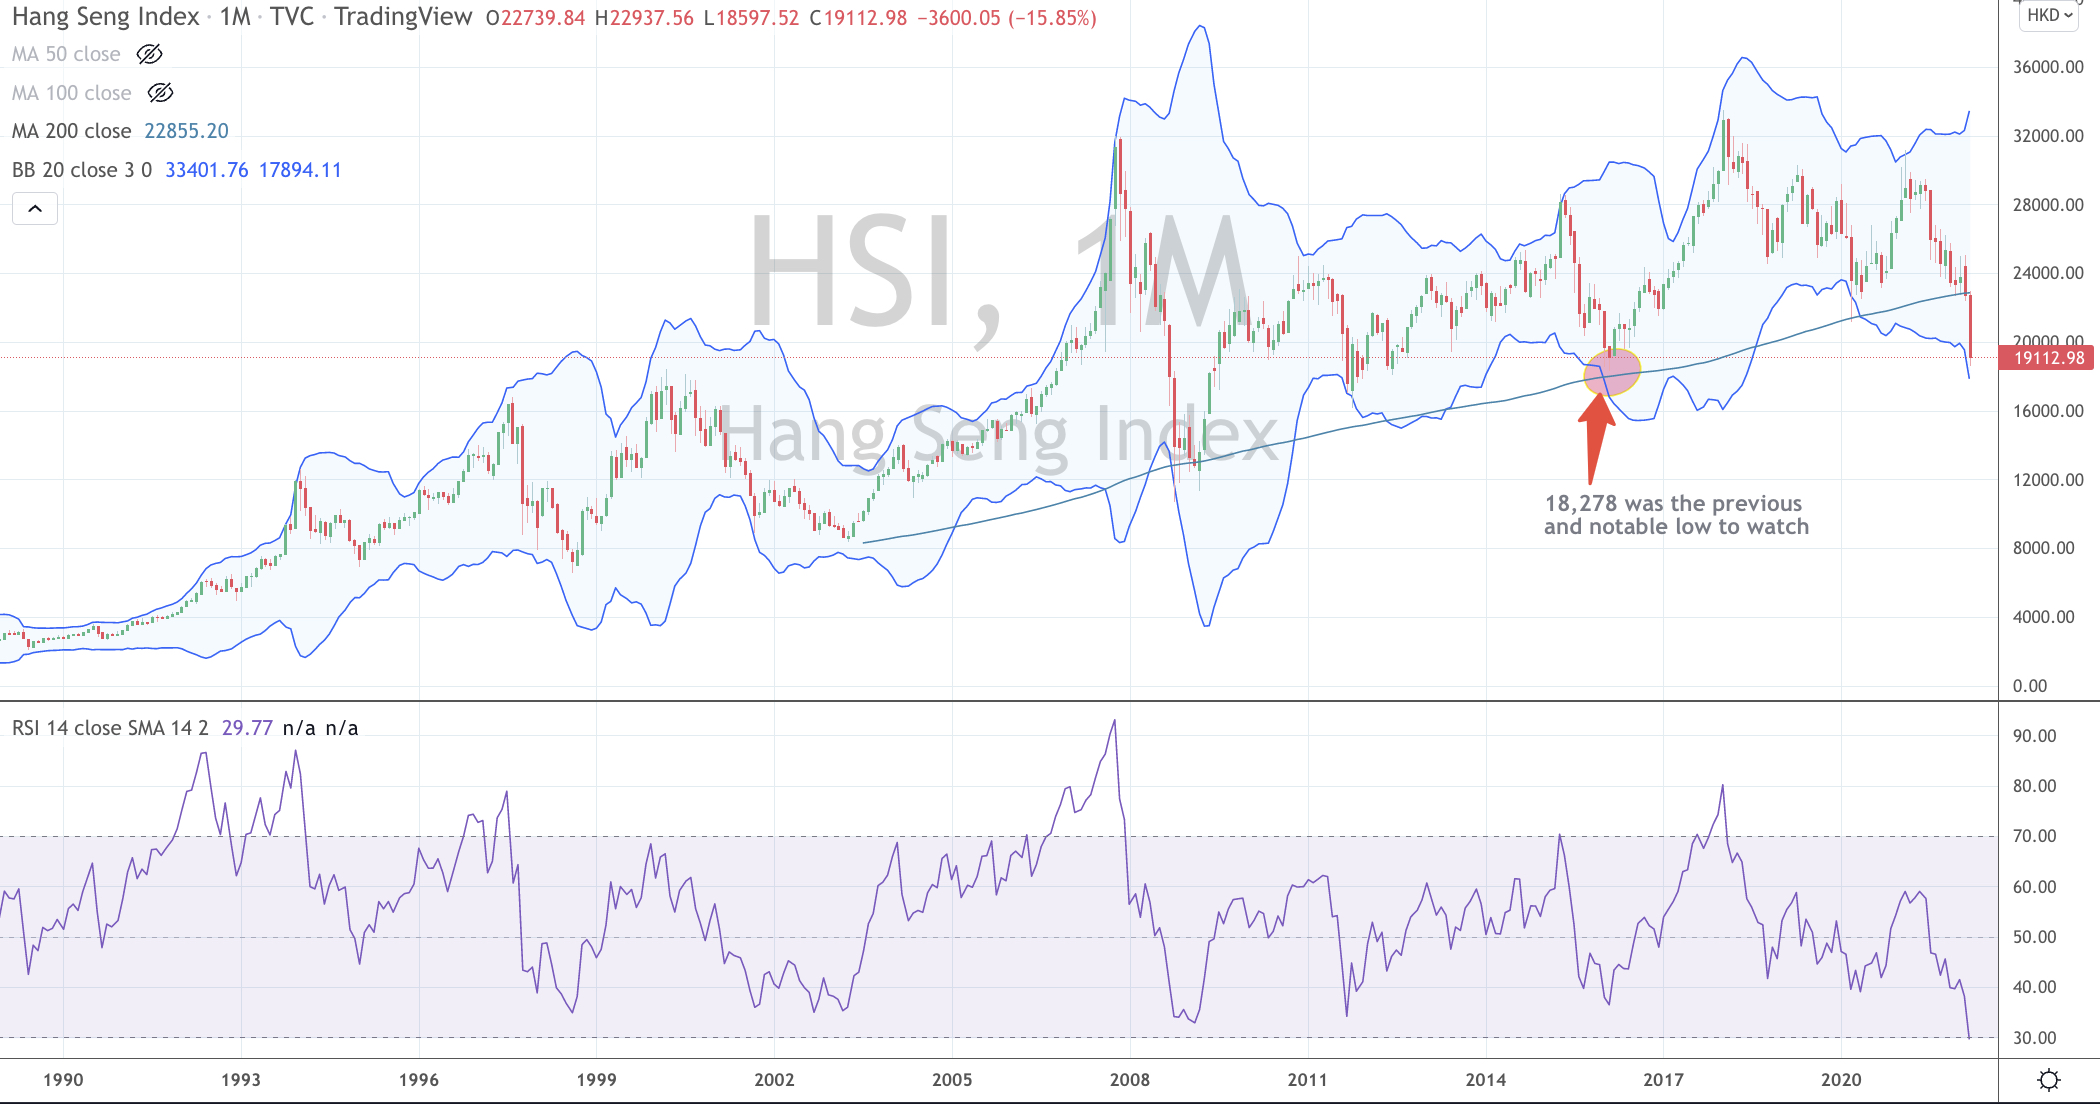
Since February 14th, the Hang Seng market fell 27%. It’s now 15% higher than this week’s lowest point.

It goes on and on.

A lot of money has been made and lost on these moves, both and up and down. For those of the correct and wrong side of the trade. Some were Long and others were Short.

Now that Oil has fallen 30%, I don’t hear the media fervour in the same manner as when it was rising.

Apparently when Oil was at $120, it was going to $200.

A couple years ago, when Gold last touched the $2,000 market it was on a one way path to $4,000

Remember when Bitcoin was $60,000, “the noise” was gearing us up for $250,000 or $500,000.

Reiterating that journalists (and the pundits) are merely reporting the news which has already occurred, it’s important to remind yourself that they aren’t market participants.

Canny investors and traders position themselves before the news is reported.

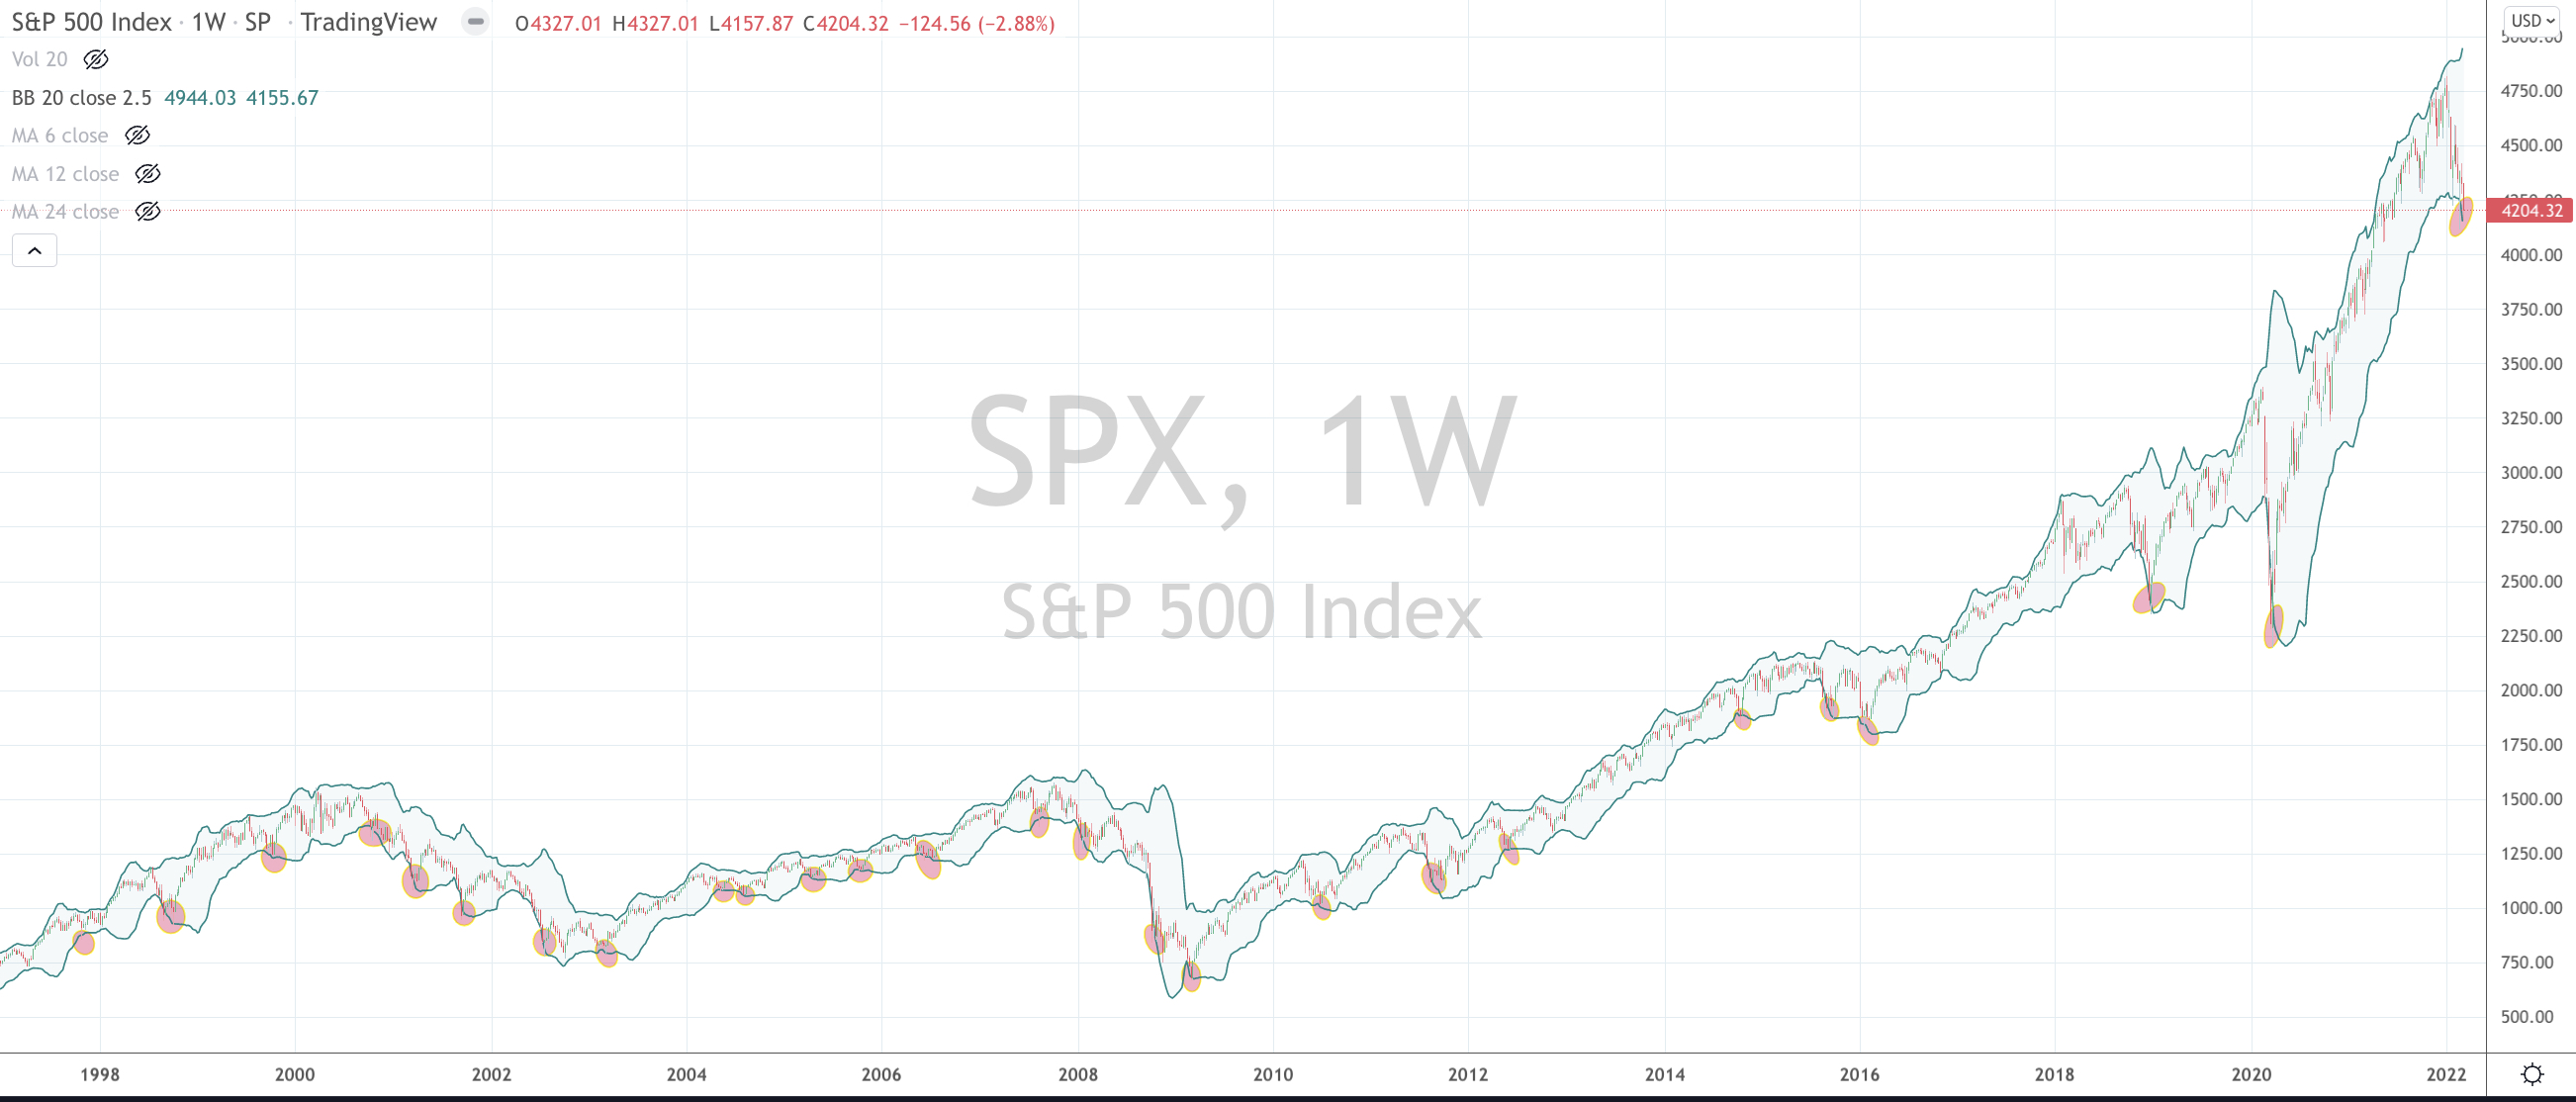
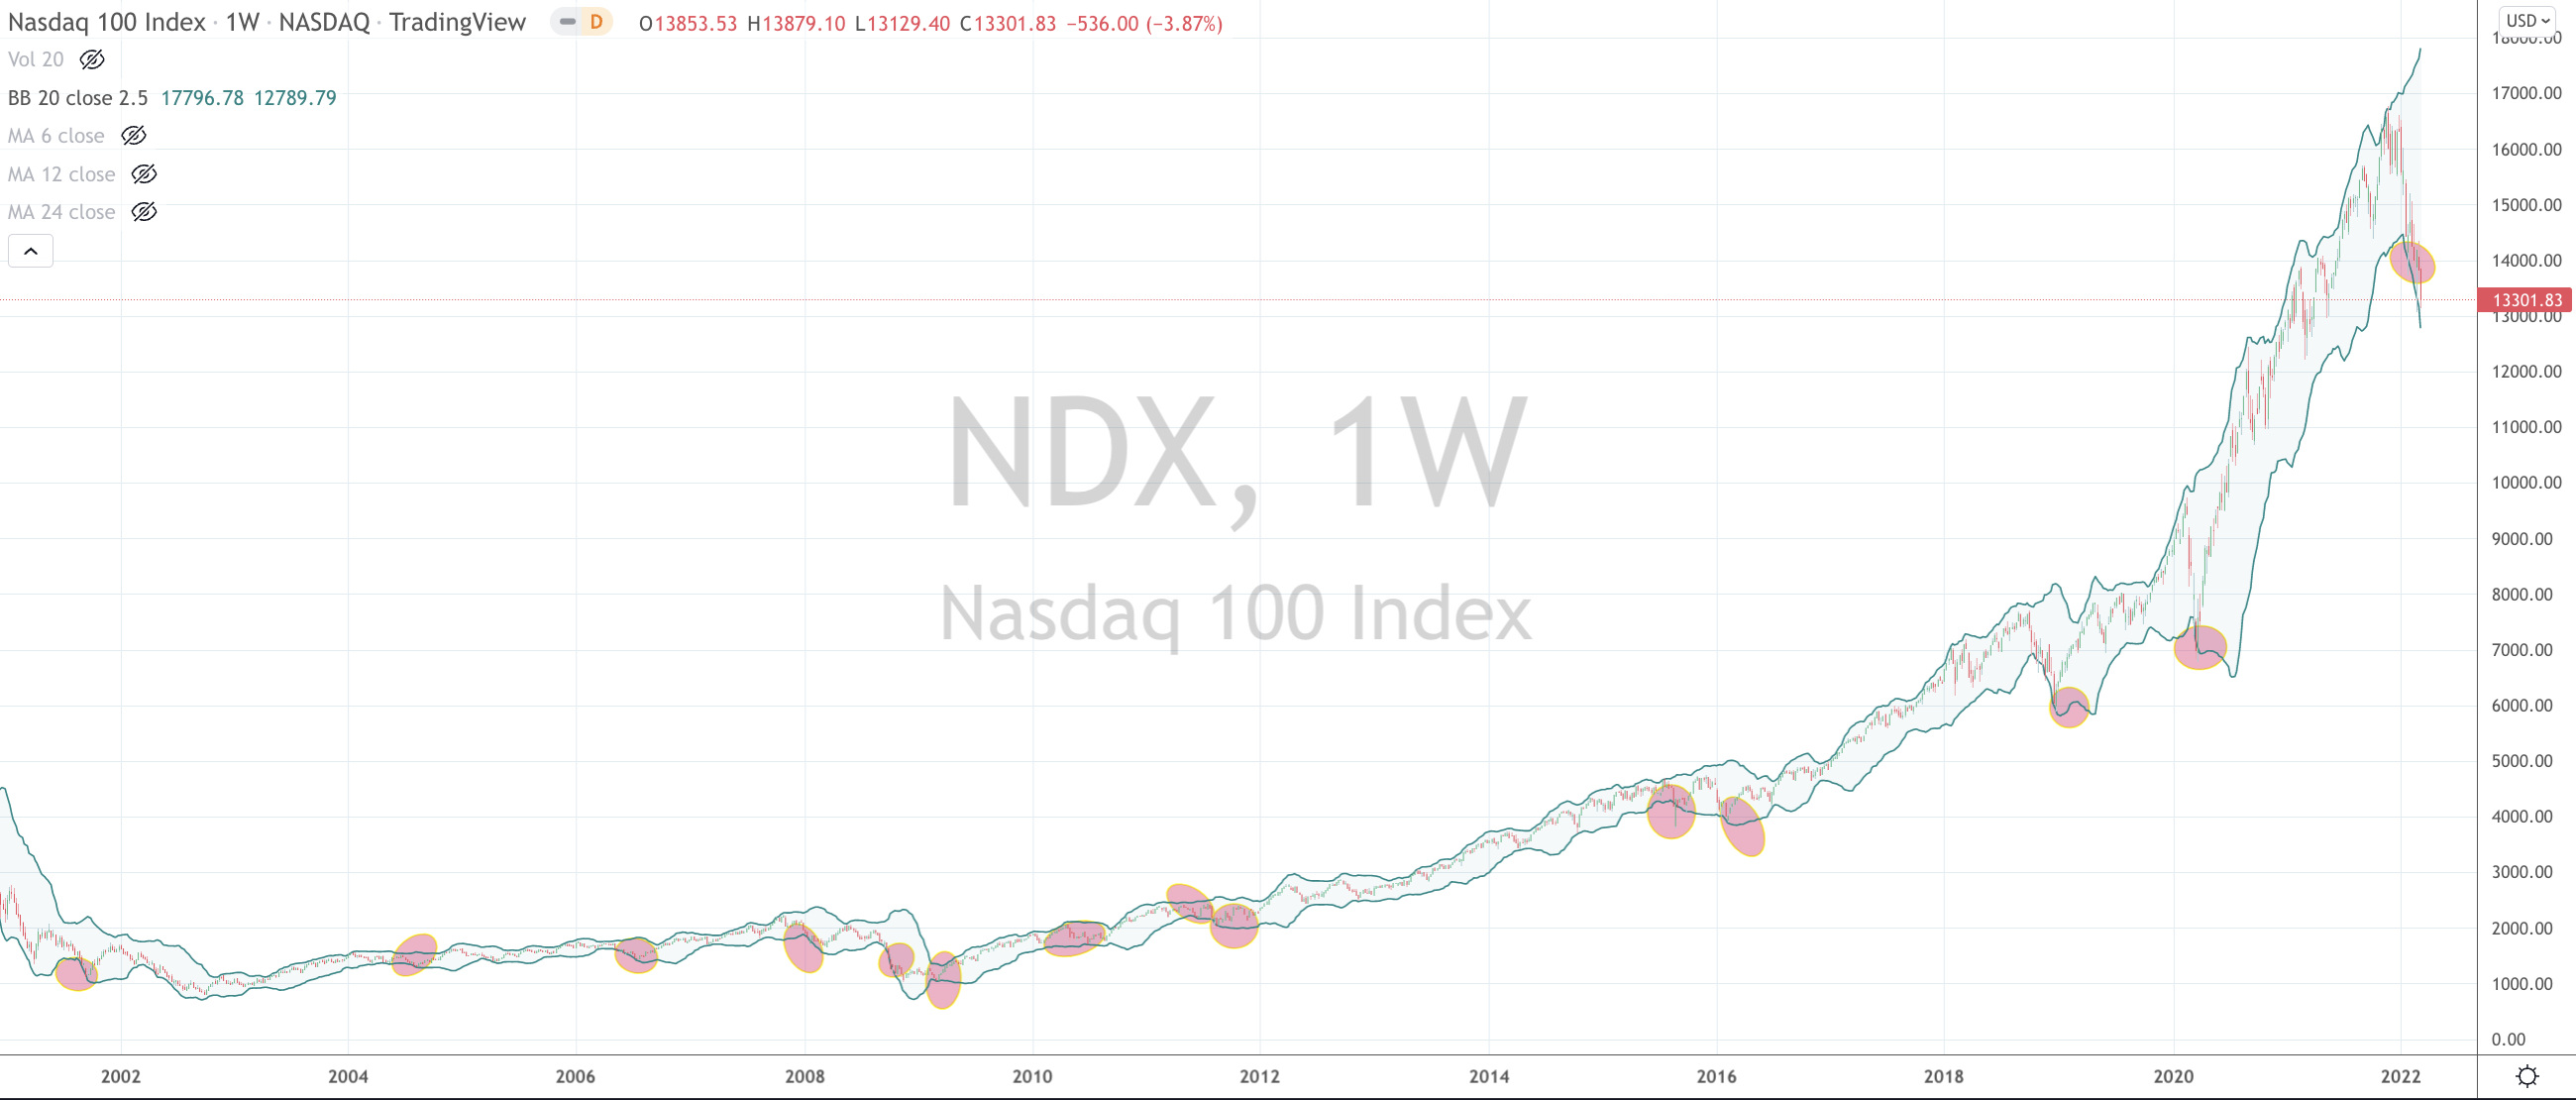
Today, I see the Hang Seng market up 16% in only 2 days. Over the same time, the Nasdaq has risen 6.8% and the S&P 500 has advanced 4.3%

Stocks such as Alibaba and Shopify have climbed 34% and 17% respectively in the past 2 days.

On other note, this doesn’t necessarily make me happy because it just shouldn’t be doing this.

You shouldn’t crank out 1 year of gain from an index in only 2 days.

Be careful, everywhere.

Do your own thinking and ignore or filter the noise.

Markets go to where they can do the most damage.

That can mean up or down. It can hurt you if you are short or long at the wrong time or price.

It can hurt you when they go up, if you aren’t invested and then decide to chase the train which has left the station.

It can hurt you when you sell your stock at its lowest point because the pain is too much to bear and your investing horizon suddenly changes from years to days.

Be careful when chasing rainbows or jumping at shadows.

March 17, 2022

by Rob Zdravevski

rob@karriasset.com.au

Simple analysis and being opportunistic

Today, the Hang Seng Index is trading at 19,113 points.

The chart below is on a Monthly basis, not my normal weekly series.

Yes, the index has previously traded to 3 standard deviation below its monthly mean.

and Yes, it has previously touched its 200 Month Moving Average.

But it has never traded this much percentage below its 200 Moving Moving Average.

More importantly, the Hang Seng has never made an Oversold reading on a Monthly basis.

I’ll watch if it holds the 18,278 low seen in February 2016.

Will the Hang Seng Index continue to exist?

Will the Stock Exchange of Hong Kong (SEHK) continue to list the securities of various companies?

If so…..this may be the only piece of analysis required.

March 15, 2022

by Rob Zdravevski

rob@karriasset.com.au

Be careful chasing shiny things

Here is a little story of Palladium’s recent price action.

Platinum will be more interesting to buy around the $900 mark.

March 15, 2022

by Rob Zdravevski

rob@karriasset.com.au

Most stinkiest, unloved and oversold – Currencies

First, you must pick a currency.

It is the first thing you must do; when conducting business, settling a transaction or making an investment.

Even if you are buying oranges from the greengrocer, unless you are trading them for apples.

It’s time for some tactical tweaks and tilts in the Currency market.

The evident move has been the strengthening of the U.S. Dollar.

I’m a Seller of some USD and preparing to…..

Buy some Euro near the 1.08 level,

Buy some GBP at 1.2850,

Buy JPY (now) around the 117.50 mark,

Buy some HKD (if you have business to conduct there)

The Korean Won is back to the same weakness (against the USD) seen in March 2020, which mimics the same level as February 2016 and July 2010.

That is certainly making South Korea competitive again which is good for their electronics, heavy machinery and automobile industries.

I’ll be interested buying their equities when the KOSPI Index touches 2,460, which is a further 7% below today’s closing price.

And finally, the Danish Krone (DKKUSD 6.80) and Swedish Krona (SEKUSD 9.60) are also exhibiting notable weakness, attractive to Buy, should you specific commercial requirements to do so.

March 14, 2022

by Rob Zdravevski

rob@karriasset.com.au

Most stinkiest, unloved and oversold – Equities

As of March 14, 2022….

These are the most stinkiest, unloved and oversold equity indices in the world at this moment;

(except for Russia because it’s not open for trading)

CSI 300

DAX

Italy’s MIB

HSCEI

Hang Seng

IBEX

Helsinki

And these ones are nearly there……but not yet

FTSE 100

Stockholm

Amsterdam

CAC 40

Shanghai Composite

Kospi

Nikkei 225

March 14, 2022

by Rob Zdravevski

rob@karriasset.com.au

Watching currencies closely

The bias for the AUDUSD is lower.

The recent 2 cent rally was divergent to the global US Dollar rally and was without strength.

Its on important support at the moment, being 0.7230

but it is something to watch closely and poised to break either way in next 2 days as it remains stuck in a broad range between 0.7550 and 0.6970.

but my work suggests the ’set-up’ is for lower AUD vs USD,

this will translate a reversal in USD strength against the Yen as well

If we see all this play out, it should also result in commodity prices correcting and a truce called between Russia/Ukraine.

March 14, 2022

by Rob Zdravevski

rob@karriasset.com.au

Contrarian considerations and dangerous markets

The consensus seems to be;

Stocks are going lower,

Gold is destined higher,

Interest Rates can only rise,

Inflation is omnipresent,

Other commodities will stay elevated

and Oil is to surge further.

I’m spending some time thinking about the opposite occurring.

Furthermore, I have been commenting to clients how dangerous these markets can be.

In some cases, they are resembling a ‘video game’.

This means that the reality of the risks involved doesn’t always register or perhaps the repercussions aren’t recognised or considered to be real.

WTI Crude Oil recently traded at a high of $130.50.

5 days later , it is now $106.

When you ponder that someone bought that Oil at that $130.50 high and should they still hold it, they are comforting a 18%.

This is the same percentage loss that buyers of Wheat are wearing if they also paid the recent highest price.

On March 7th, someone paid $227 for a futures contract in Dutch TTF Natural Gas. Today’s that European gas price is trading at $131.

When riding any type of wave, it’s quite nice to surf the fat part of the ride. You want to avoid the foam and choppy bits.

It is often when things become broken and messy.

March 14, 2022

by Rob Zdravevski

rob@karriasset.com.au

I prefer an Oversold yield curve

Here is the US10-US02 bond yield spread (the yield curve) overlaid against the S&P 500.

If you closely track when the yield curve goes ‘notably’ Oversold (on a weekly basis), it’s prescient that the S&P 500 finds support for its next advance.

Now it is doing this for the 9th time in 35 years.

The only time when a new S&P 500 bullish trend was stifled or diffused, was when the yield curve moves sharply to an Overbought level (or more specifically to a reading near to 62 or above) within 10 months of seeing its previous Oversold moment.

Coinciding with my earlier posts today, the timing of entry will be the artistic part.

The science of seeing the yield curve touching 0.08% – 0.02% may aid the decision.

March 13, 2022

by Rob Zdravevski

rob@karriasset.com.au

Extreme observations in the S&P 500

Here is another one for the asset allocators……the S&P 500 is making its 26th visit down to a 2.5 standard deviation move within the past 35 years.

It’s been a handy long term buying moment.

p.s. Long-Term doesn’t equal 3 weeks.

Long-Term is the type of timeframe involved when you consider buying shares for a new born child and not telling them about it until they are allowed to legally buy alcohol.

Timing the entry points and wading in will be artistic part.

March 13, 2022

by Rob Zdravevski

rob@karriasset.com.au

The beginning of a new Nasdaq purple patch?

Also, the Nasdaq 100 is in a patch where it’s trading 2.5 standard deviations below its weekly mean.

This is the 14th ‘patch’ in 20 years.

Note the circles in the chart below.

Of course, there is accompanied analysis required, although it bodes well for the beginning of a purple ‘circled’ patch.

March 13, 2022

by Rob Zdravevski

rob@karriasset.com.au