Macro Extremes (week ending May 20, 2022)
May 22, 2022 Leave a comment
The following assets (on a weekly timeframe) registered an Overbought or Oversold reading and/or have traded more than 2.5 standard deviations above or below its rolling mean.
Extremes “above” the Mean (at least 2.5 standard deviations)
None
Overbought (RSI > 70)
Australian 2, 3, 5 & 10 year government bond yields
Spanish, French, Greek, Italian, Swedish and Portuguese 10 year government bond yields
U.S. 2 & 5 government bond year yields
U.S. Dollar (DXY) Index
Natural Gas
Gasoline
CRB Index
The Overbought Quinella – Both Overbought and Traded at > 2.5 standard deviations above the weekly mean)
None
Extremes “below” the Mean (at least 2.5 standard deviations)
Tin
NZD/USD
CNH/USD
SGD/USD
Dow Jones Transports
S&P 400 Mid Cap index
Nasdaq Transports
Copenhagen 25 Index
Oversold (RSI < 30)
Russell 2000
NZD/AUD
KRW/USD
JPY/USD
HZD/USD
The Oversold Quinella – Both Overbought and Traded at > 2.5 standard deviations above the weekly mean)
Dow Jones Industrial Average
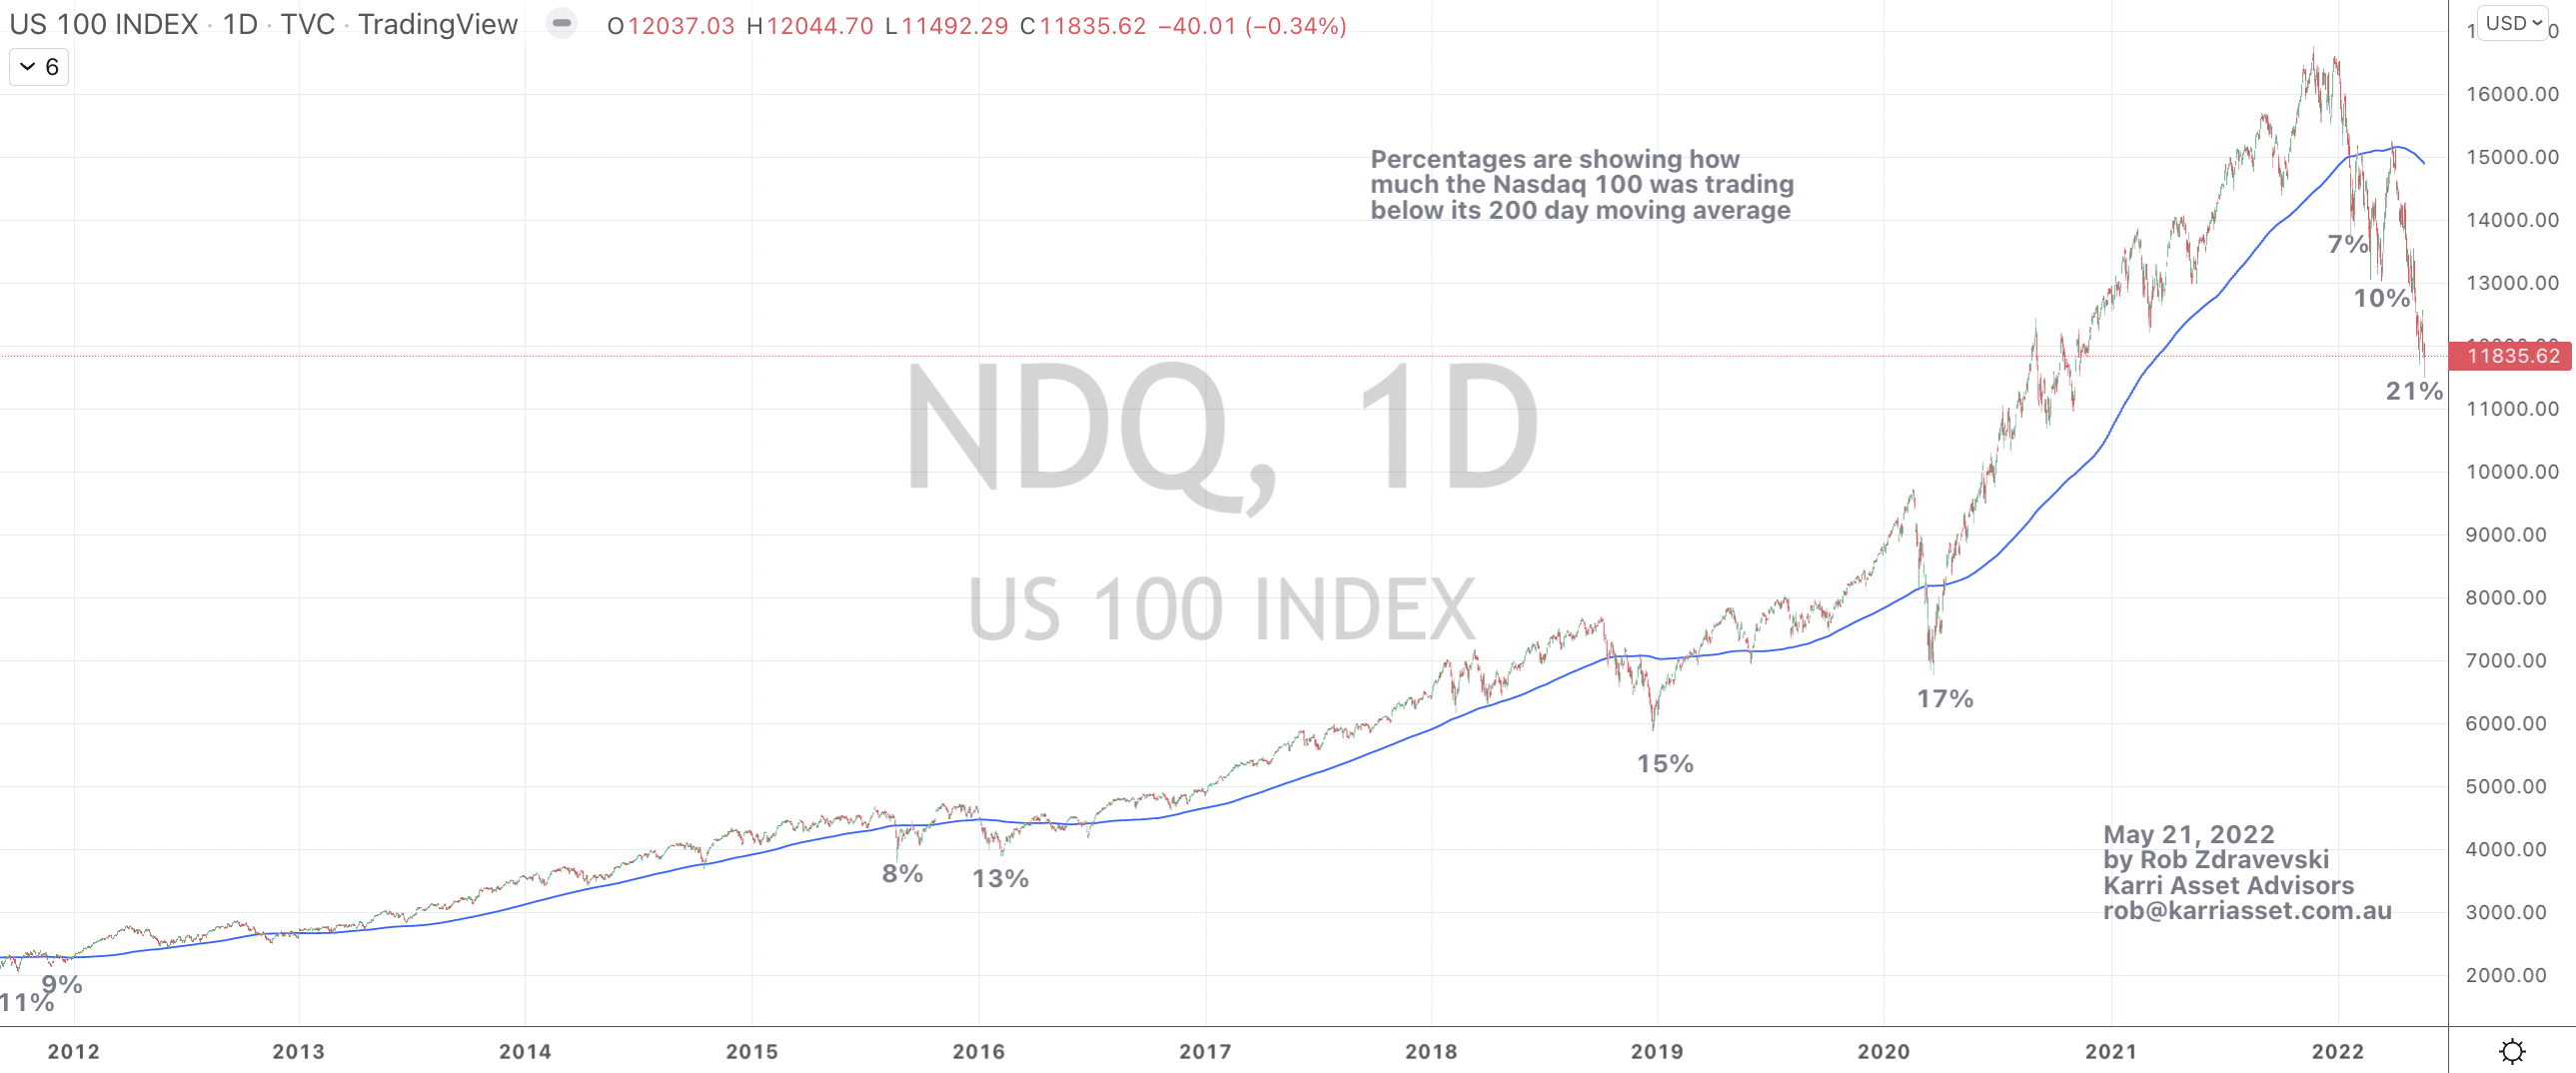
Nasdaq 100
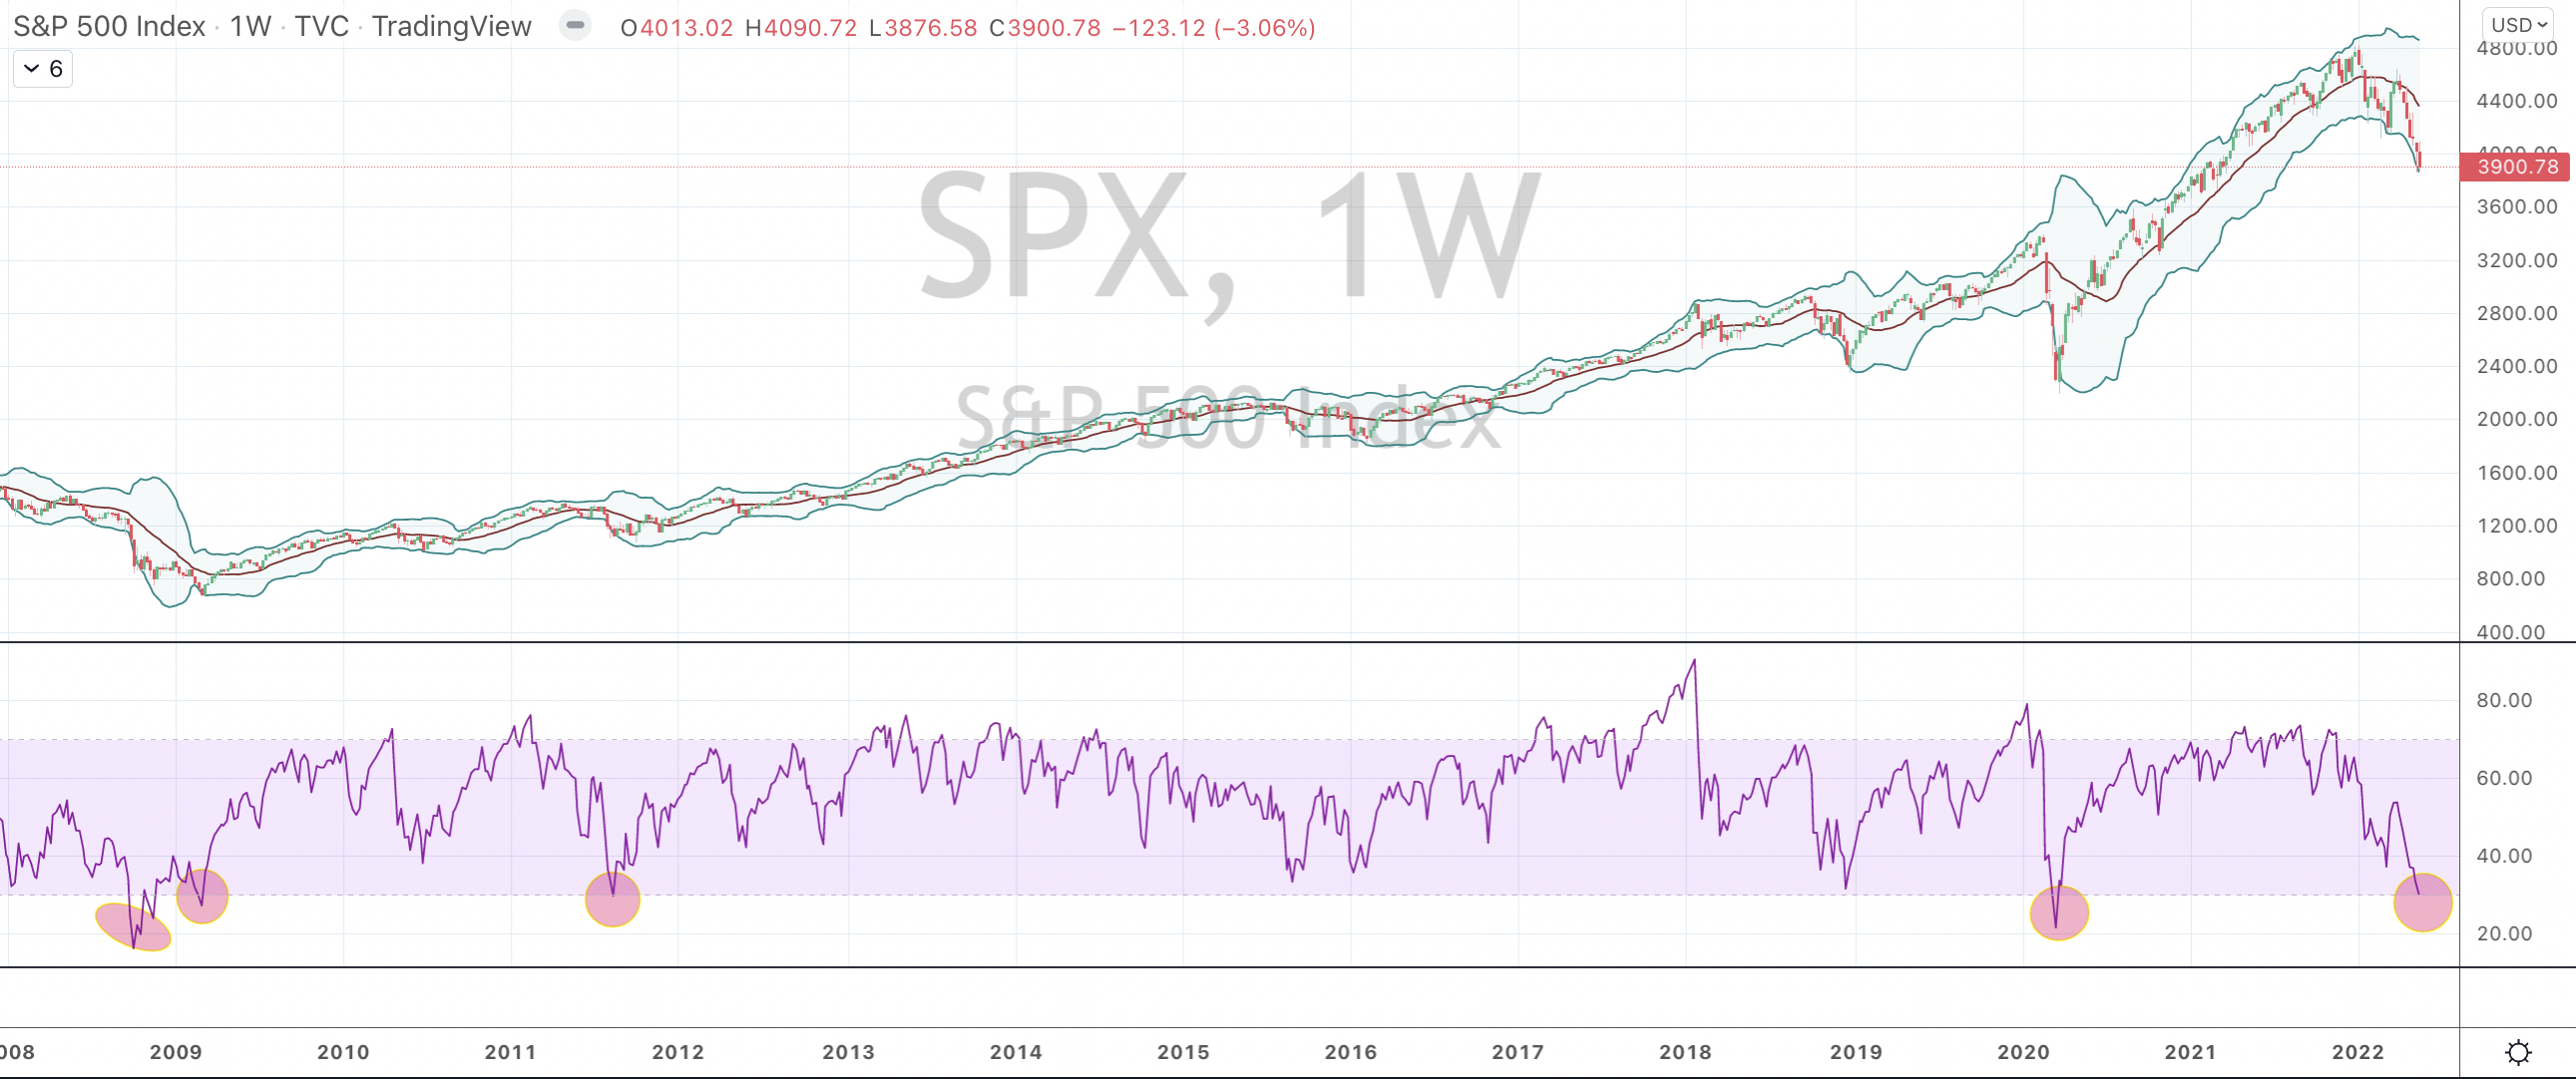
S&P 500
S&P 600 Small Cap
IDR/USD
Notes & Ideas:
The big news for the week is a competition between many bond yields are no longer at extreme highs and U.S. equity indices hitting Oversold extremes.
The bond yields have taken a break being Overbought and starting to consolidate lower. We’ve seen bond buyers being more aggressive which is FINALLY commensurate with pessimism in the equities universe.
In equities, some are seeing Oversold for the first time in 2 years or more.
News about that yield curve has gone quiet too. Since that spread hit my 0.40% initial target it has since flattened to 0.20% this week.
The CRB (commodities) Index remains overbought, for the 18th consecutive week.
Although the U.S. Dollar Index (DXY) is in its 6th consecutive week of ‘overboughtness’, the trend is waning because there are less currencies in recent weeks registering Oversold readings.
We saw the DXY fall 1.4% and the GBP an EUR rise 2% and 1.4% respectively.
The level of U.S. Dollar strength has been quite interesting to watch, especially as many called the death of the USD for various reasons with many relating to their ‘money printing’ thesis.
We saw strength in Asian and Nordic equity bourses, with the former being out favour for weeks prior when they were spending time being Unloved and Oversold.
Generally, there was less volatility across all asset classes and Crude Oil decline of 0.2% helped with that feeling.
But there are always pockets of movement.
Uranium has fallen 30% in 5 weeks,
The Baltic Dry Index (shipping costs) has soared 51% in the past 6 weeks and
Bitcoin fell again and has declined 45% over the past 8 weeks.
p.s. BTC is getting close to an Oversold extreme.
.
The larger advancers over the past week comprised of;
Baltic Dry Index 7.7%, Australian Coal 2.4%, Aluminium 5.5%, Rotterdam Coal 5.4%, China Coal 10.8%, Iron Ore 2.6%, Gold 1.9%, Hogs 8.1%, Copper 2.4%, Natural Gas 5.5%, Orange Juice 3.2%, Rubber 2.3%, Sugar 4.1%, Silver 3.2%, Soybean 3.6%, Shanghai 2%, CSI 300 2.2%, HSCEI 4.6%, Hang Seng 4.1%, IBEX 1.8%, Sensex 3%, Oslo 1.9%, Copenhagen 4.4%, TAEIX 2% and Australia’s ASX 200 rose 1%
The group of decliners included;
Gasoil (3.5%), Heating Oil (4.6%), Lumber (13.3%), LNG (3.3%), Tin (7.5%), Gasoline (3.1%), Cotton (2.2%), Dutch TTF Gas (9.3%), Uranium (7%), Bitcoin (6.3%), Ethereum (8%), GBTC (4.9%), Cardano (11.9%), DJ Transports (6.7%), Dow Jones Industrials (2.9%), Midcap 400 (1.9%), SMI (2.9%), SOX (3%), S&P 500 (3.1%) and the Nasdaq Transportation Index slumped (5%)
May 22, 2022
by Rob Zdravevski
rob@karriasset.com.au