A different look at the Nasdaq
May 21, 2022 Leave a comment
Lately, my posts (see links below) about equity indices hitting weekly Oversold levels has highlighted moments when the Relative Strength Index (RSI) has ventured below the ’30’ mark.
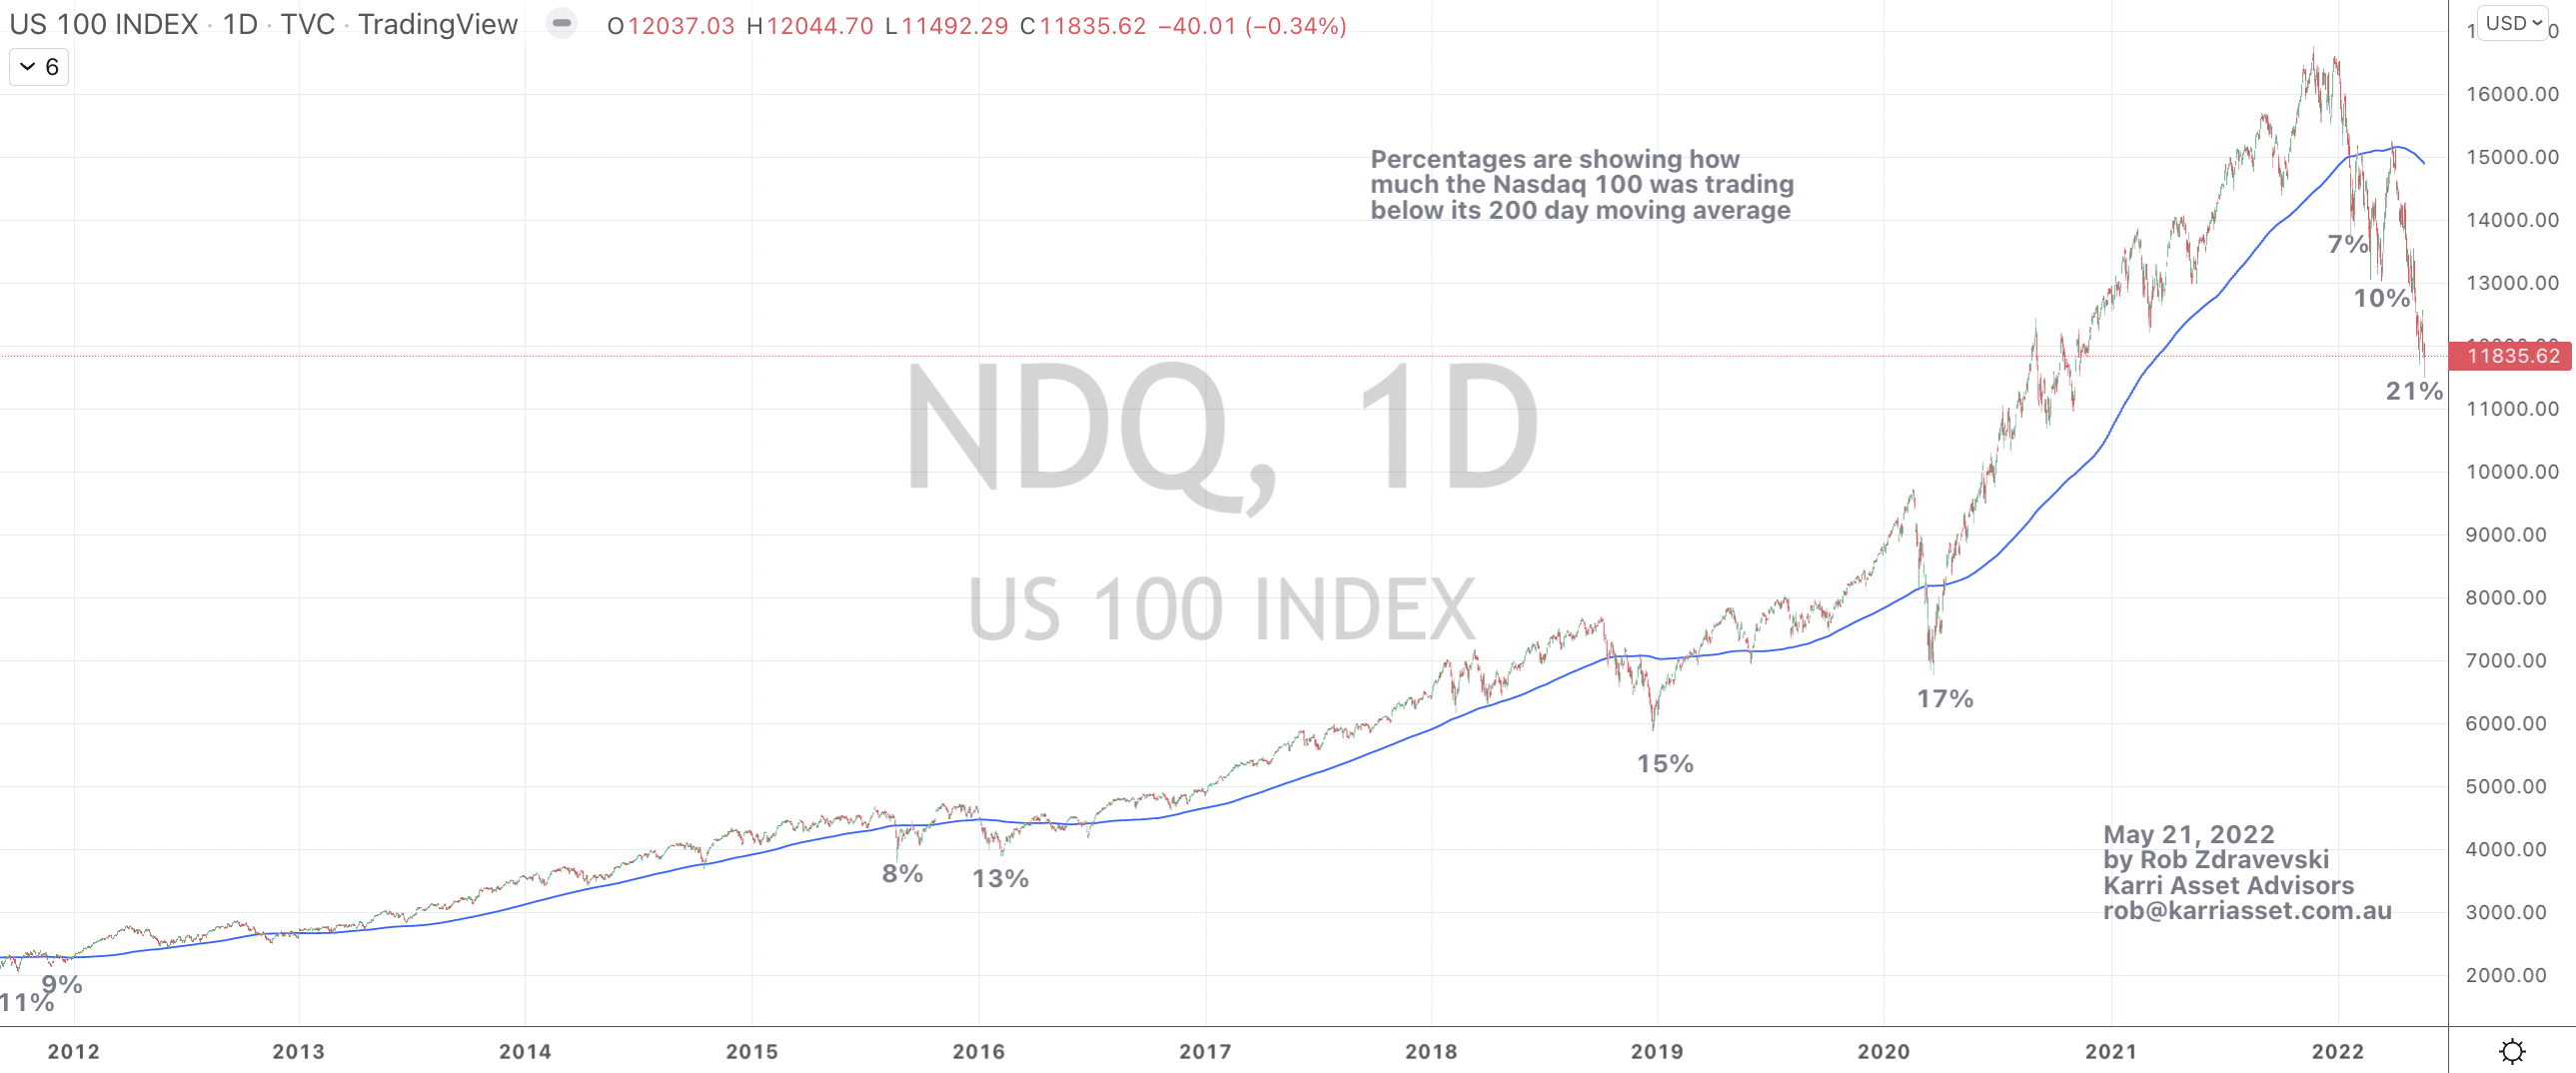
The chart below takes us to a more tactical look using a ‘nearer-term’ daily timeframe rather than my usually ‘mid-term’ weekly outlook.
It illustrates the percentage at which the Nasdaq 100 is trading below its 200 DAY moving average.
I think readers will see the case I am making and where probabilities lie.
May 21, 2022
by Rob Zdravevski
rob@karriasset.com.au