August 4, 2022 – Perth’s office vacancy rate has grown to 15.8 per cent in the past six months, up 0.8 per cent since January…6 months earlier, the news was that vacancy rates had fallen.
3 Feb 2022 — Perth’s CBD office vacancy rate has fallen to 15 per cent. Perth’s CBD office vacancy has fallen in the past six months but is the second …and previously we read;
5 Aug 2021 — Vacancy rates also improved across Perth office markets…
1 June 2021 — The real Perth CBD office vacancy rate is closer to 15% when the level of static vacancy and buildings which are about to be withdrawn from .. Does 15% or 15.8% really matter.
It’s a real shame that news stories don’t continue to elaborate that Perth has the nations highest proportion of C & D grade buildings which doesn’t help the numbers when reporting on “prime CBD properties”.
I’d like to see what the vacancy rates are for Class A & B buildings.
In July 2021, I wrote this note as Calgary saw office vacancy rates hit 24%.
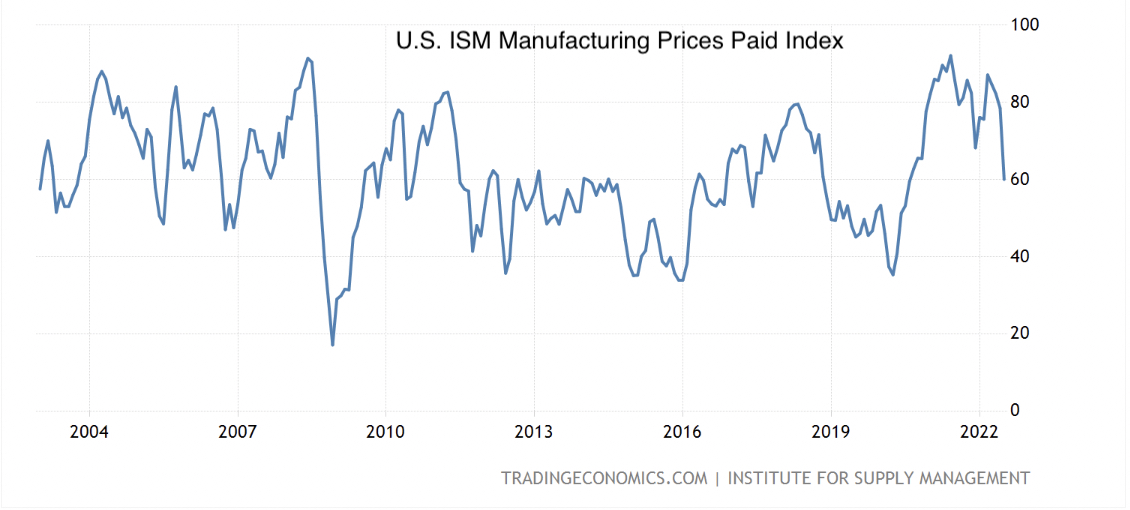
The ISM Manufacturing Price Paid Index is a leading indicator.
The overnight release of the July 2022 data shows the index falling 24% from the previous month.
It reflects a change in prices paid by industry representatives for the products or services they receive.
It’s a monthly survey of supply managers from 18 U.S. industries where respondents estimate prices paid in the production process: whether they have grown, fallen or have not changed.
In my recent posts, I’ve been highlighting the decline in commodity prices is/will lead to lower input prices,
“It’s also the start of an odd period where higher prices of finished goods (due to the higher price paid by buyers of raw/base/industrial commodities) may be left on the shelf.
Rising prices have been evident but we can’t assume that higher prices are automatically paid for.”
So there is your picture.
Prices rose to a point where buyers walk away and when they saw producers scrambling to secure materials, one can predict that inventories will rise.
Now that material prices have fallen by 30% or more, buyers can source product from those who have acquired (and worked) their materials at the current lower prices.
Additionally, those higher priced inventories will eventually need to be discounted in order to generate cashflow and reduce their stock which is tying up working capital.
And thus survey respondents are either buying product at cheaper prices than earlier in the year or can expect lower prices in the near future.
My work suggests that this ‘trading’ bounce in many markets, assets and securities may see an end in the first couple days of the coming week.
The recent market advance has been a combination of a ‘bounce’ occurring once prices satisfied a host of mean reversions and extremes, coupled with notable pessimism and bearish investor readings along with short covering and ‘benchmarking’.
Because when mature, large index weighted Goliath’s such as Apple and Amazon rise 20% over a 4 week span, benchmarked money managers need to buy (chase) those and other stocks which are trending higher, in order to stay close to the index returns and the performance of their competitors.
Many fund managers have expressed a view to me over many years, similar to, “it sucks being benchmarked”.
But if you did benefit from the ‘fat part of the trade, let’s sell and pack up for the rest of the year and go on holiday?
After all, that is more than a year’s adequate return all within 30 days.
Alas! Many of us won’t do that. It wouldn’t be fun (sic) until we squandered half of those gains, which then keeps us at the table for the rest of the year.
In all seriousness, there are many gap-up’s that markets will back and fill.
The setup in the weeks ahead should be a safer moment to accumulate for those longer-term investors.
The following assets (on a weekly timeframe) registered an Overbought or Oversold reading and/or have traded more than 2.5 standard deviations above or below its rolling mean.
Extremes “above” the Mean (at least 2.5 standard deviations)
None
Overbought (RSI > 70)
None
The Overbought Quinella – Both Overbought and Traded at > 2.5 standard deviations above the weekly mean)
None
Extremes “below” the Mean (at least 2.5 standard deviations)
Japanese government 10 year bond yield
Sugar
Oversold (RSI < 30)
U.S. 10 year minus U.S. 5 year government bond yield
U.S. 5 year minus 3 month government bond yield
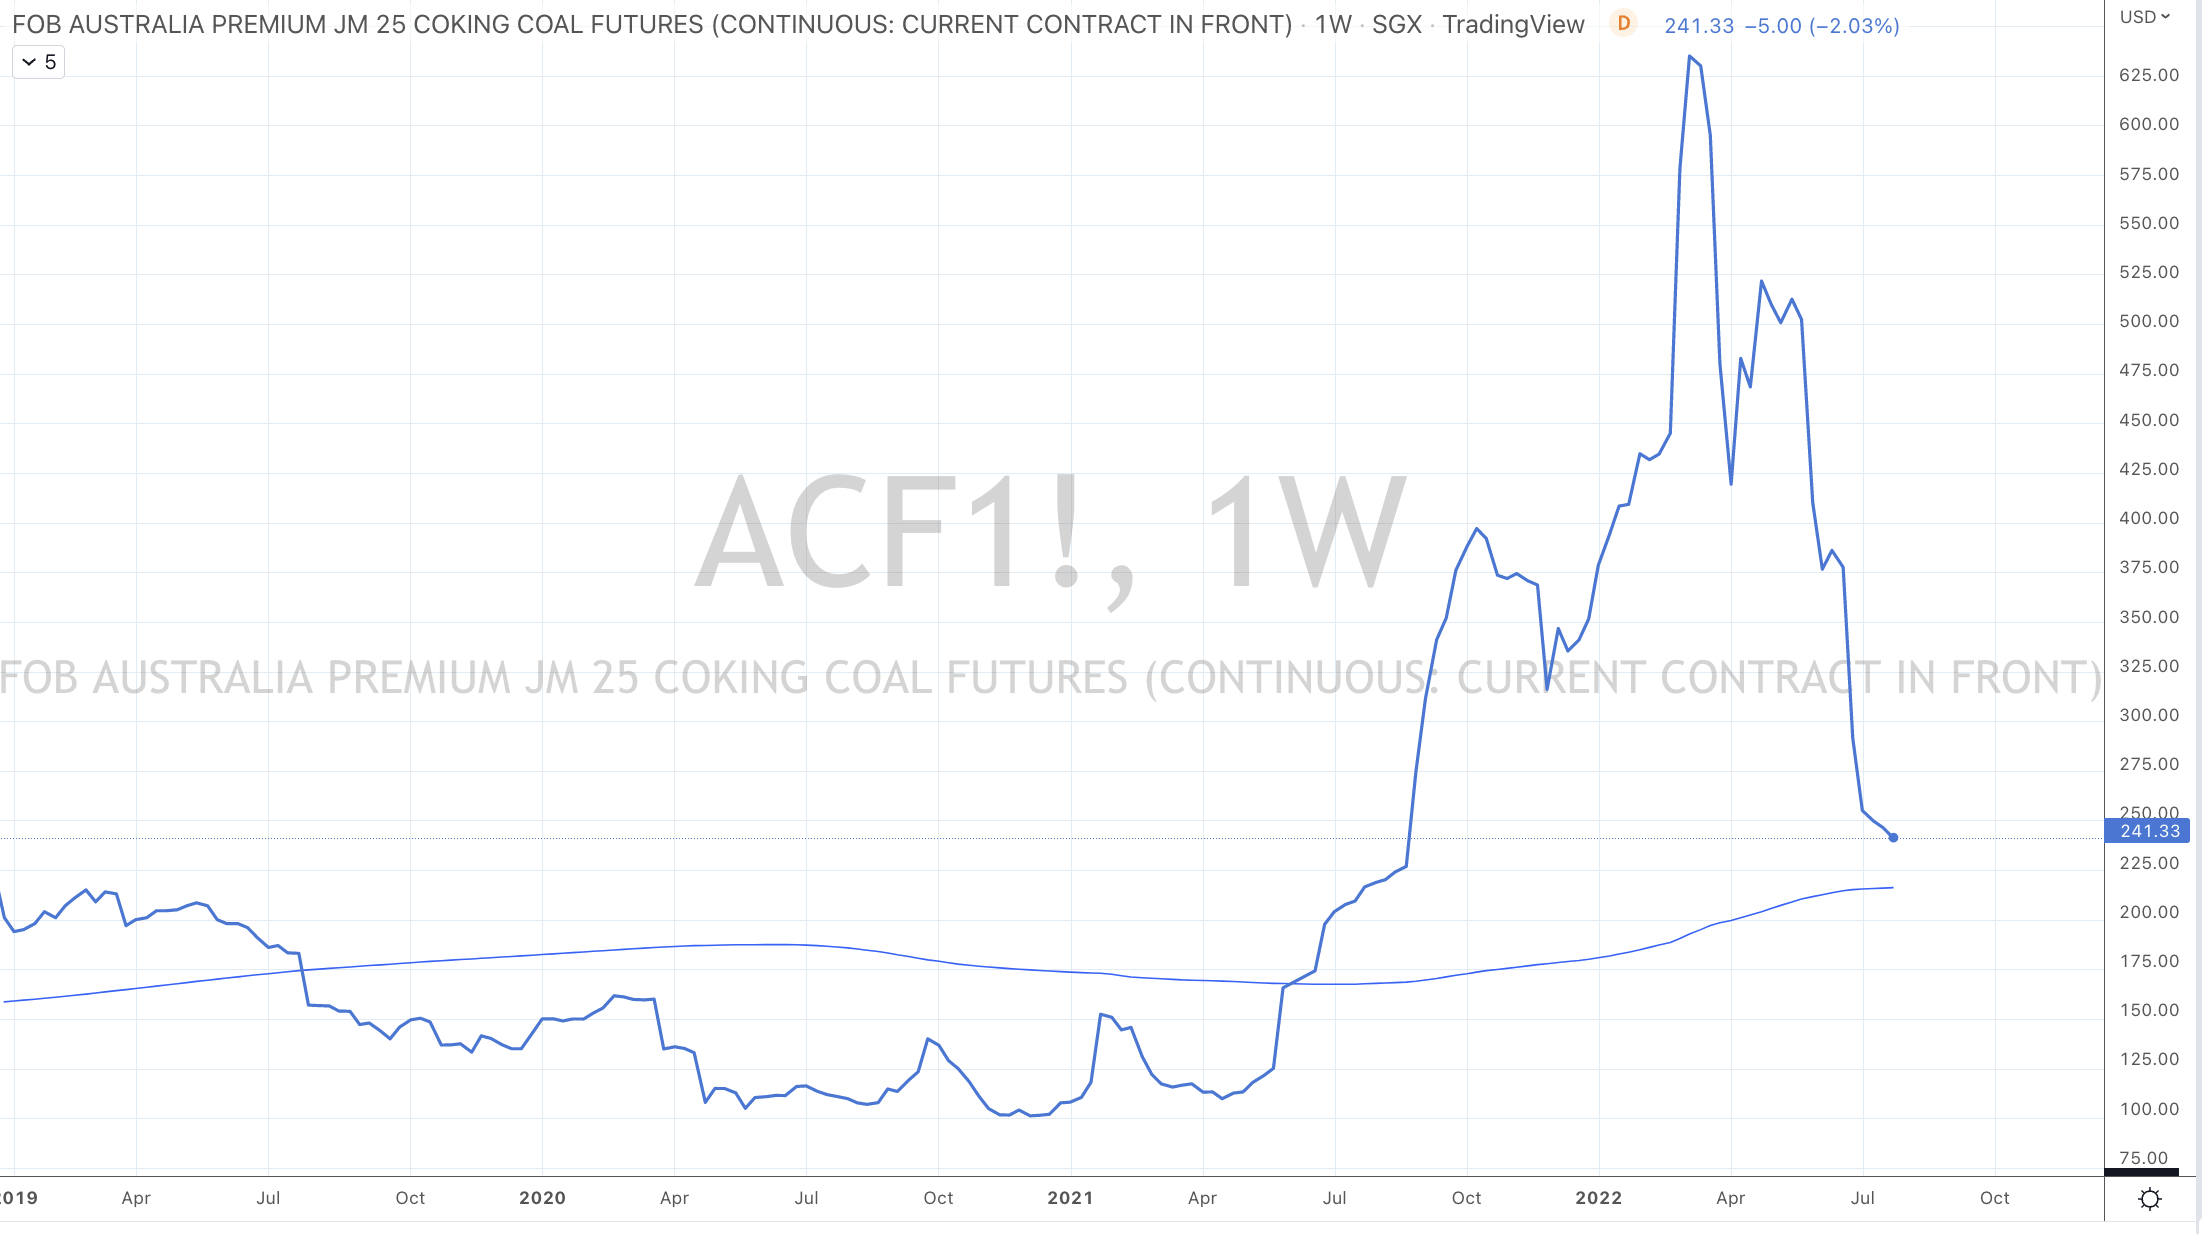
Australian Coking Coal (it also reverted to its 200 week moving average)
Hot Rolled Coiled Steel
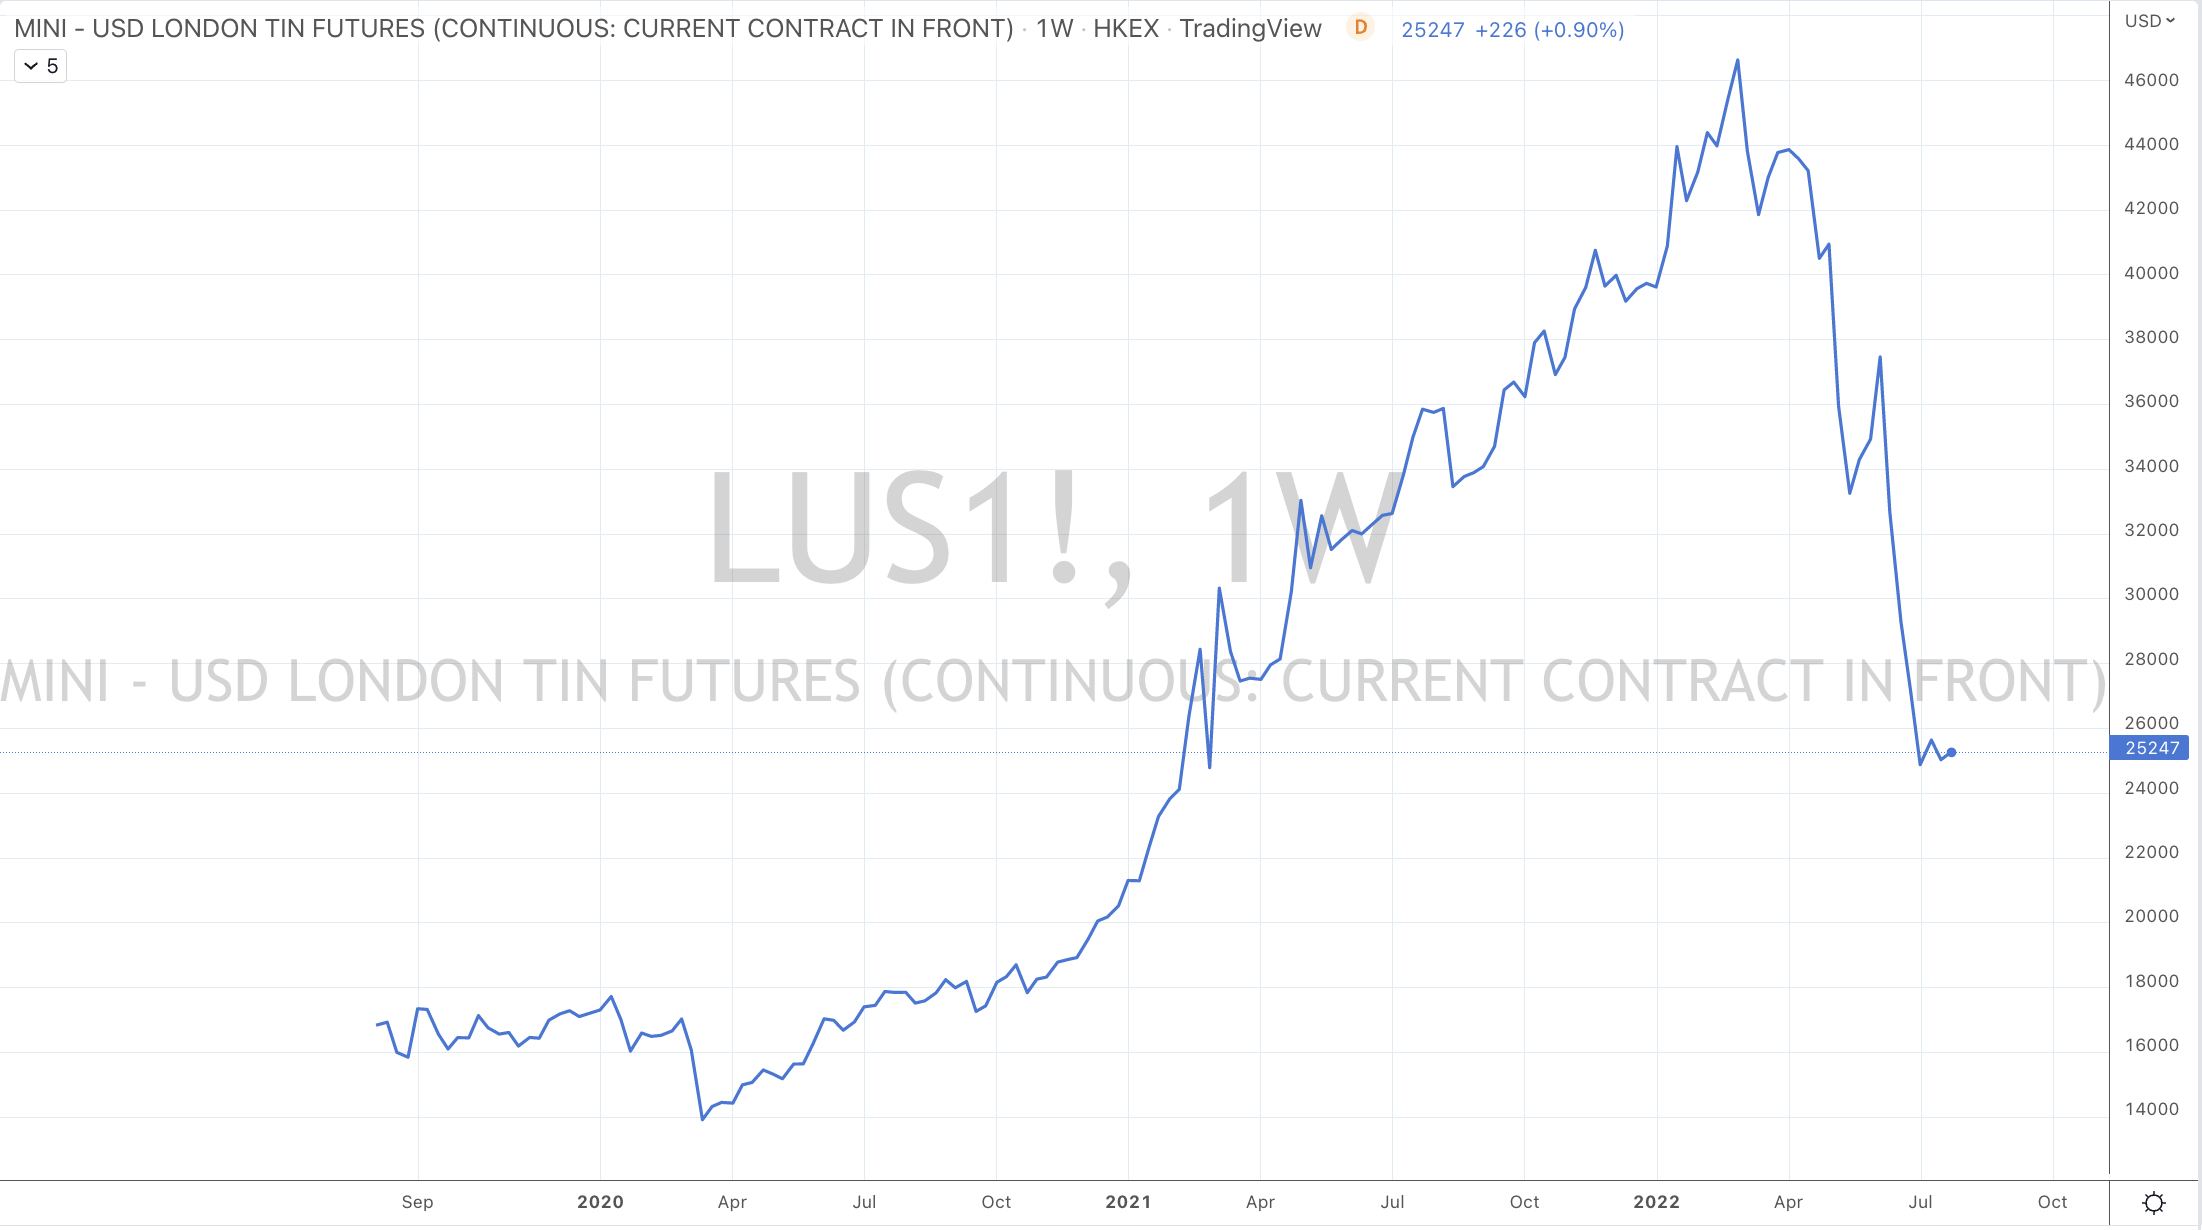
Tin
The Oversold Quinella – Both Overbought and Traded at > 2.5 standard deviations above the weekly mean)
None
Notes & Ideas:
This past week’s big news was the continued and stronger rally in equities and the notable absence of oversold commodities and currencies from the list. They have all ventured away from their recent ‘extremes’.
The list below highlights those with the larger weekly percentage rates of change.
Extreme measures were telling us to expect a bounce. Recent editions of ‘Macro Extremes’ and my blog posts flagged oversold extreme lows in various equity indices (and some commodities and currencies) since June 13, 2022.
In fact, last week’s ‘Macro Extremes’ re-visited that point.
Those equity indices have risen between 6% and 15% over the past 6 weeks.
Some examples include Amsterdam’s AEX rise of 13%, the Russell 2000, Nasdaq and MidCap 400 have risen in the vicinity of 14% while Switzerland’s SMI and Australia’s ASX 200 have improved 7%.
Specific stocks have been more impressive. Rockwell Automation and Nucor have risen 25% in only 4 weeks.
I also found it interesting that the Nasdaq Biotech Index only rose 0.2% for the week. Although that index is 17% above its mid- June low, it has eased 4% from its recent high, 3 weeks ago.
My work suggests that this ‘trading’ bounce in many markets, assets and securities may see an end in the first couple days of the coming week.
The recent market advance has been a combination of a ‘bounce’ occurring once prices satisfied a host of mean reversions and extremes, coupled with notable pessimism and bearish investor readings along with short covering and ‘benchmarking’.
Because when mature, large index weighted Goliath’s such as Apple and Amazon rise 20% over a 4 week span, benchmarked money managers need to buy (chase) those and other stocks which are trending higher, in order to stay close to the index returns and the performance of their competitors.
Many fund managers have expressed a view to me over many years, similar to, “it sucks being benchmarked”.
But if you did benefit from the ‘fat part of the trade, let’s sell and pack up for the rest of the year and go on holiday?
After all, that is more than a year’s adequate return all within 30 days.
Alas! Many of us won’t do that. It wouldn’t be fun (sic) until we squandered half of those gains, which then keeps us at the table for the rest of the year.
In all seriousness, there are many gap-up’s that markets will back and fill.
The setup in the weeks ahead should be a safer moment to accumulate for those longer-term investors.
The U.S. yield curve remains inverted for the 5th week in a row and oversold for 3 consecutive weeks while the U.S. 5 year minus 3 month yield spread also remain oversold.
I’ve also got some work do in the LNG and Gas market this week. Specifically, the Dutch TTF Gas price rose 20% on the week and now has seen a 130% rise (from EUR 83 to EUR 191) over the past 7 weeks.
Incidentally, Brent Crude Oil eked a gain of only 0.03% which is a contrast to other rallies in the energy complex.
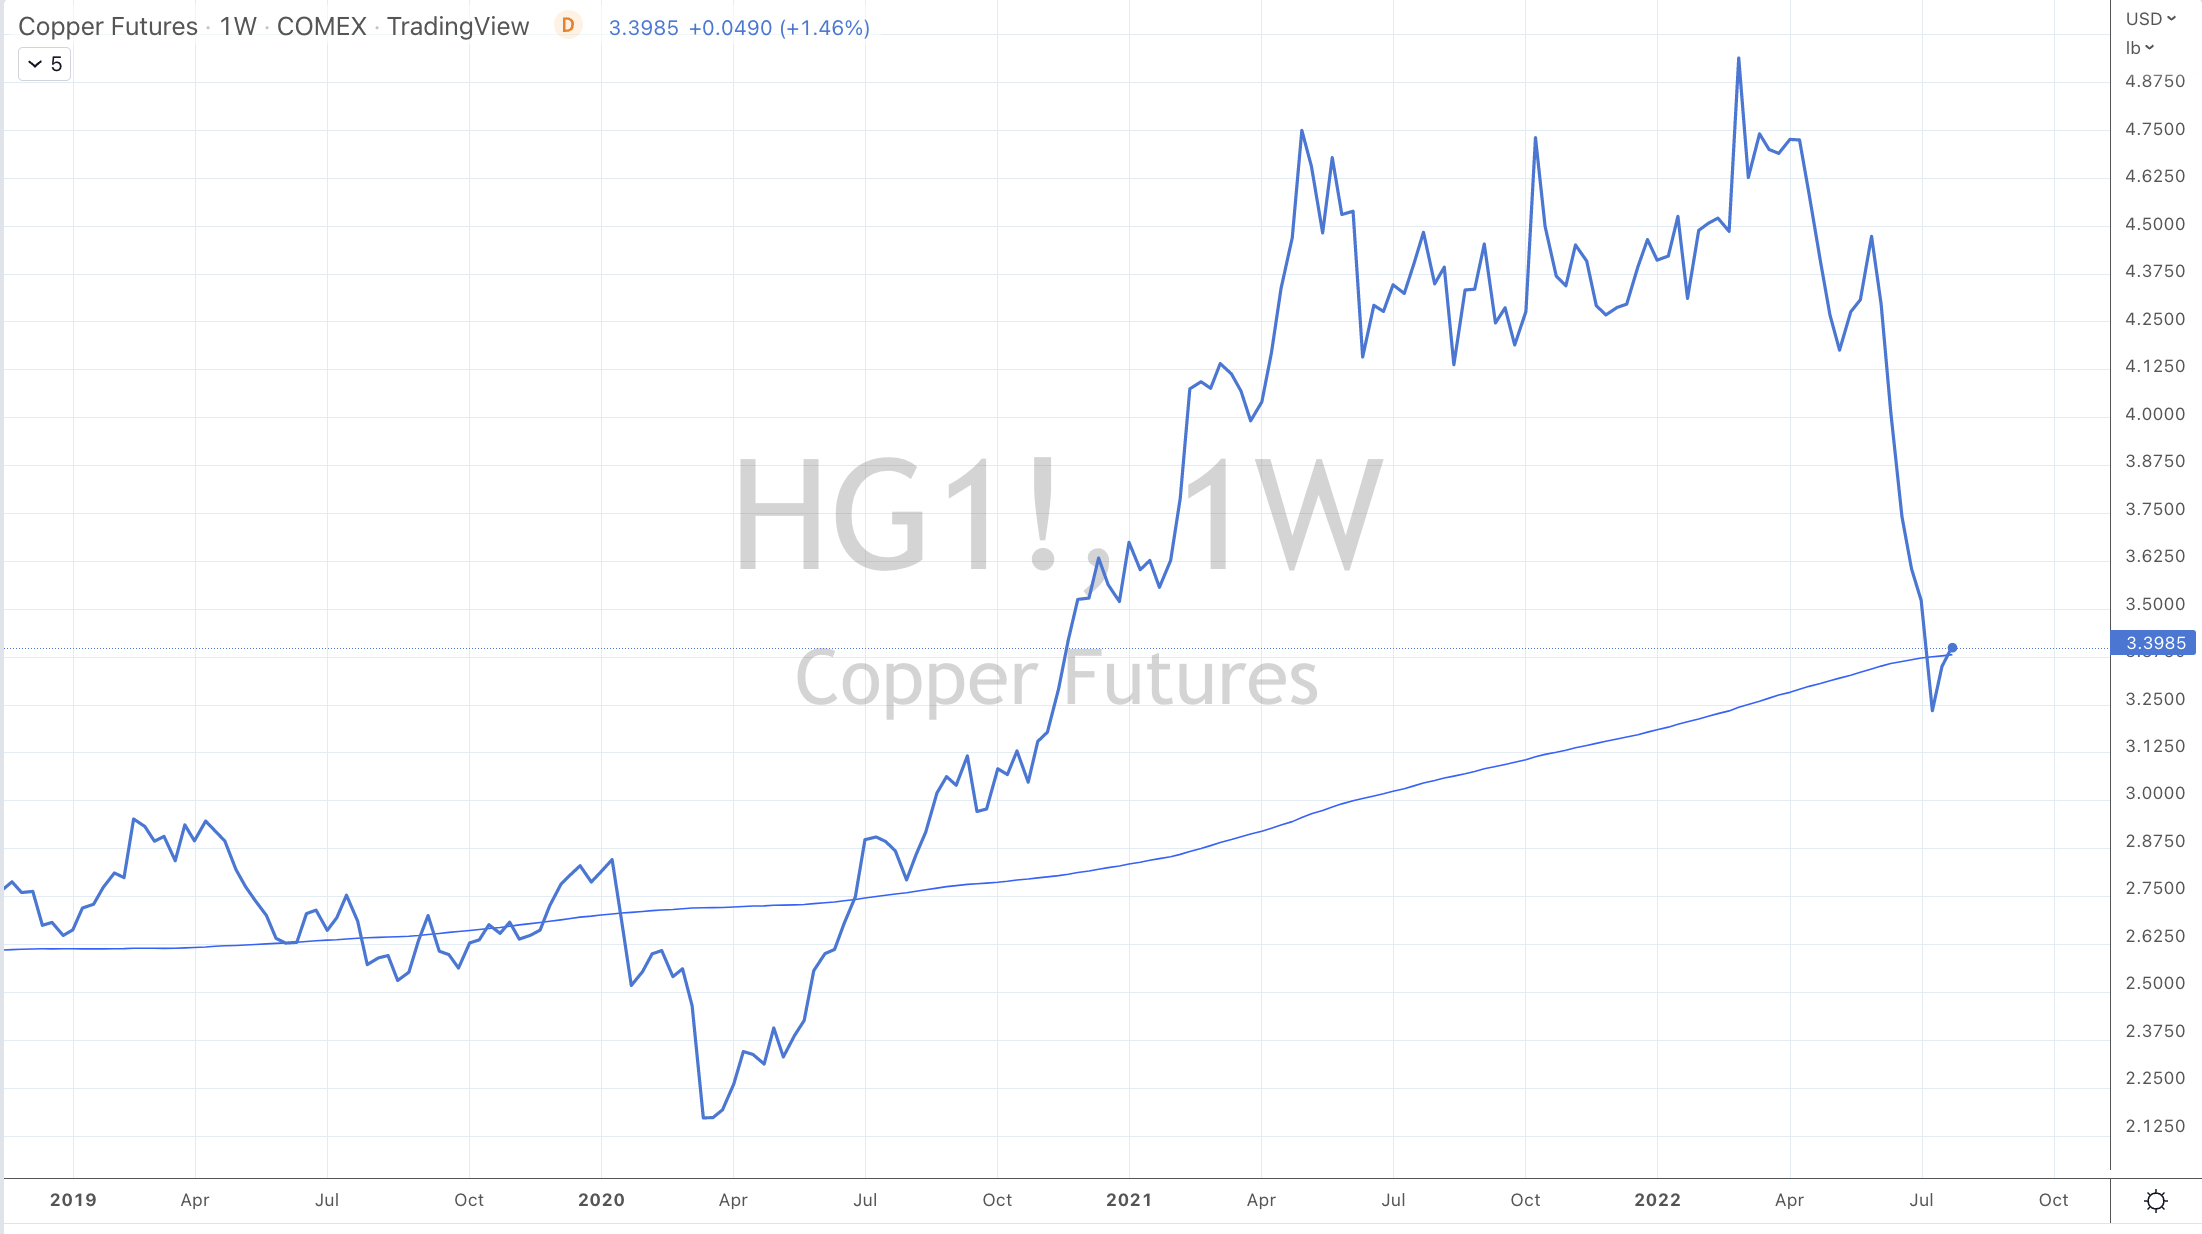
While Copper and Silver rose 7% and 9% respectively for the week, after being entrants in the previous week’s oversold categories. Copper has risen 13% from its fortnight intra-day low.
Furthermore, during the week, the AUD Silver reached my Buy price of $26.50. It closed Friday’s trading 10% higher at $29.12.
In currency land, the Chilean Peso strengthened 5.2% (I’ll write about that later in terms of a Copper trade) and the Japanese Yen firmed 2% against the USD, which added to last week’s 2% rise.
Bond yields continue to fall meaning that the bond buyers were the more aggressive, as yields are other longer journey to mean revering.
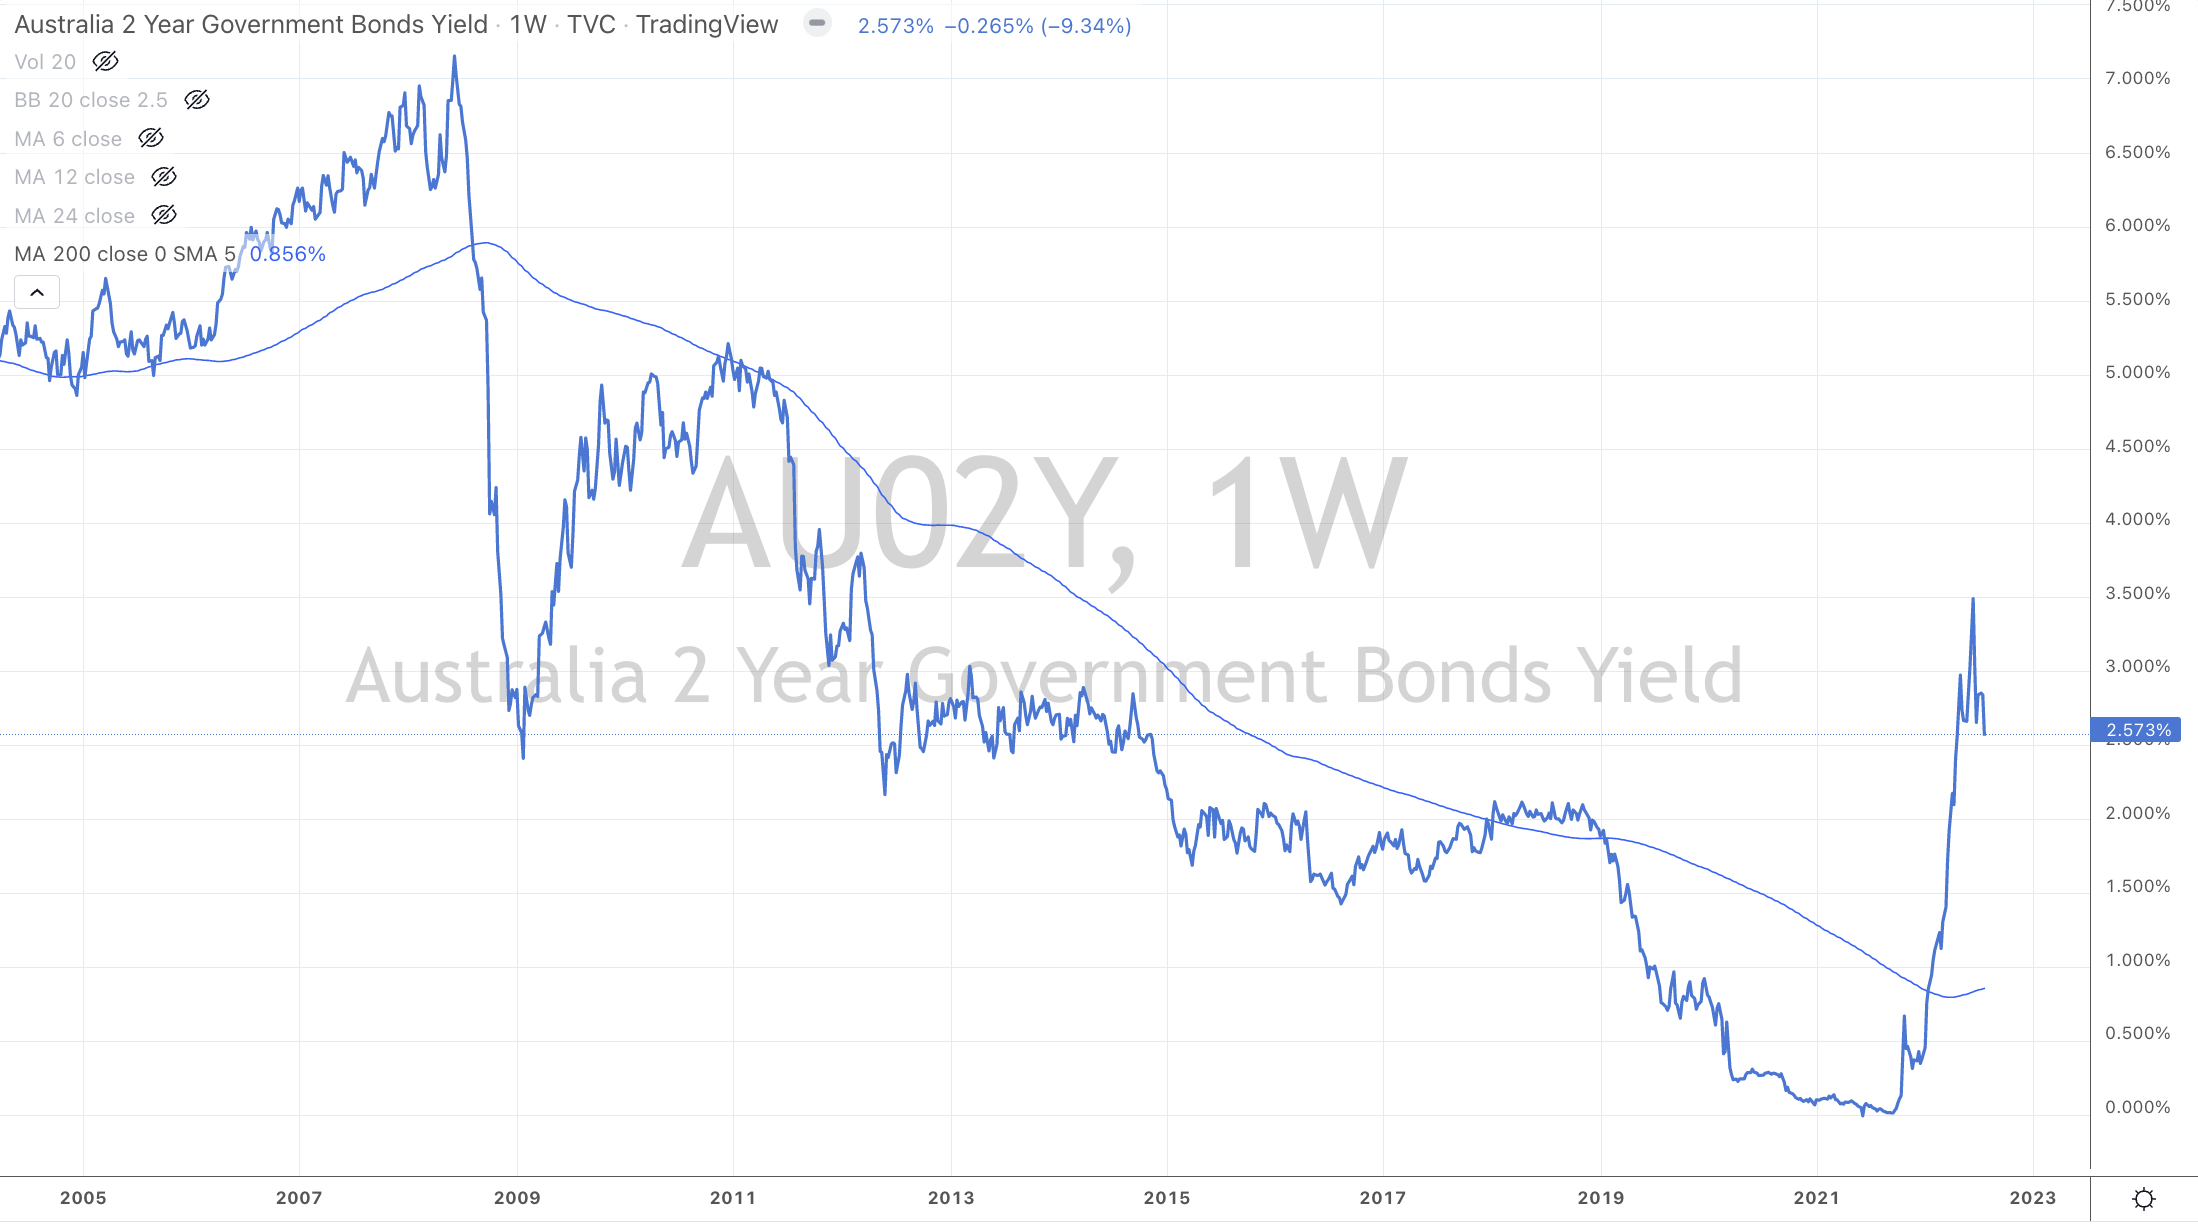
For example, the Australian 2 year bond yield has fallen from 3.60% in the past 4 weeks to 2.57%. I think, it’s plausible that it works its way down to the 1.55% mark over the coming months.
More on this in an another note which will be based on the higher probability of sharper retracements and mean reversions being seen following parabolic price moves.
Since those lows in equities around June 13-16, 2022, we have seen a peak in bond yields such as the French 10’s declining from 2.48% to 1.39% and the German 2’s have fallen from 1.30% to 0.27%.
What if the German 2’s or the Swiss 10’s go back to a negative yield?
Good for technology stocks perhaps?
While a major ‘short trade’ in government bonds has made many a sizeable fortune over the past 18 months, staying ‘short forever’ has also become known as the ‘widow maker trade’ where many have lost fortunes especially in the case of shorting Japanese 10 year bonds.
A possible or ‘pending’ mean reversion in bond yields is bigger deal than the one currently occurring in the equity market. I feel a seperate blog post is required for this topic.
The larger advancers over the past week comprised of;
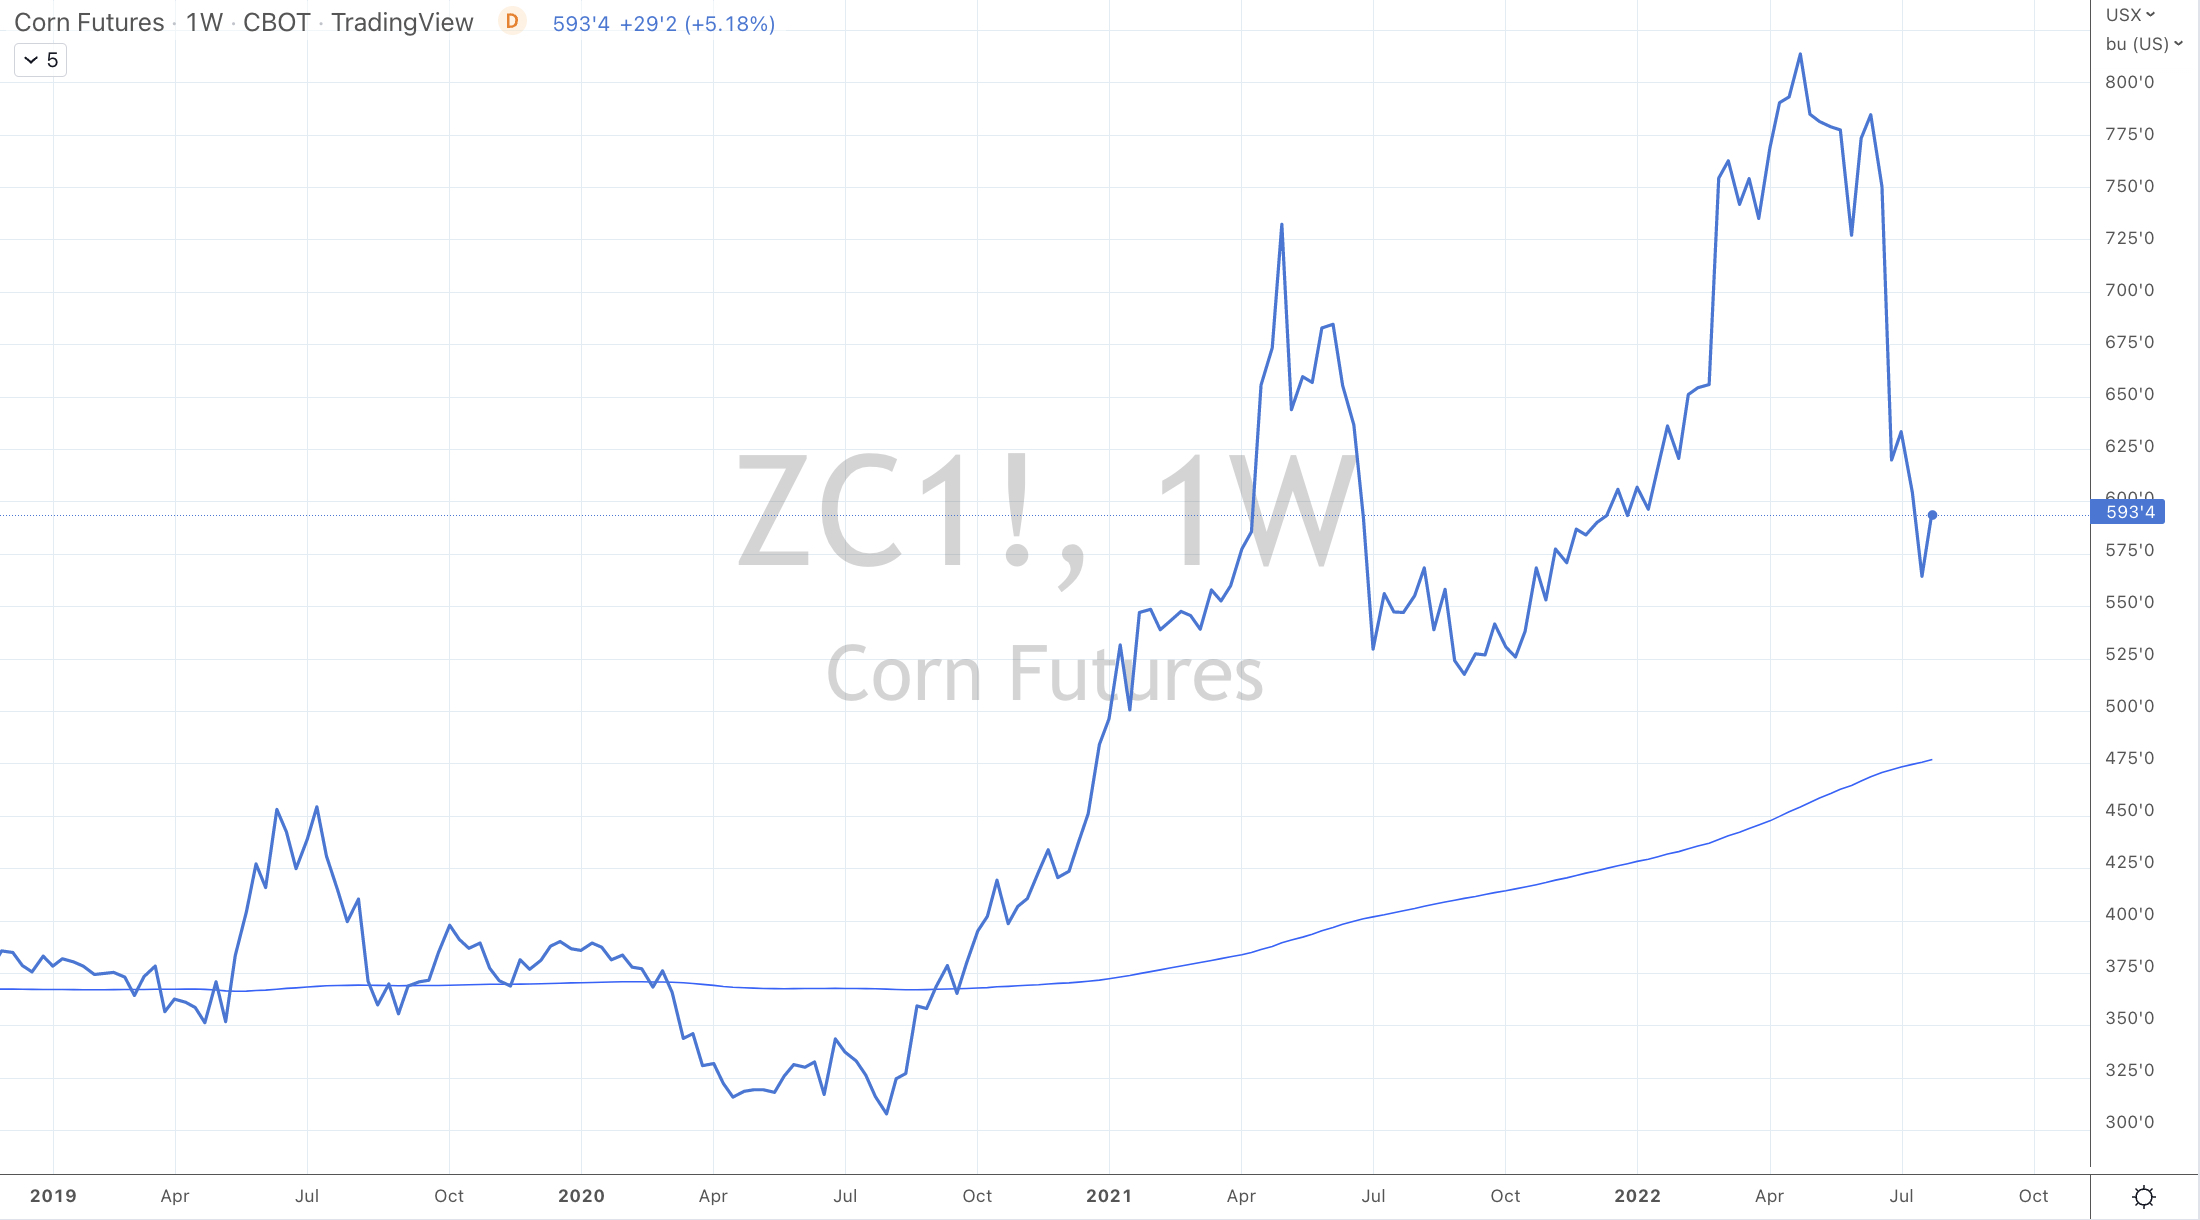
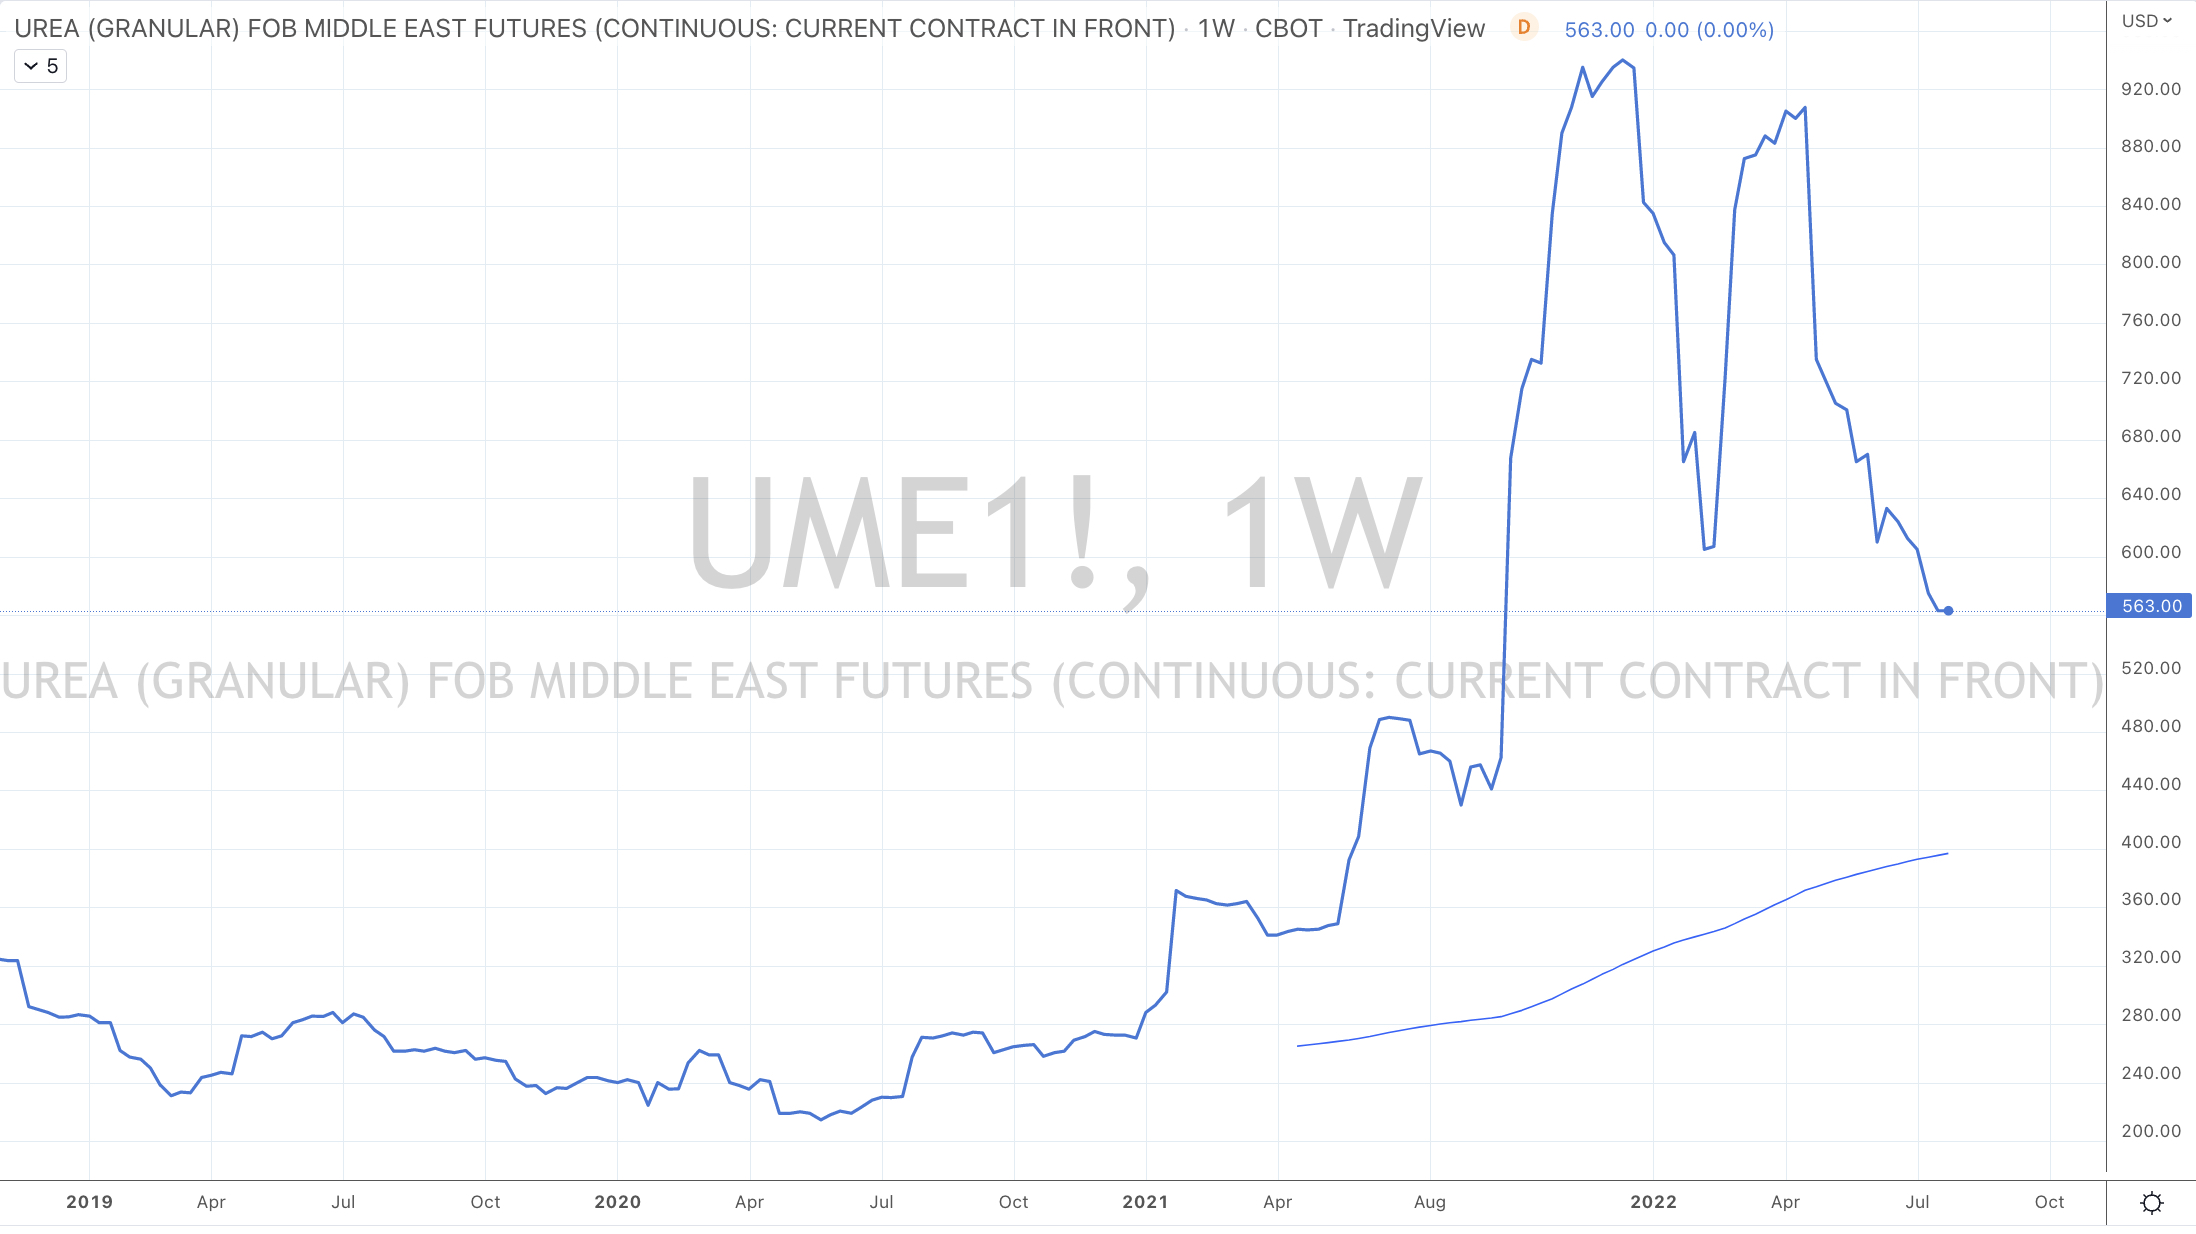
Bloomberg Commodity Index 4.6%, WTI Crude Oil 4.1%, Gasoil 3.7%, Gold 3.2%, Copper 6.7%, JKM LNG 7.5%, Coffee 3.5%, Heating Oil 4.9%, JKM LNG 8.3%, Coffee 5.1%, Orange Juice 12.5%, Palladium 5.5%, Platinum 2.6%, Silver 8.5%, CRB Index 3.9%, Cotton 3.7%, Dutch TTF Gas 19.4%, Urea Florida Gulf 16.4%, Urea Middle East 19.9%, Silver in AUD 8.4%, Silver in USD 9.4%, Corn 9.2%, Oats 2.8%, Soybeans 11.6%, Wheat 6.4%, AEX 3.5%, KBW Banks 2.2%, CAC 3.7%, DAX 1.7%, Dow Jones Industrials 3%, DJ Transports 5.8%, MIB 5.6%, Bovespa 4.3%, MOEX 5.6%, Kospi 2.4%, S&P MidCap 400 4.9%, Nasdaq 100 4.5%, Sensex 2.6%, Oslo 4.1%, Copenhagen 3.1%, Helsinki 3%, Stockholm 2.7%, Russell 2000 4.3%, SOX 4.4%, S&P 500 4.3%, FTSE 100 2%, Australia’s ASX 200 2.3%, Istanbul 2.3%, Toronto’s TSX 3.7%, S&P SmallCap 600 4.7% and the Nasdaq Composite soared 4.7%.
The group of decliners included;
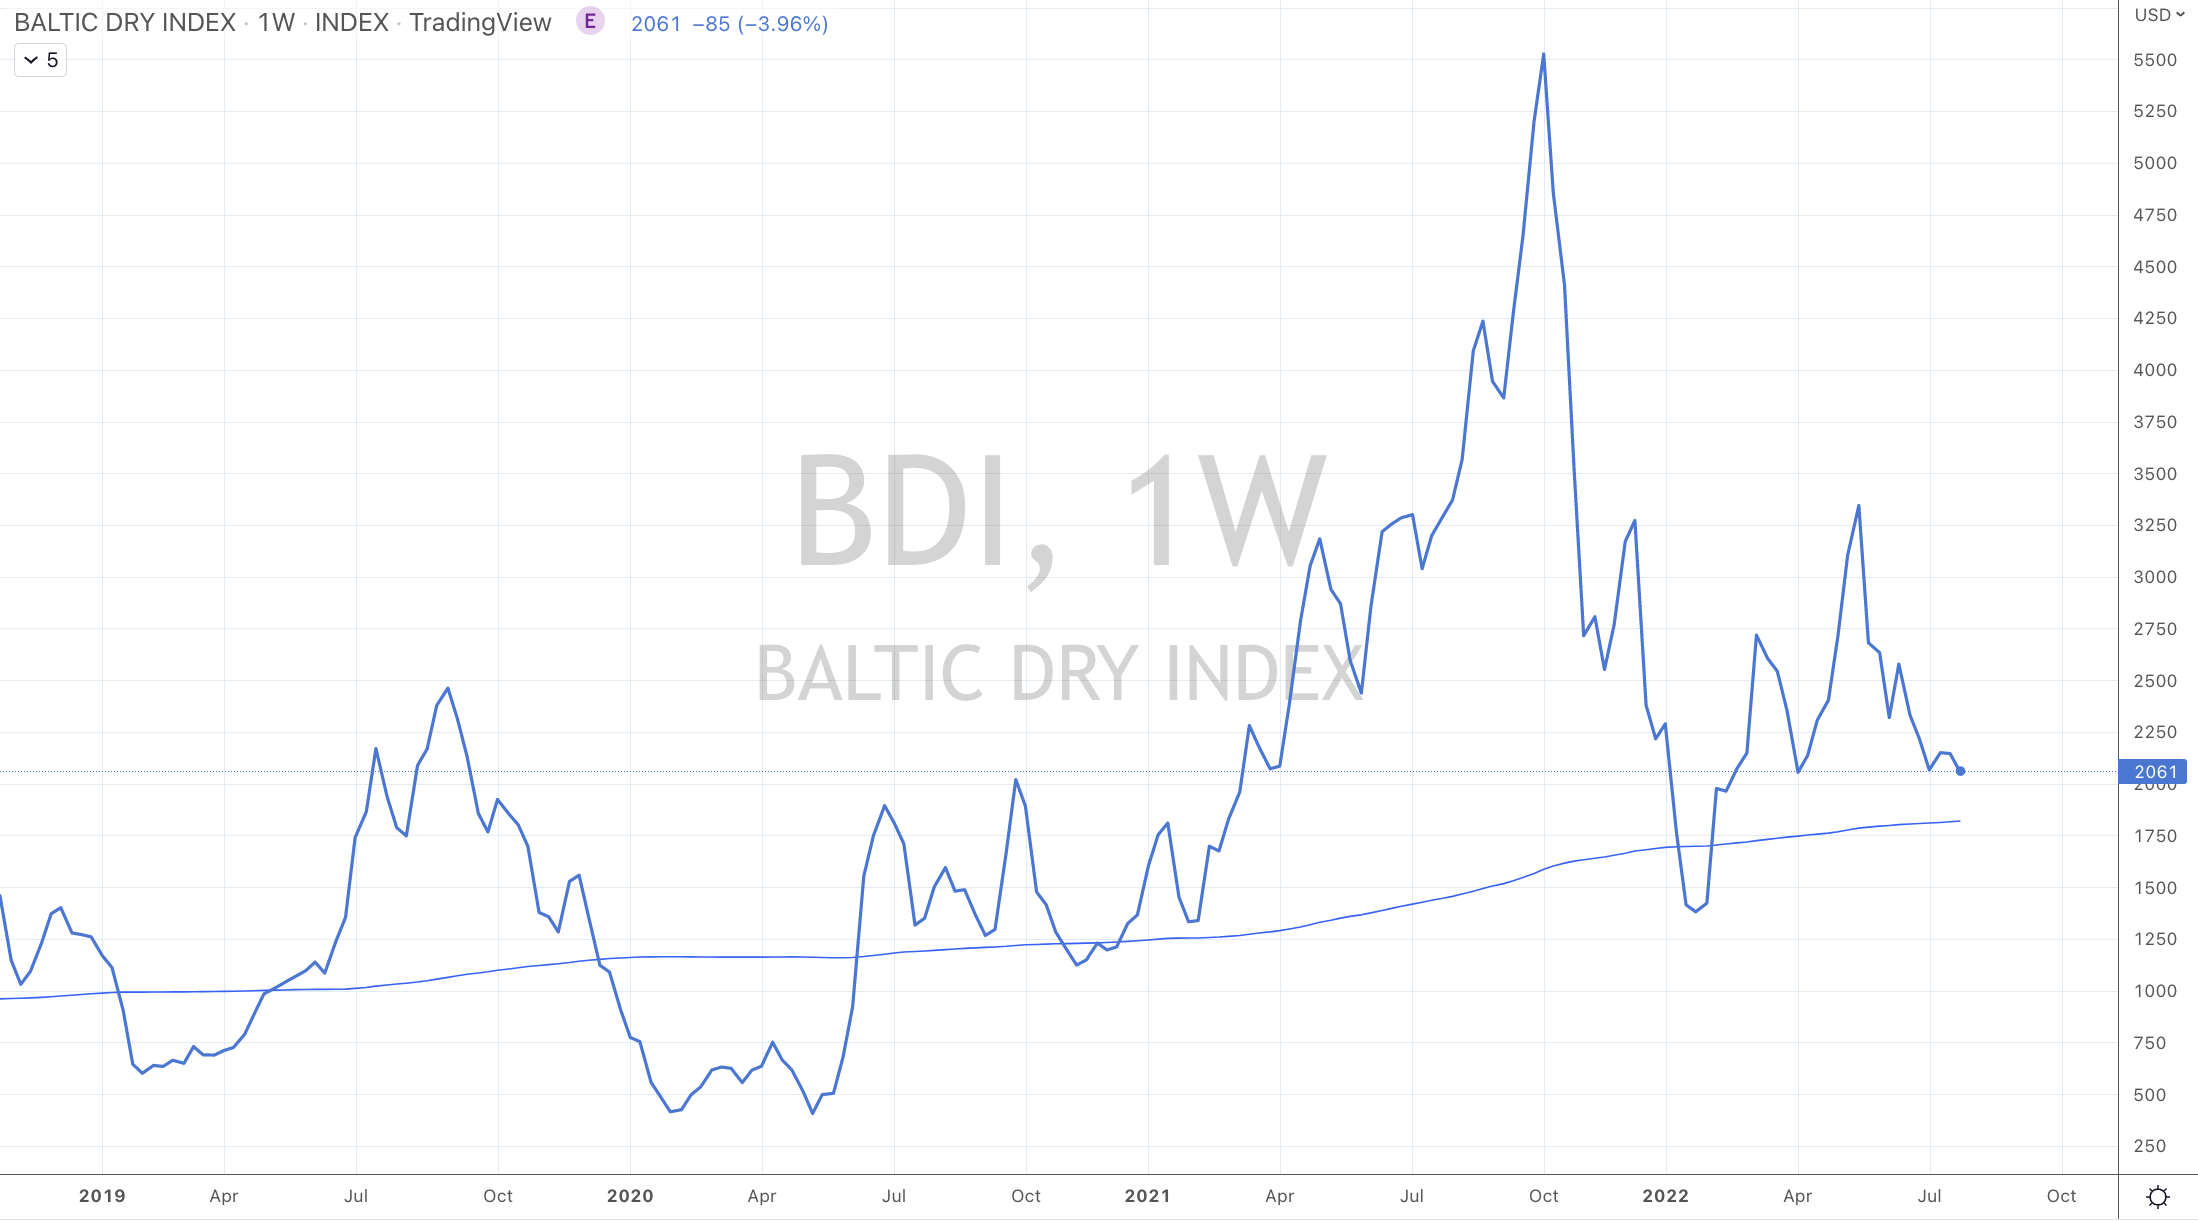
Australian Coking Coal (19.2%), Baltic Dry Index (11.7%), Hot Rolled Coiled Steel (7.4%), Lumber (9.9%), LNG (6.6%), Gasoline (3.4%), Sugar (2%), CSI 300 (1.6%), HSCEI (3.1%) and the Hang Seng Index fell 2.2%.
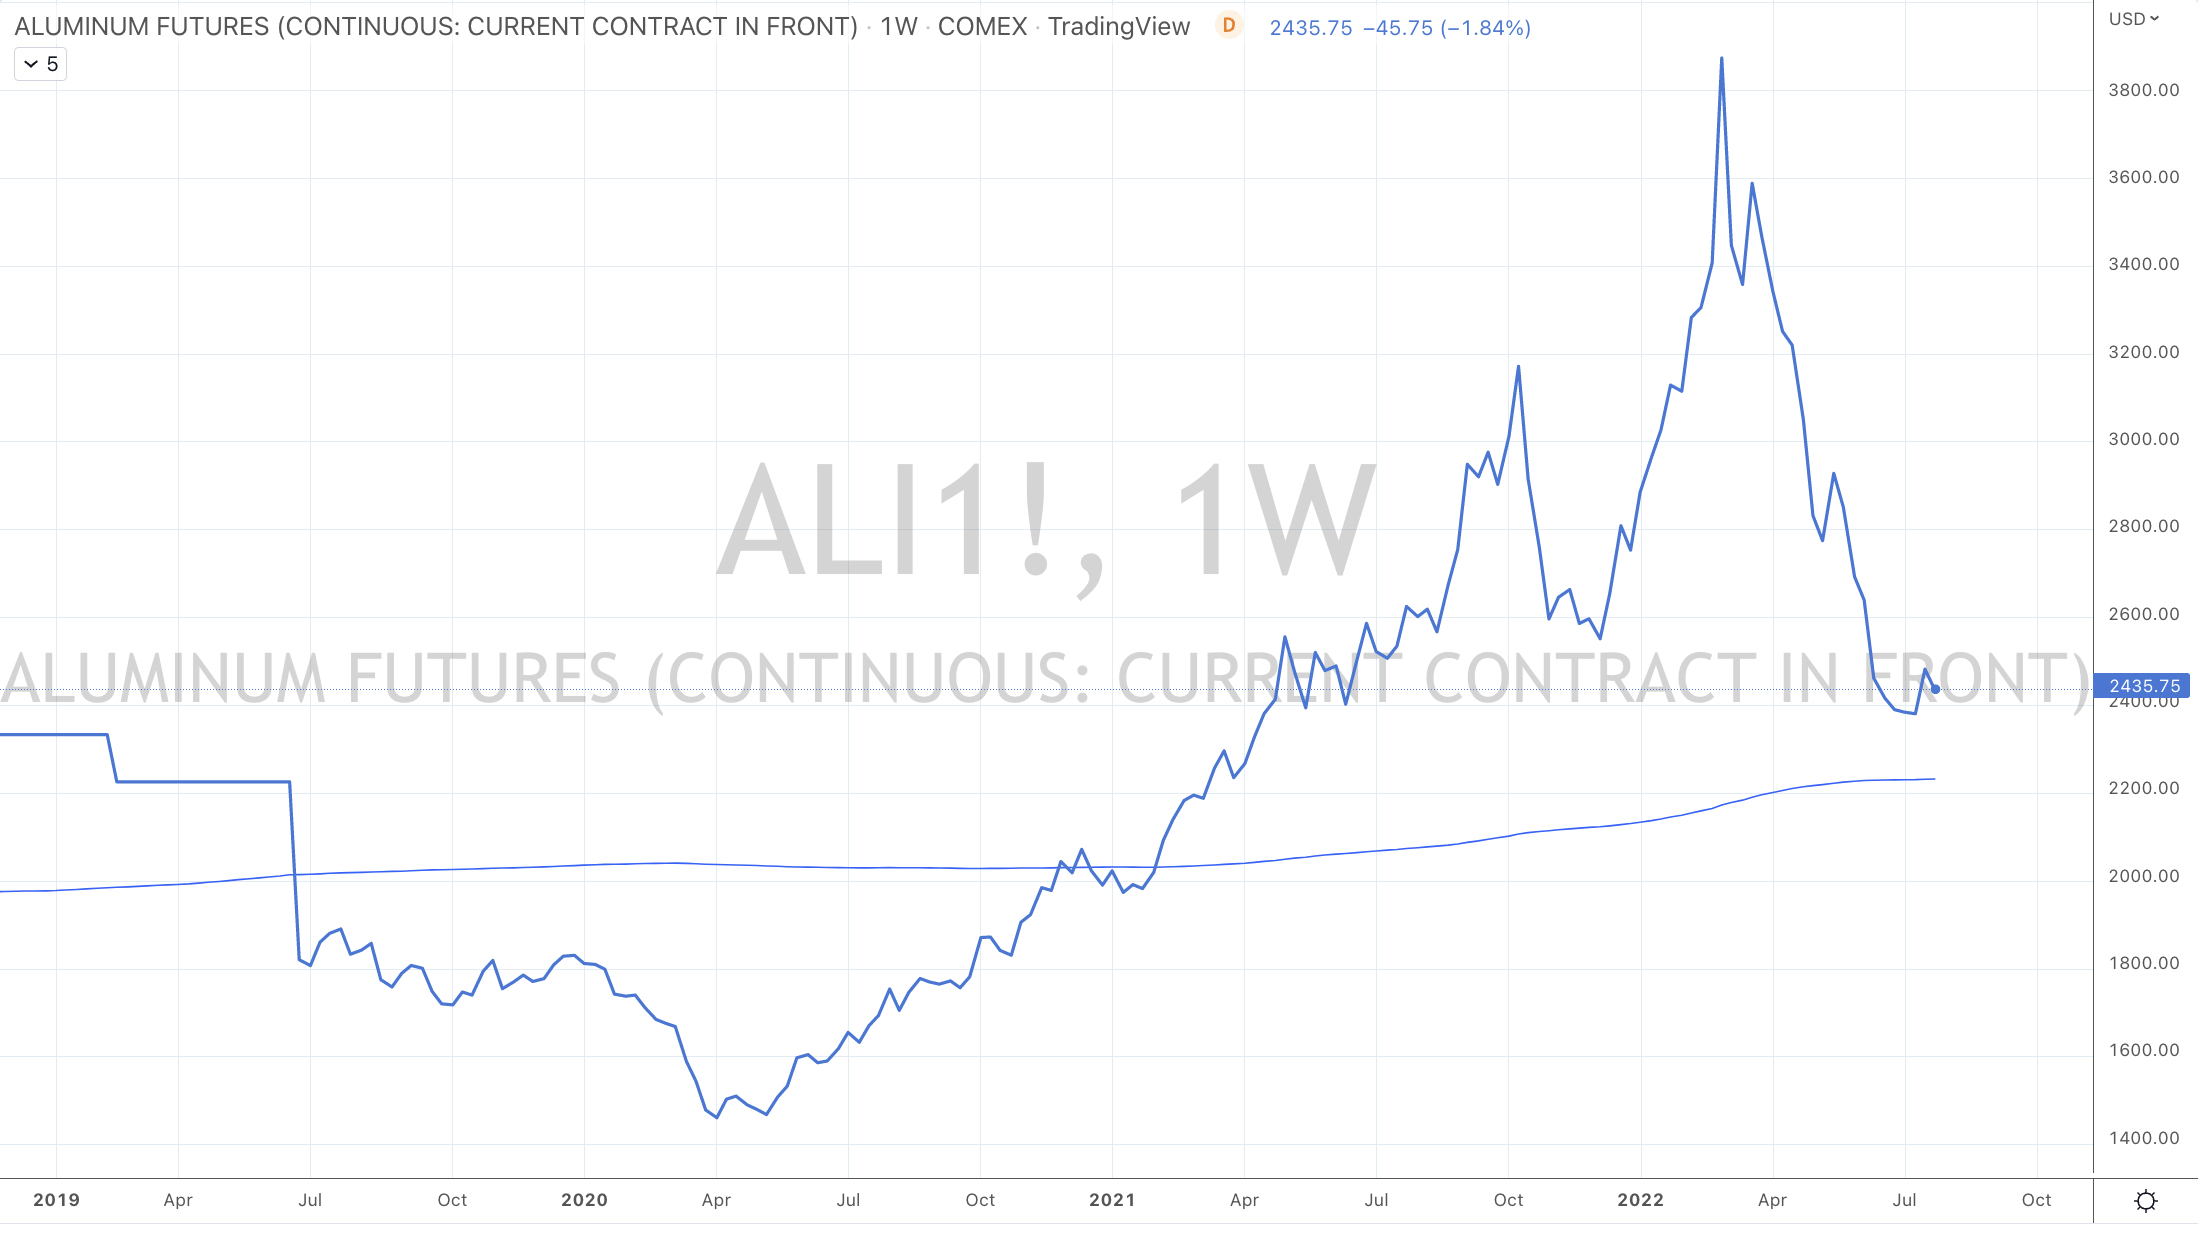
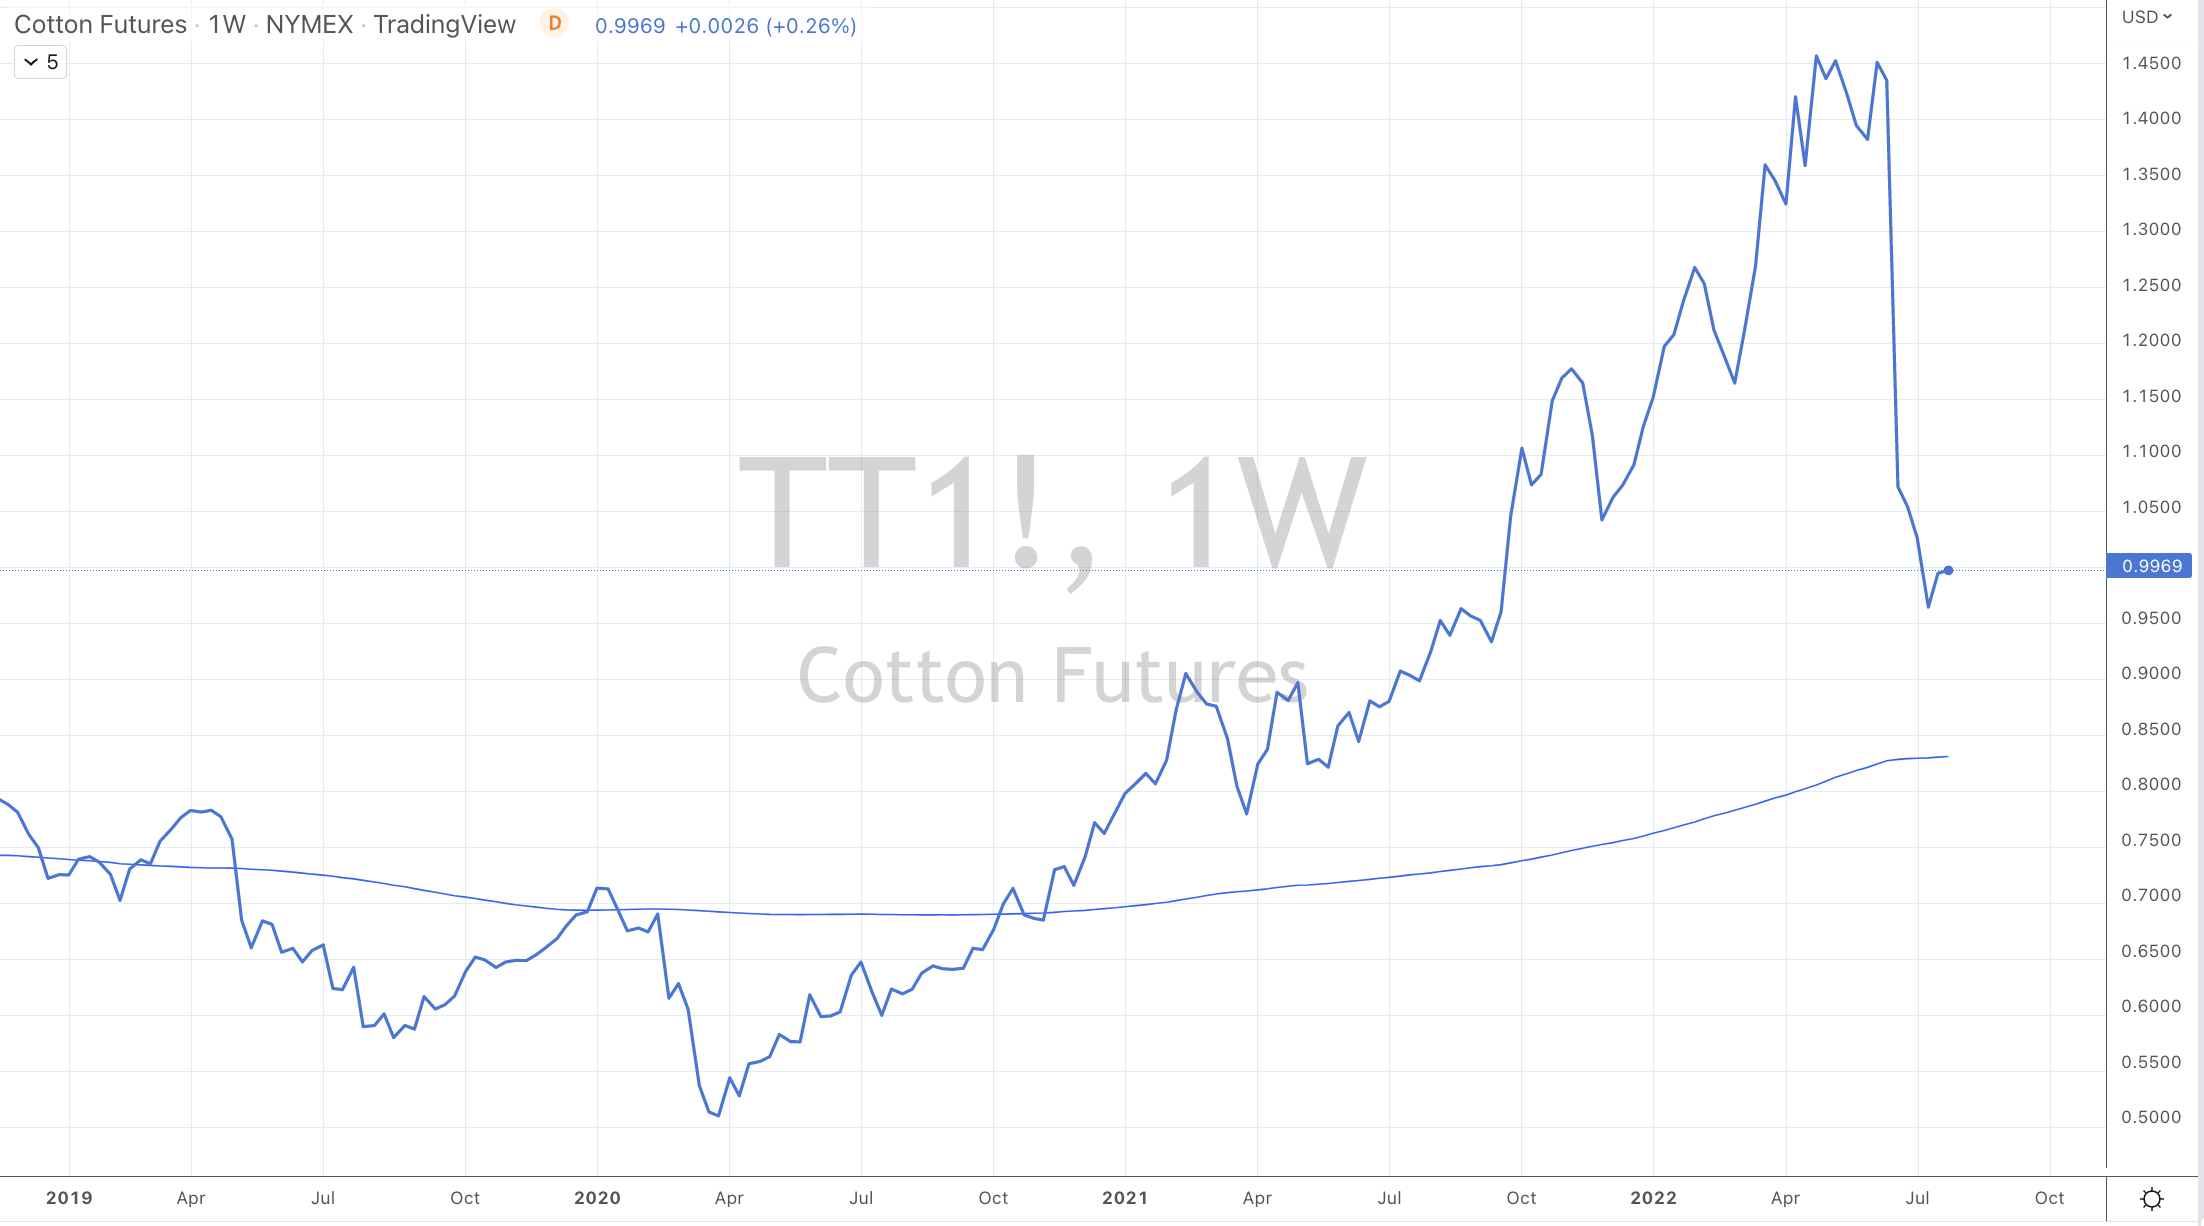
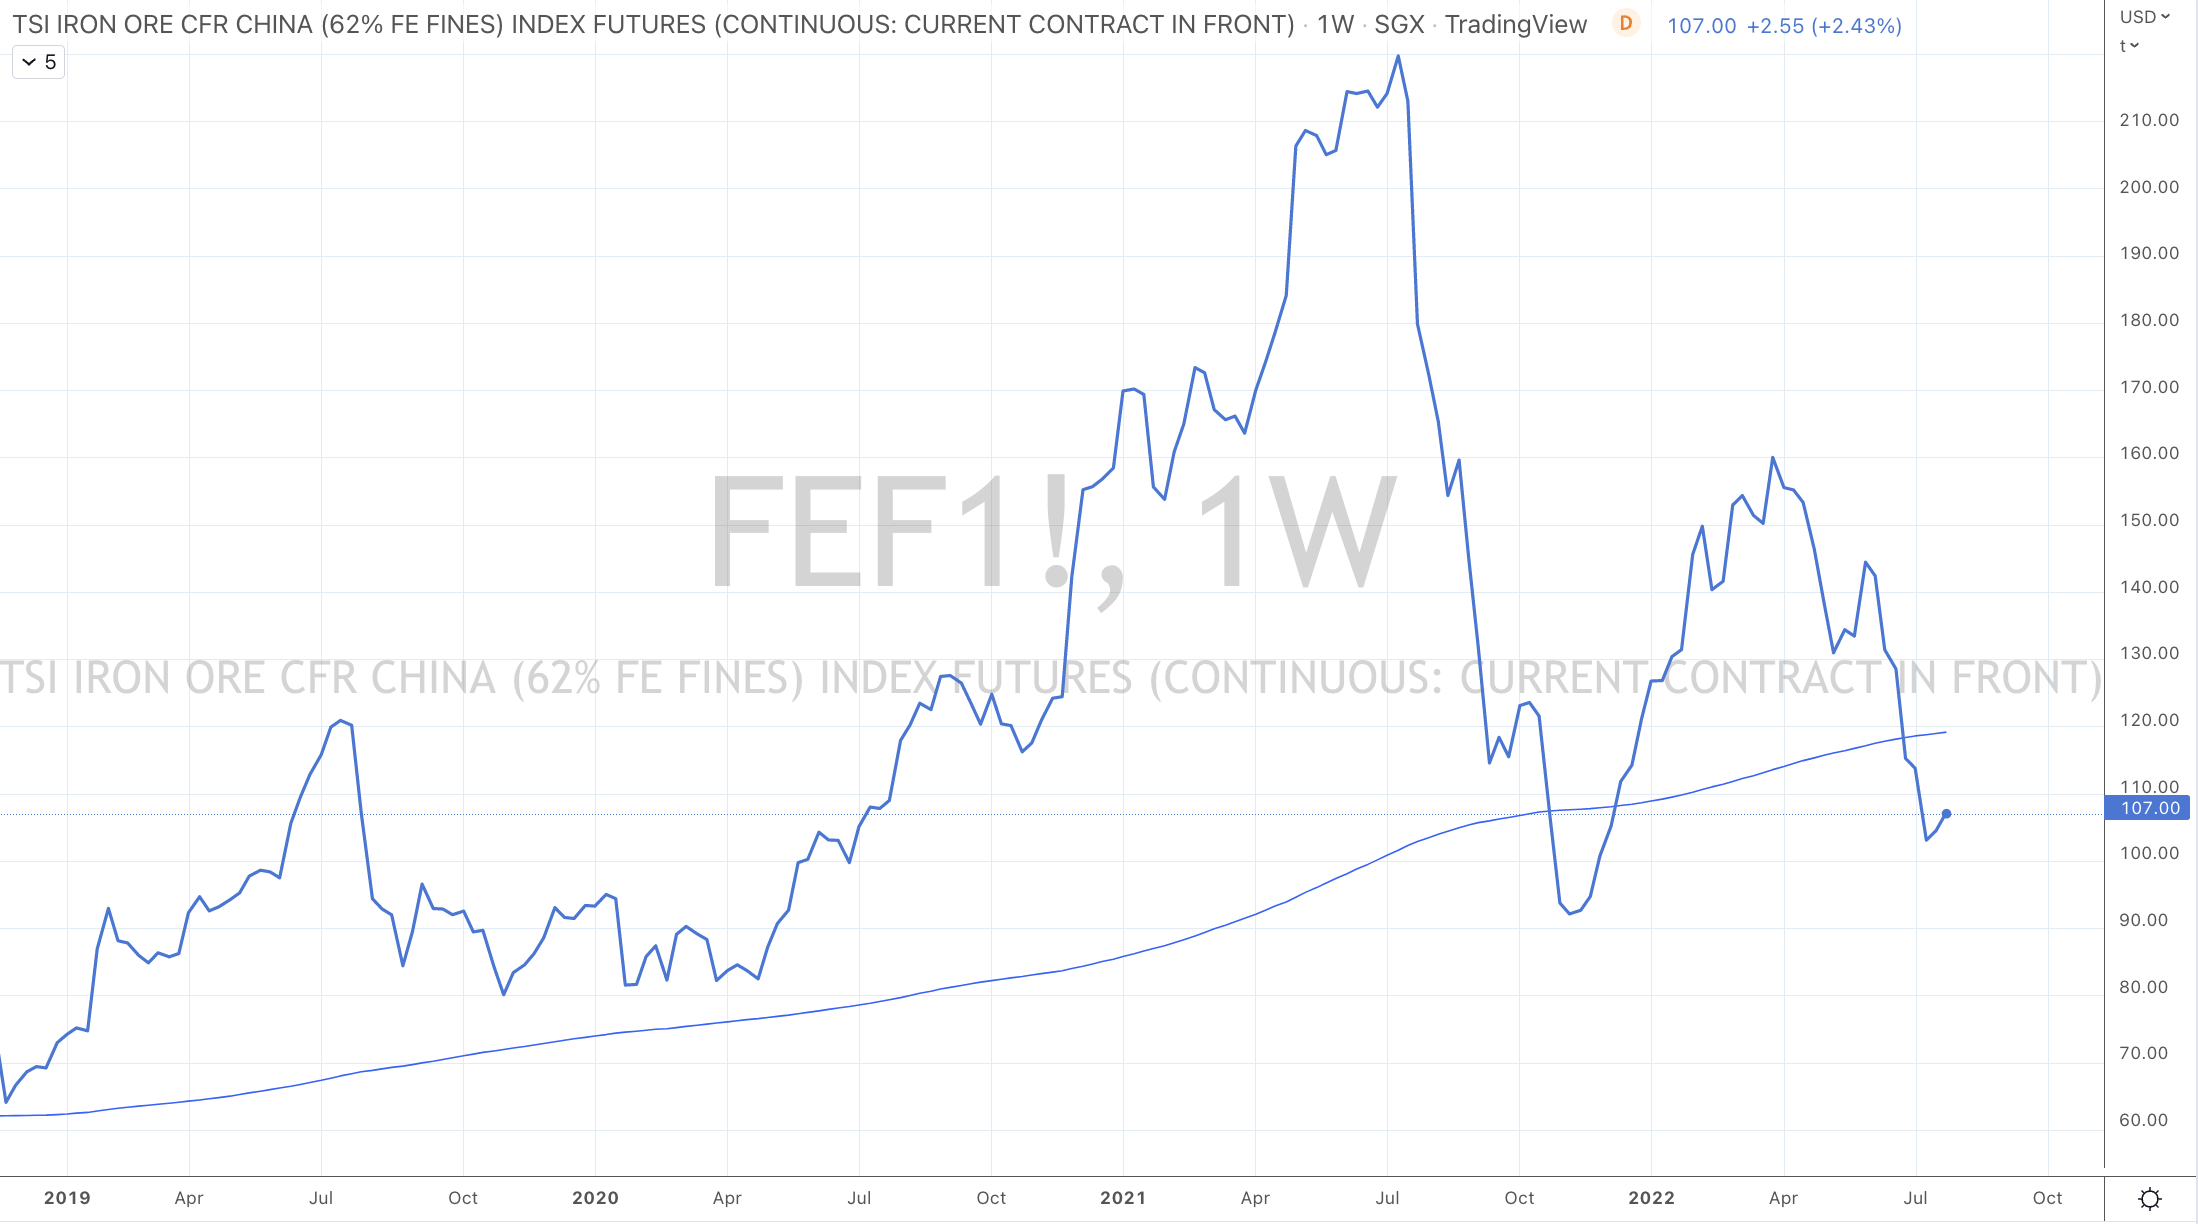
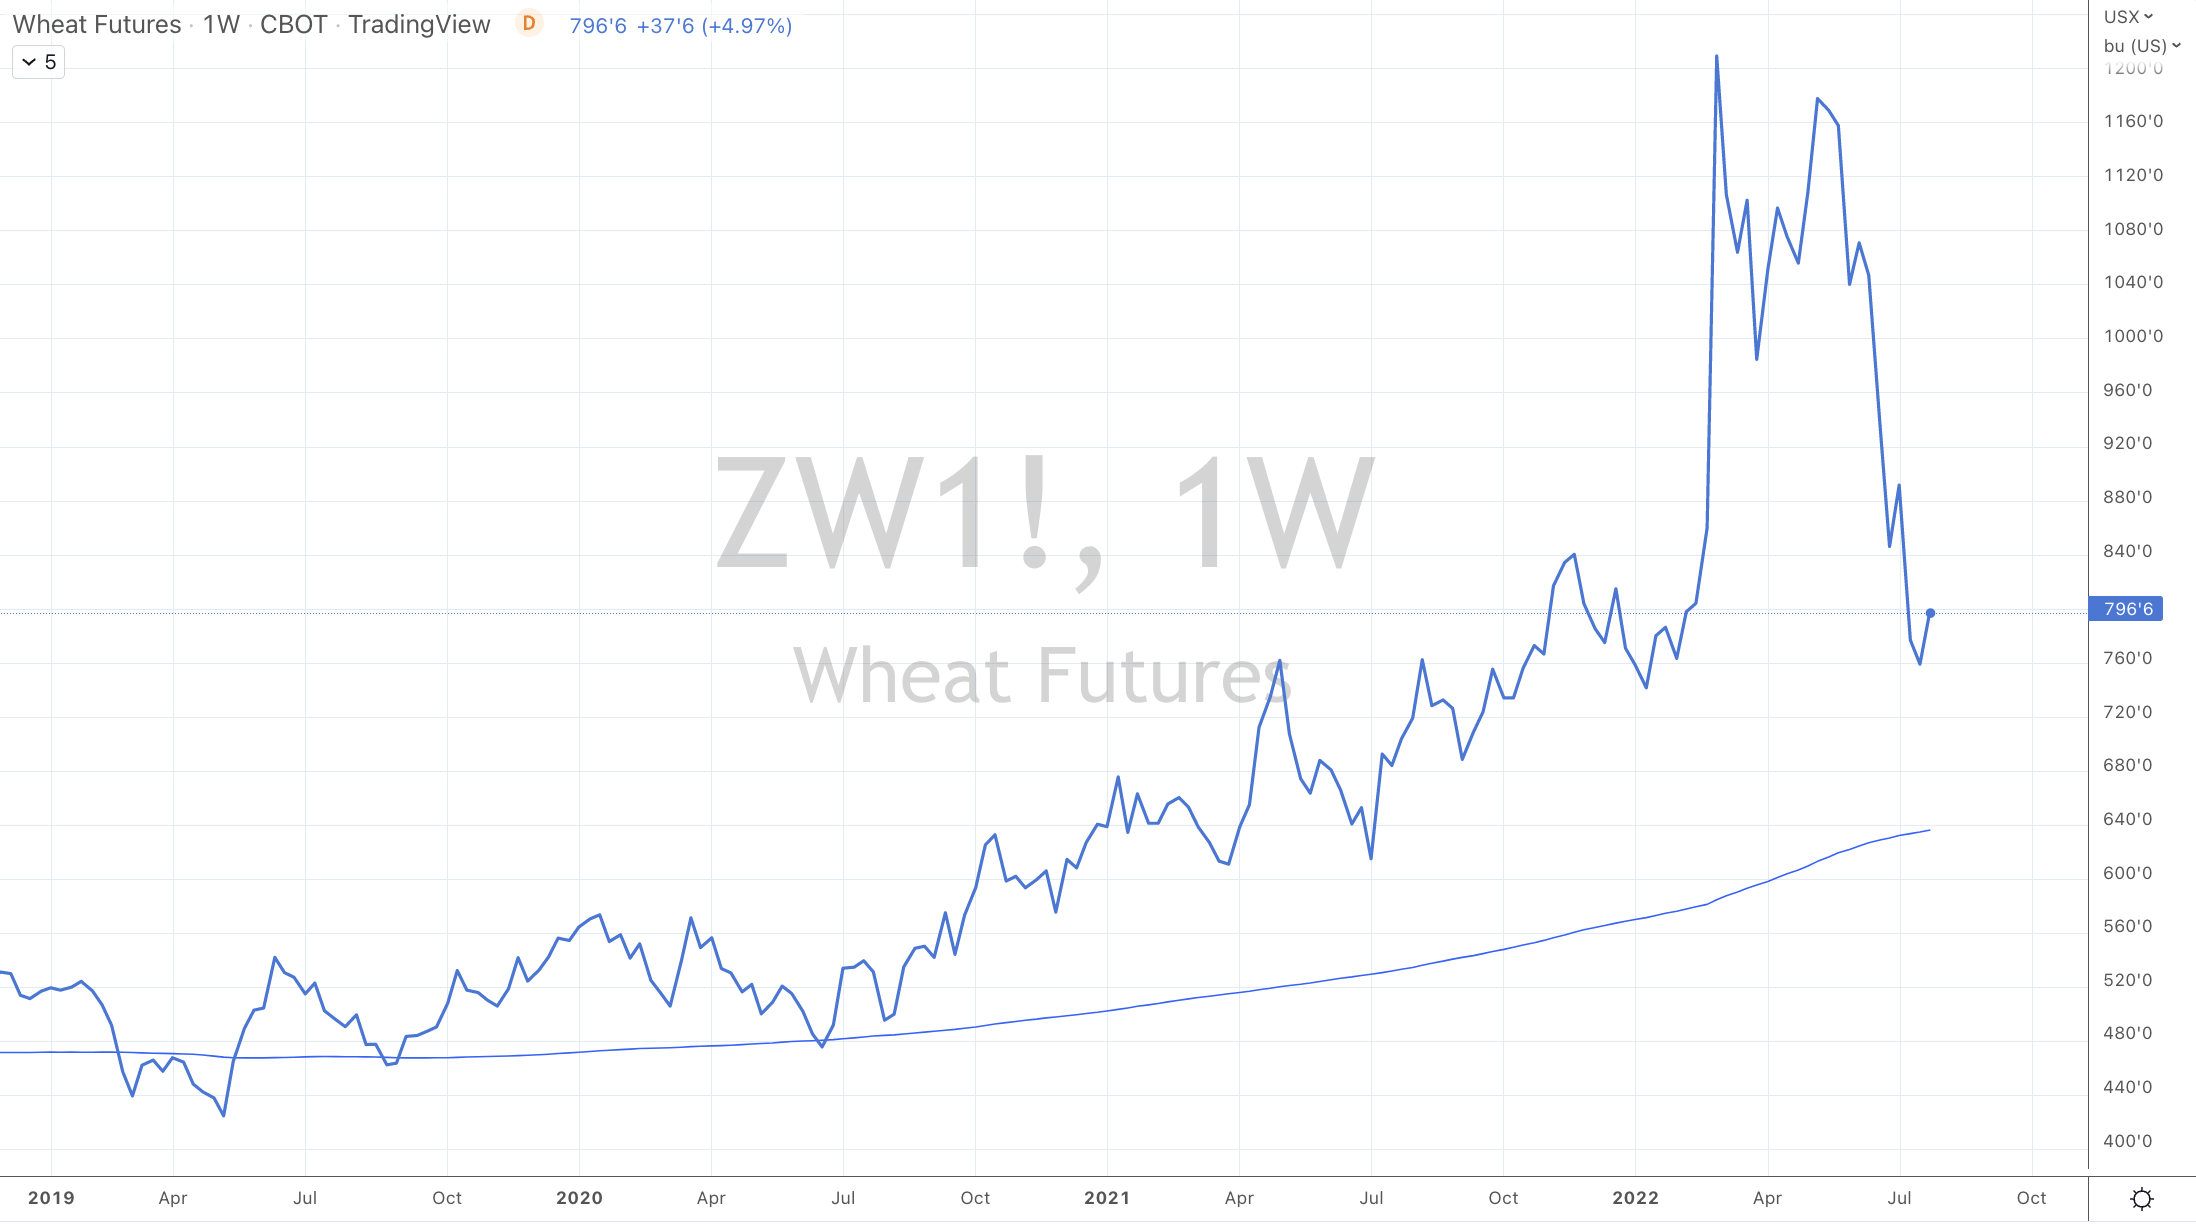
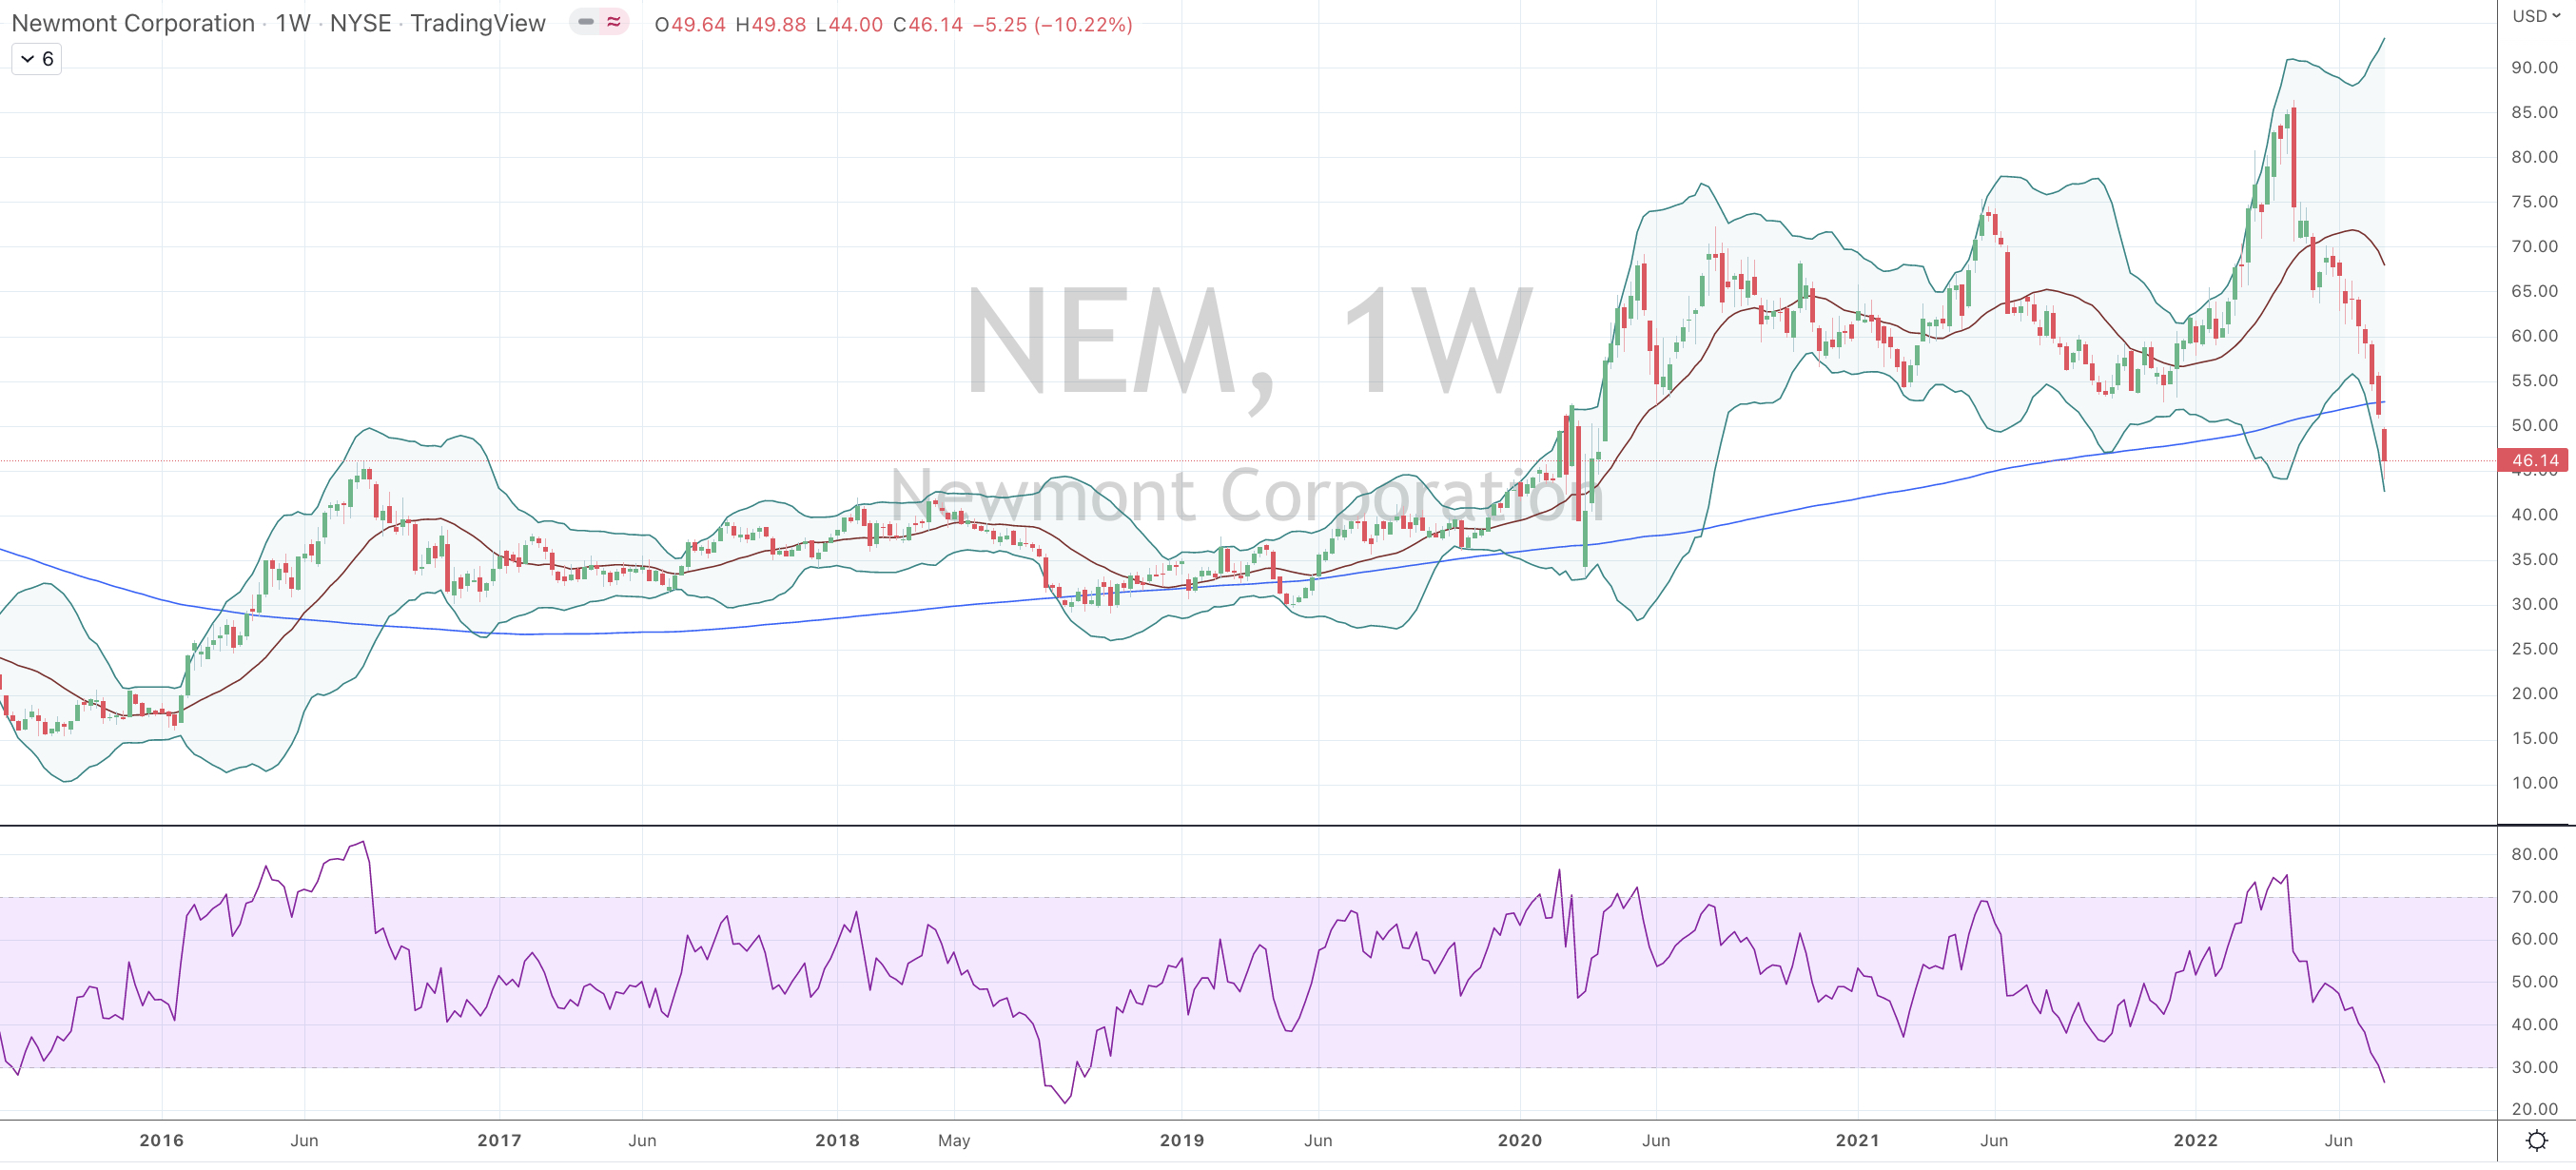
The assorted charts show the declines and mean reversions in commodities ranging from Wheat, Corn, Oats, Soybeans, Copper, Steel, Iron Ore, Australian Coking Coal, Silver, Urea, Tin, Nickel, Cotton, Aluminium and the Baltic Dry (shipping) Index.
These lower prices also equate to lower inputs for those buying at today’s price whilst buyers at higher prices are needing to move inventory of costlier produced product in the face of being undercut by latecomers or the patient.
“After you buy something you paid for, it doesn’t matter. People cling to the idea that at least they should get their money back; maybe there is bad news, and you should sell before it goes lower; maybe put it into something else where you get your money back, but people prefer to make it back where they lost it. People anchor numbers in their heads, and they hold on to them.”