The following assets (on a weekly timeframe) registered an Overbought or Oversold reading and/or have traded more than 2.5 standard deviations above or below its rolling mean.
Extremes “above” the Mean (at least 2.5 standard deviations)
None
Overbought (RSI > 70)
Australian 2, 3, 5 & 10 year government bond yields
Canadian, Swiss, German, Spanish, French, Greek, Italian, South Korean, New Zealand and Portuguese 10 year government bond yields
U.S. 2 & 5 year government bond year yields
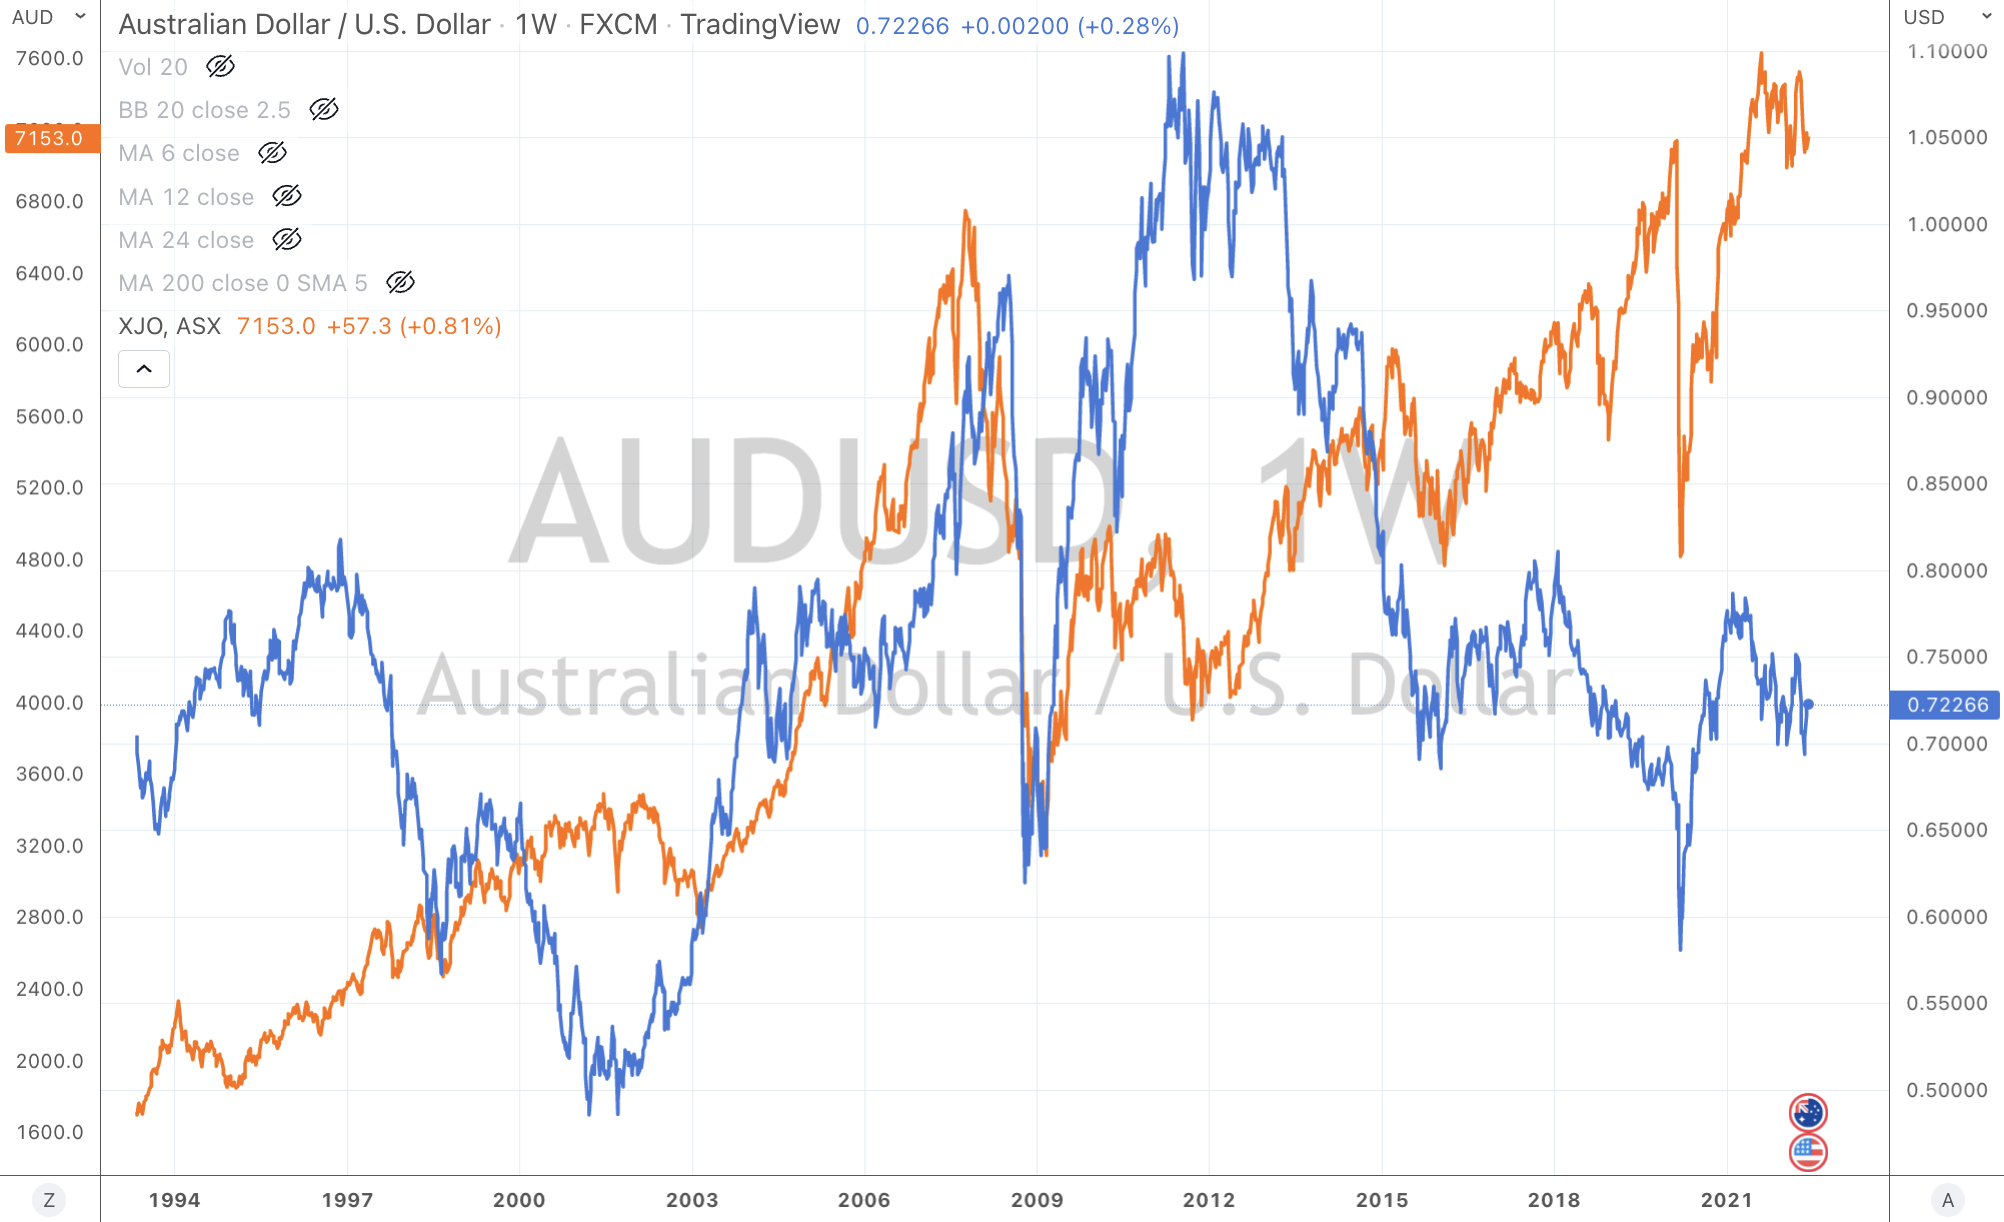
U.S. Dollar (DXY) Index
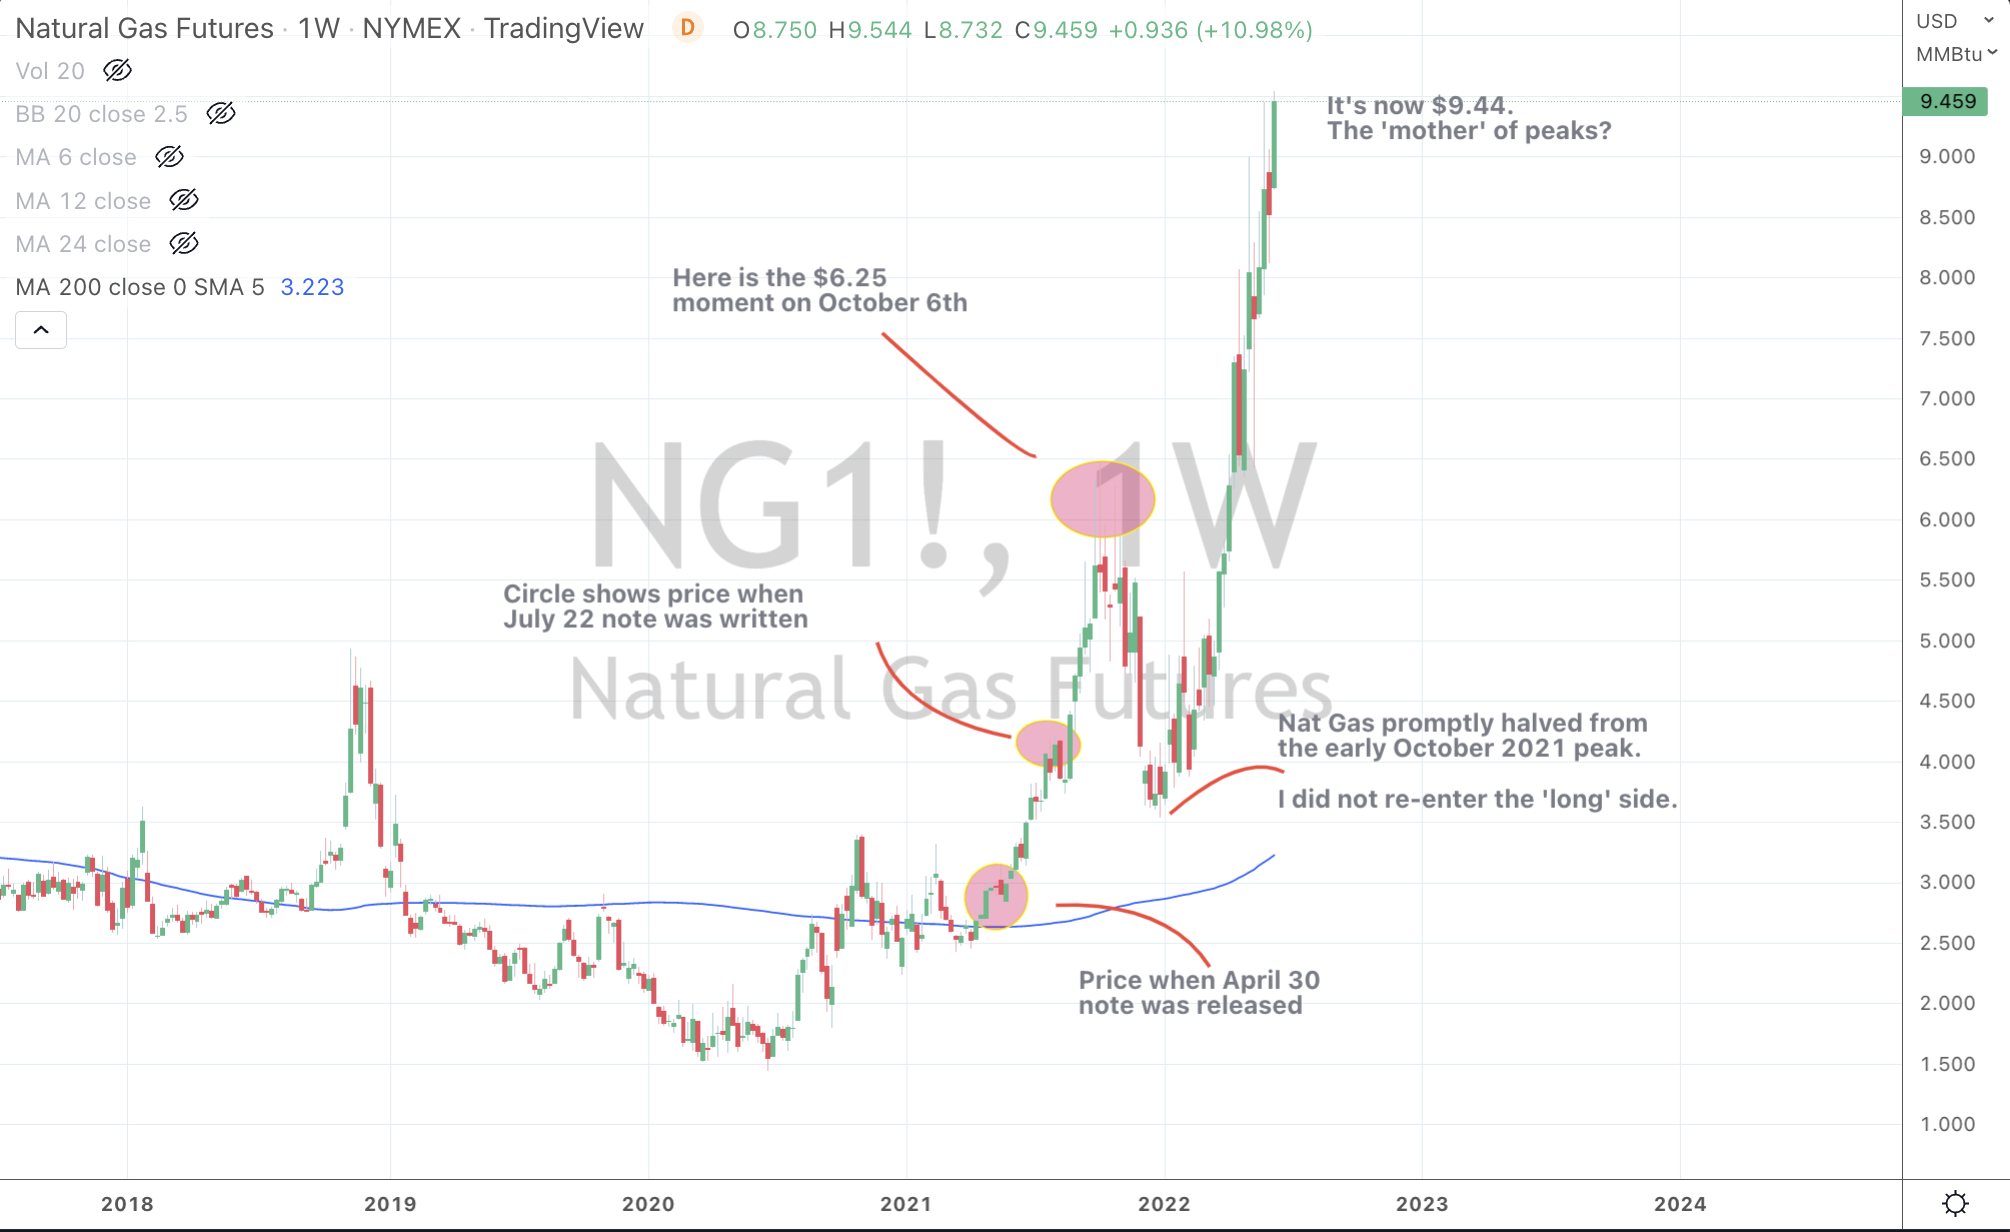
Natural Gas
Gasoline
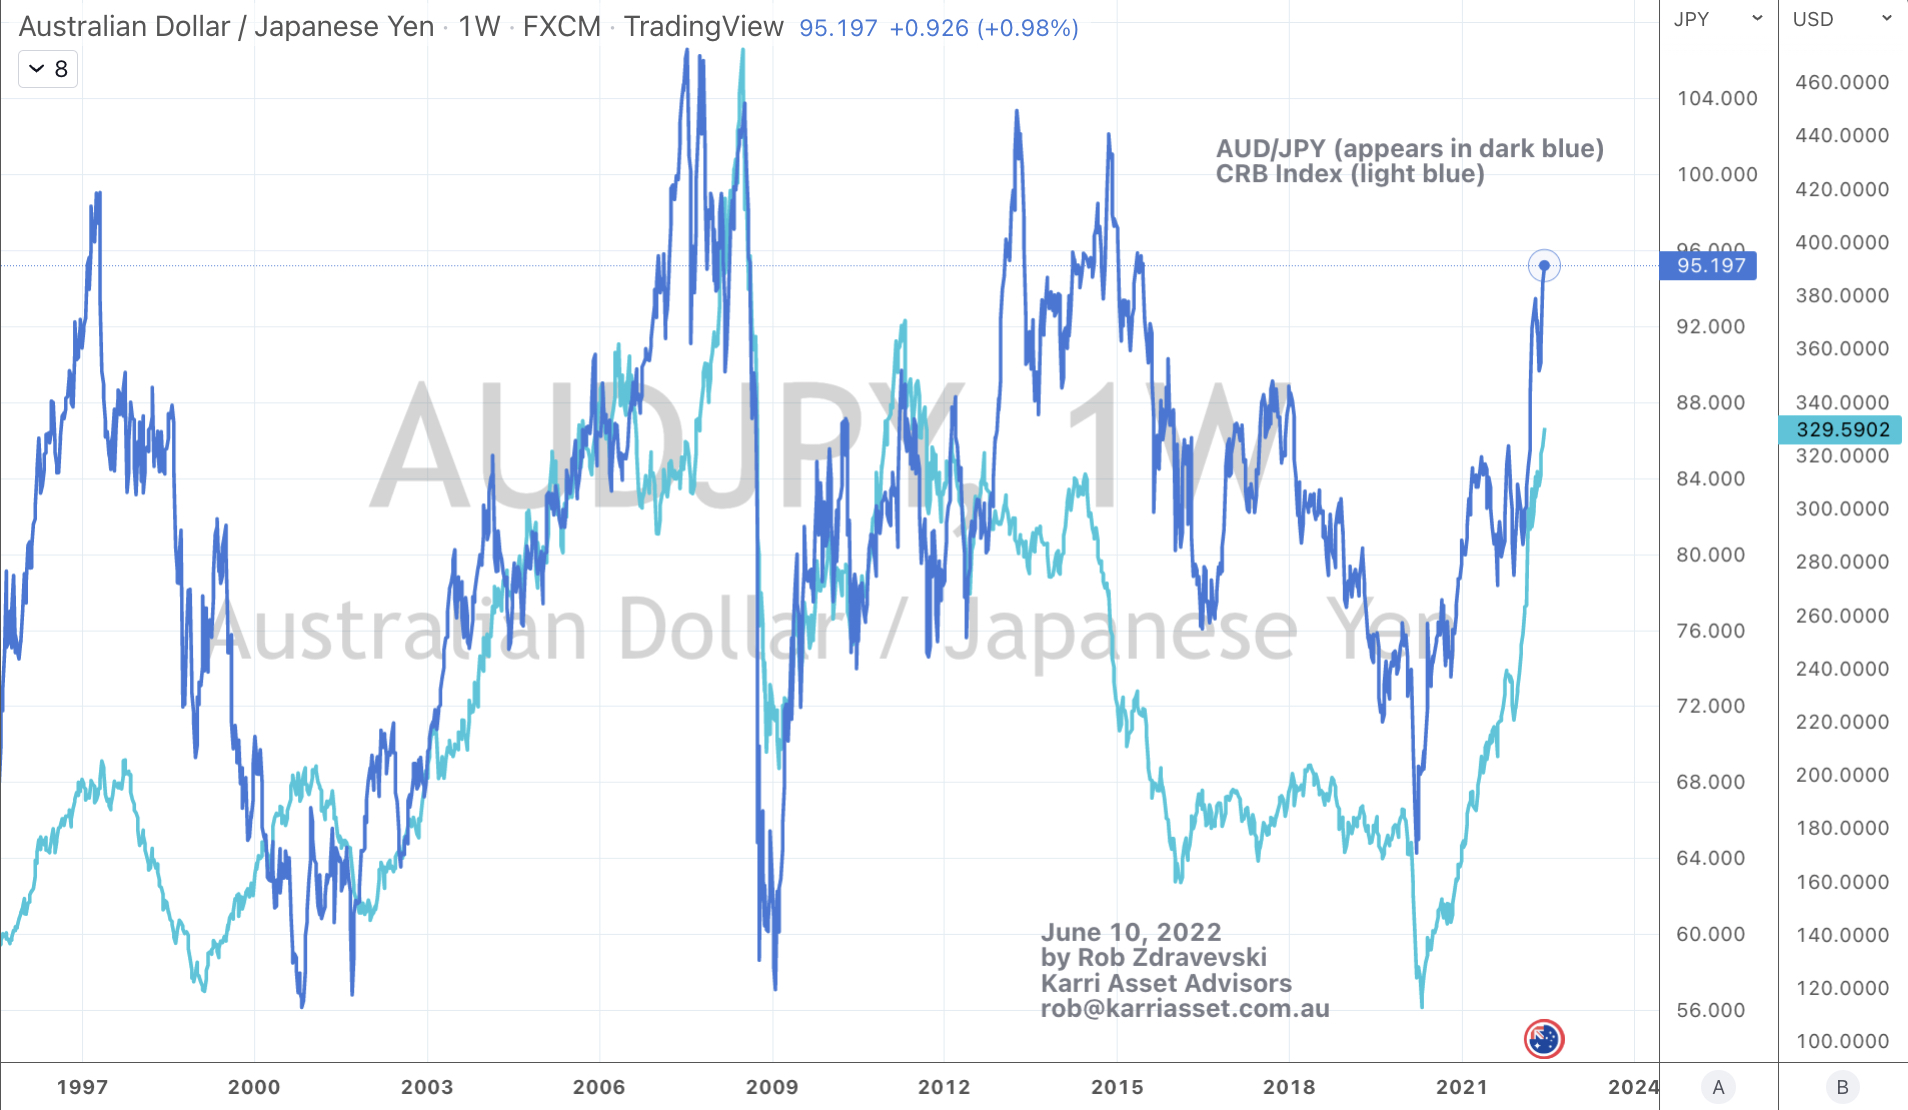
CRB Index
Bloomberg Commodity Index
WTI Crude Oil (September ’22 and December ’22 contracts)
USD/JPY
The Overbought Quinella – Both Overbought and Traded at > 2.5 standard deviations above the weekly mean)
None
Extremes “below” the Mean (at least 2.5 standard deviations)
None
Oversold (RSI < 30)
NZD/AUD
JPY/USD
TLT
The Oversold Quinella – Both Overbought and Traded at > 2.5 standard deviations above the weekly mean)
None
Notes & Ideas:
The big news for the week was the rise in global government bond yields. Following a couple down weeks, 10 year bond yields rose. Some examples include Spain moving from 2.09% to 2.47%, Germany’s yield increased from 0.98% to 1.26%, UK Gilts rose from 1.92% to 2.15% and the American 10’s climbed from 2.74% to 2.94%.
Many of these yields made new, recent highs…except for the U.S. Its high remains 3.20%.
While the Japanese 10’s tell us that things aren’t that bad as they idle around the 24 basis points mark.
Also notice there are only currency crosses in this weeks list. After weeks of telling you they are trading at extremes many are now making their way towards their weekly mean, or at the very least away from their ‘extremes’.
So much so, the U.S. Dollar (DXY) Index is no longer overbought.
I’m also reminding readers of the pertinency when assets and securities appear in each weeks list.
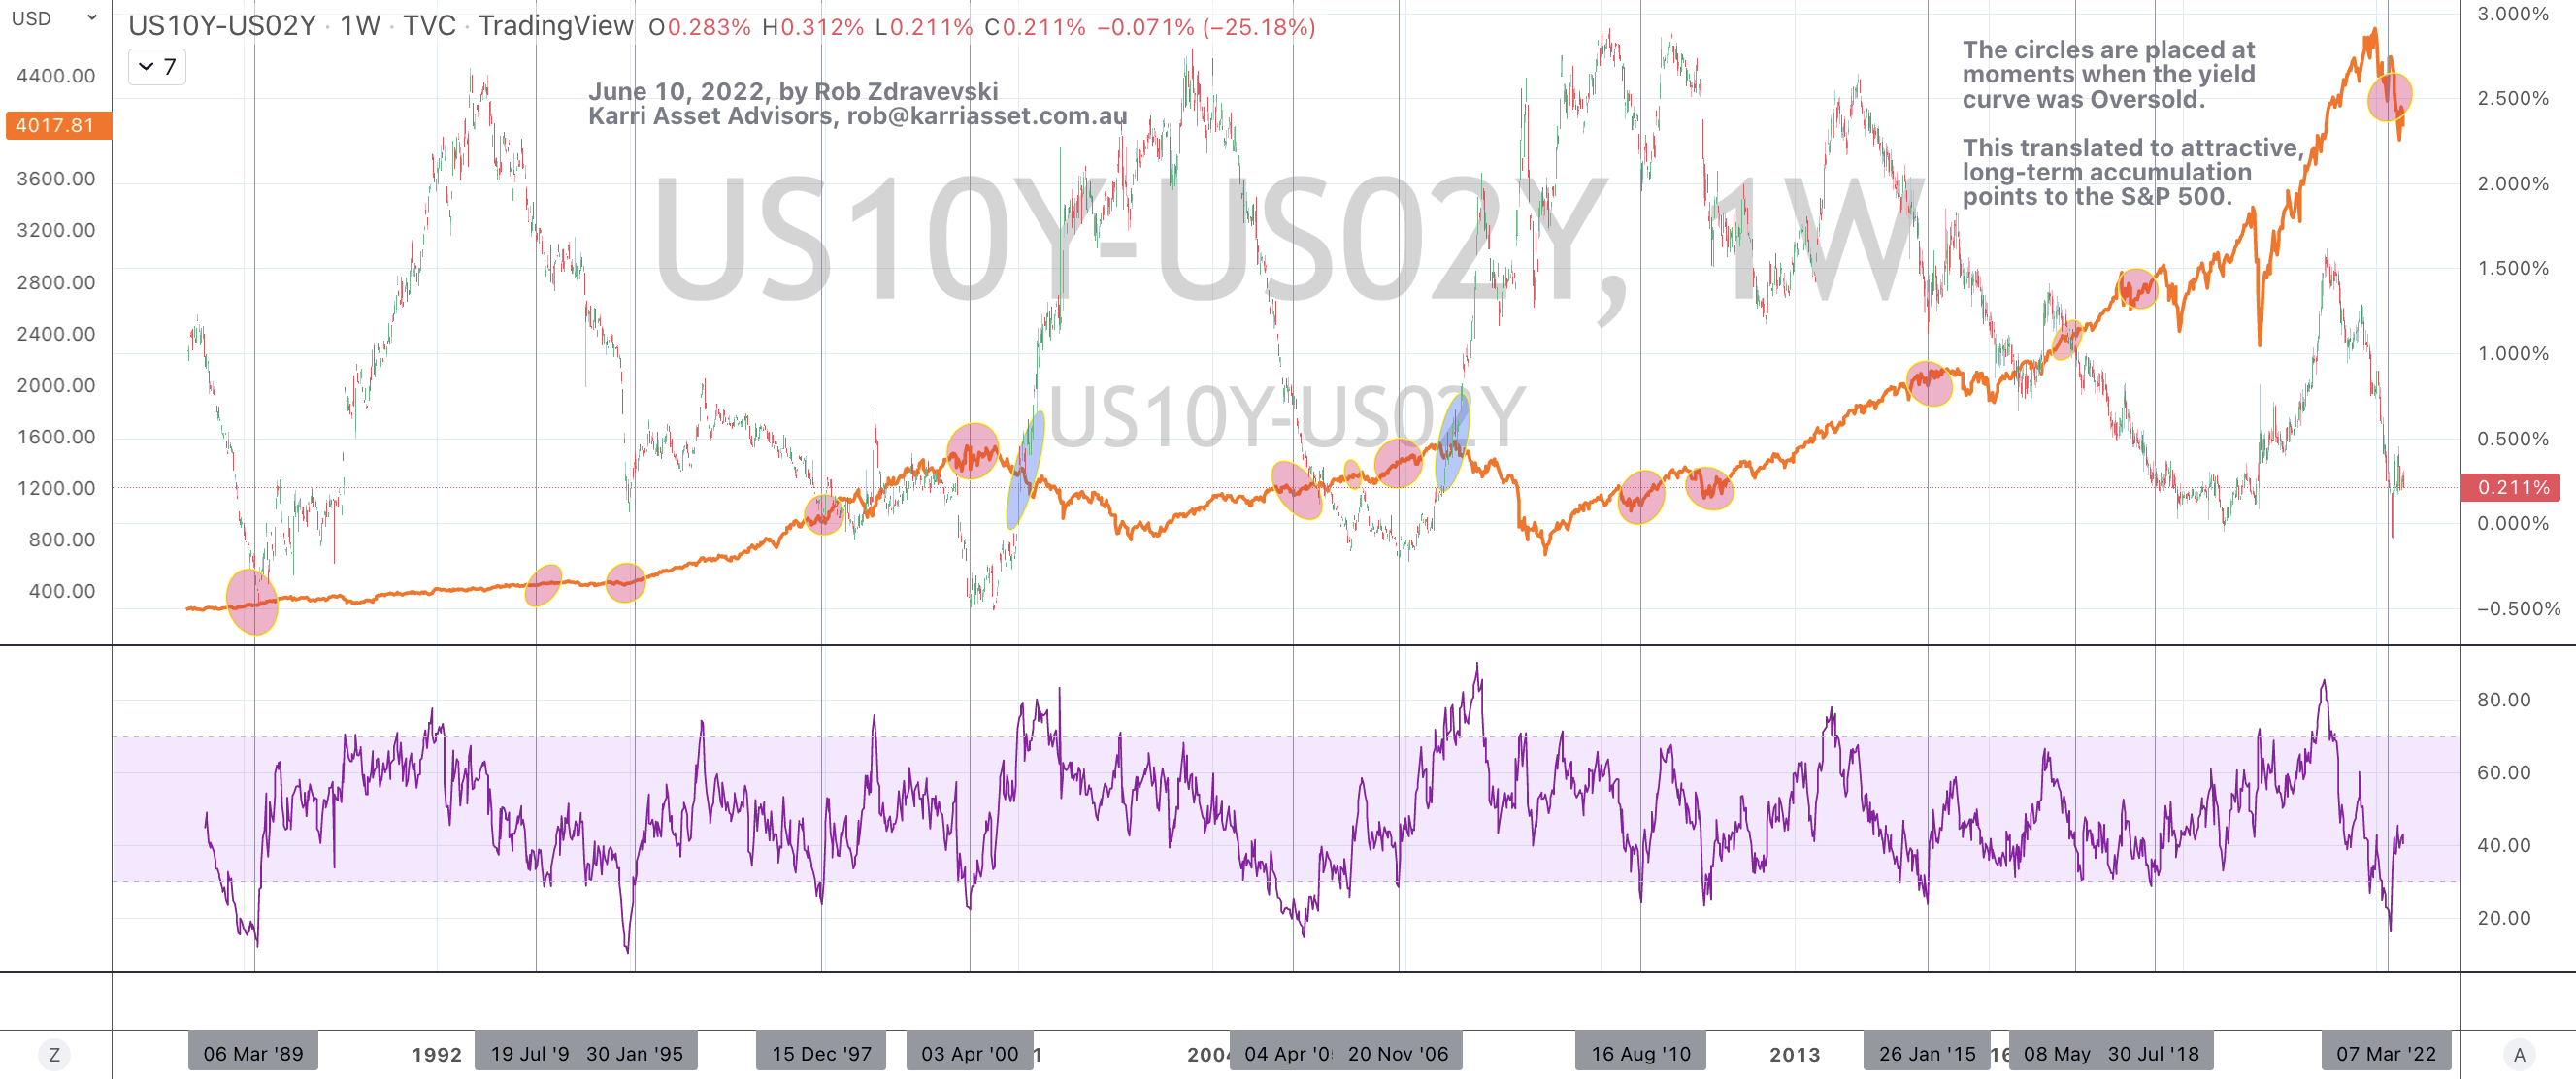
Most recent examples, include the Oversold lows seen in Chinese and Hong Kong stocks, the Oversold lows in U.S. indices such as S&P 500 and the Russell 2000 and South Korea’s Kospi’s which has risen 4.7% from its Oversold low of 2,550 on May 9th to its current 2,670 level.
These are not oversold any longer.
The CRB (commodities) Index remains overbought, for the 20th consecutive week.
The energy complex continued its strength, while subjectively its nearing stretched levels.
Copper rose for the week as did the Copper/Gold ratio. The latter hit and didn’t break resistance.
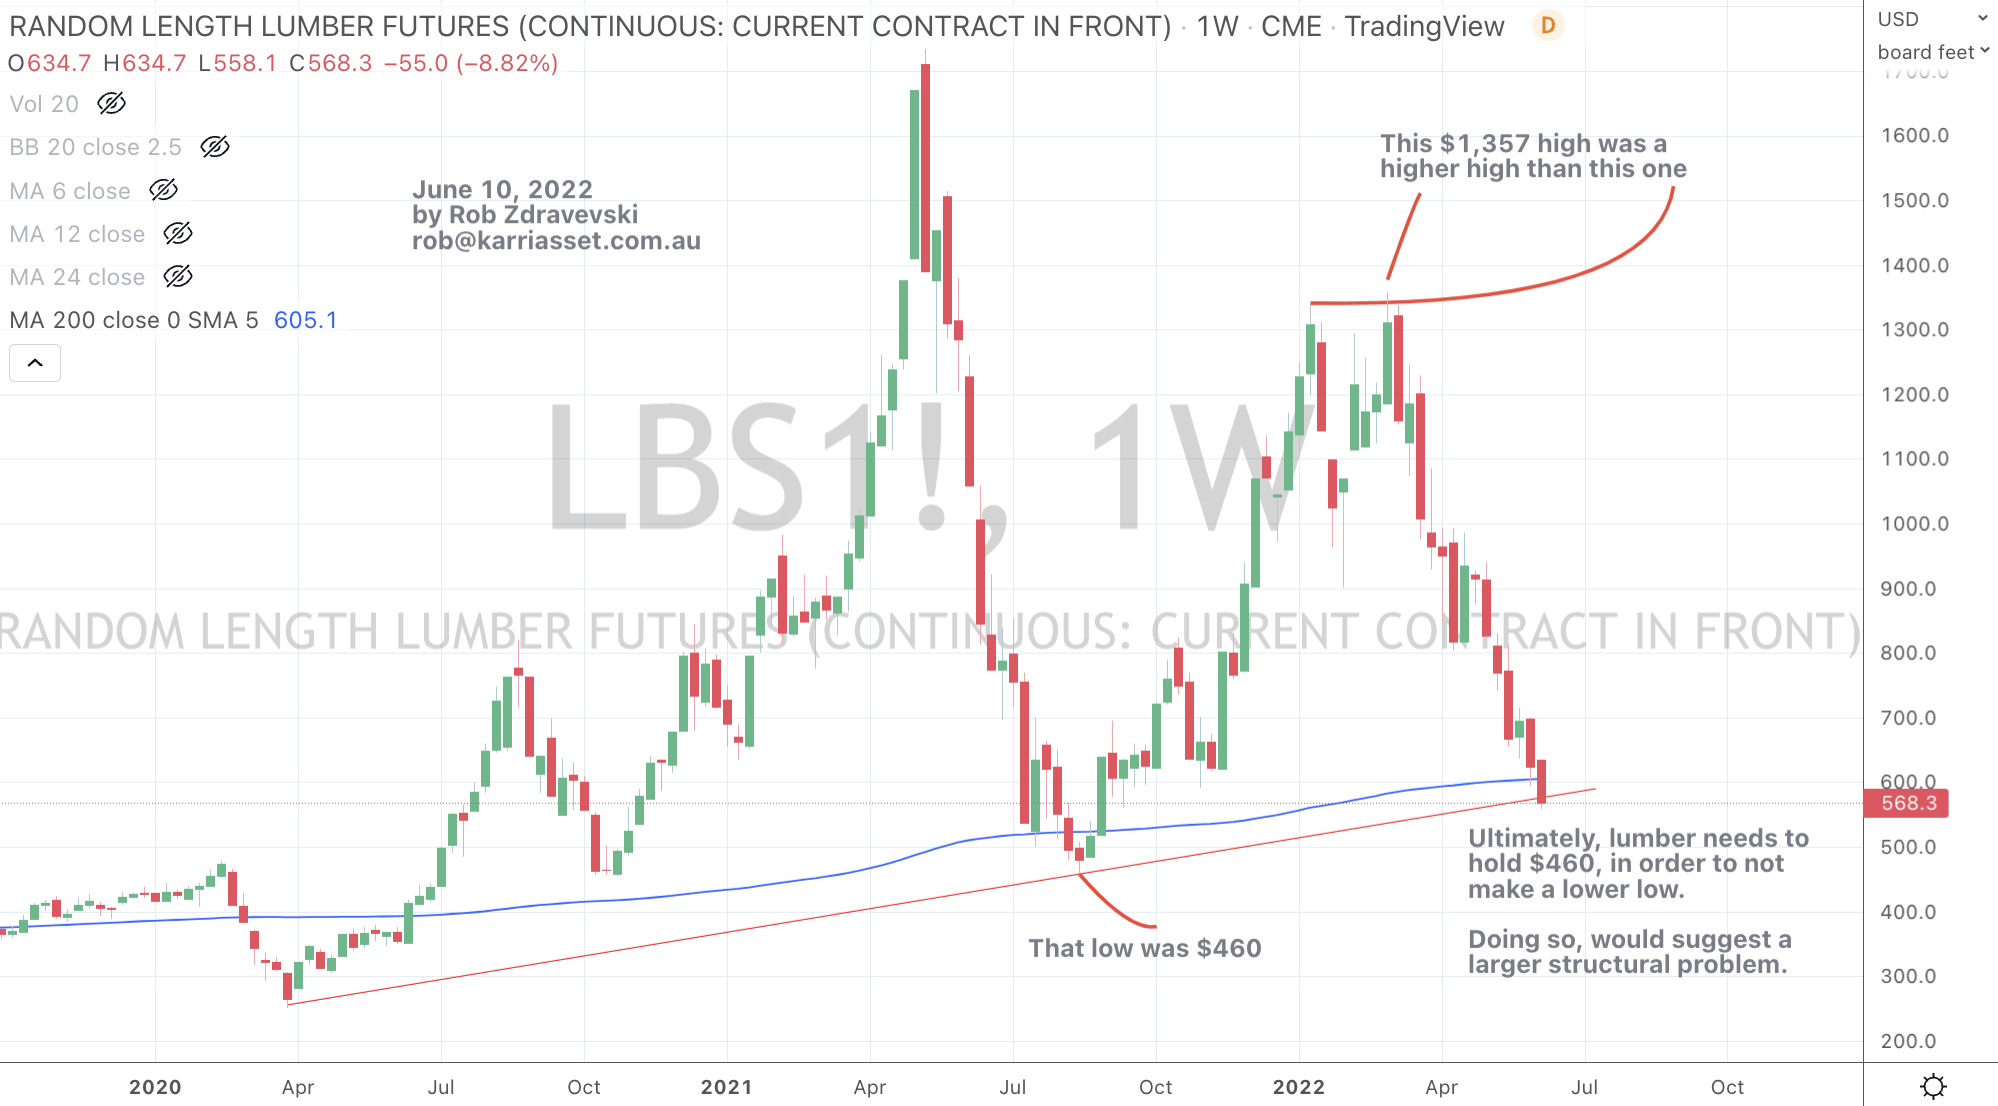
Lumber fell notably for the week and has halved since March. It closed the week at $623. The $500 – $560 range may prove an attractive entry point.
Cryptocurrencies were quiet, while one of the 6 or so darlings, Cardano rose 17%. I heard about Cardano from ‘retail’ investors when it was $3. I don’t hear about when it’s 56 cents.
In other news, grains were lower with Wheat leading the decline with a drop of 10%. As the ‘long’ soft’s is crowded and the probability of mean reversion is increasing, its a warning for farmers to lock in prices.
I’ll watch if Gold (in AUD) holds the A$2,500 level.
And perversely, the Shanghai Composite Index has risen 6.2% in 4 weeks, albeit in the face of Covid lockdowns, it’s a reminder of how markets factor in the news quicker than many expect.
The larger advancers over the past week comprised of;
Rotterdam Coal 12.4%, WTI Crude 3.3%, Gasoil 12.8%, Copper 3.8%, Heating Oil 6.9%, JKM 6.1%, Nickel 8.5%, Platinum 7.8%, Gasoline 8.7%, Brent Crude 1.7%, Uranium 5.7%, Shanghai Composite 2.1%, AUD/JPY 3.6%, CSI300 2.2%, HSCEI 2.6%, Hang Seng 1.9%, Nikkei 3.7%, Copenhagen 2.5% and Taiwan’s TAEIX 1.8%.
The group of decliners included;
Australian Coal (18.4%), Aluminium (5.5%), China Coal (1.9%), Hot Rolled Coil Steel (3.4%), Lumber (10.3%), Natural Gas (2.3%), Palladium (2.9%), Rubber (2%), Dutch TTF Gas (9.3%), Corn (6.5%), Oats (1.9%), Rice (3.9%), Soybeans (2%), Wheat (10.2%), KBW Banking Index (1.7%), Italy’s MIB (1.9%), IBEX (2.3%) and the SOX fell 1.7%.
June 5, 2022
by Rob Zdravevski
rob@karriasset.com.au