Latest newsletter
July 27, 2022 Leave a comment
My latest newsletter has been published. I hope readers find it useful.
The title is “A peak in inflation and interest rates”
You are welcome to subscribe to the newsletter by clicking here.
Trying to hear what's not being said
July 27, 2022 Leave a comment
My latest newsletter has been published. I hope readers find it useful.
The title is “A peak in inflation and interest rates”
You are welcome to subscribe to the newsletter by clicking here.
July 27, 2022 Leave a comment
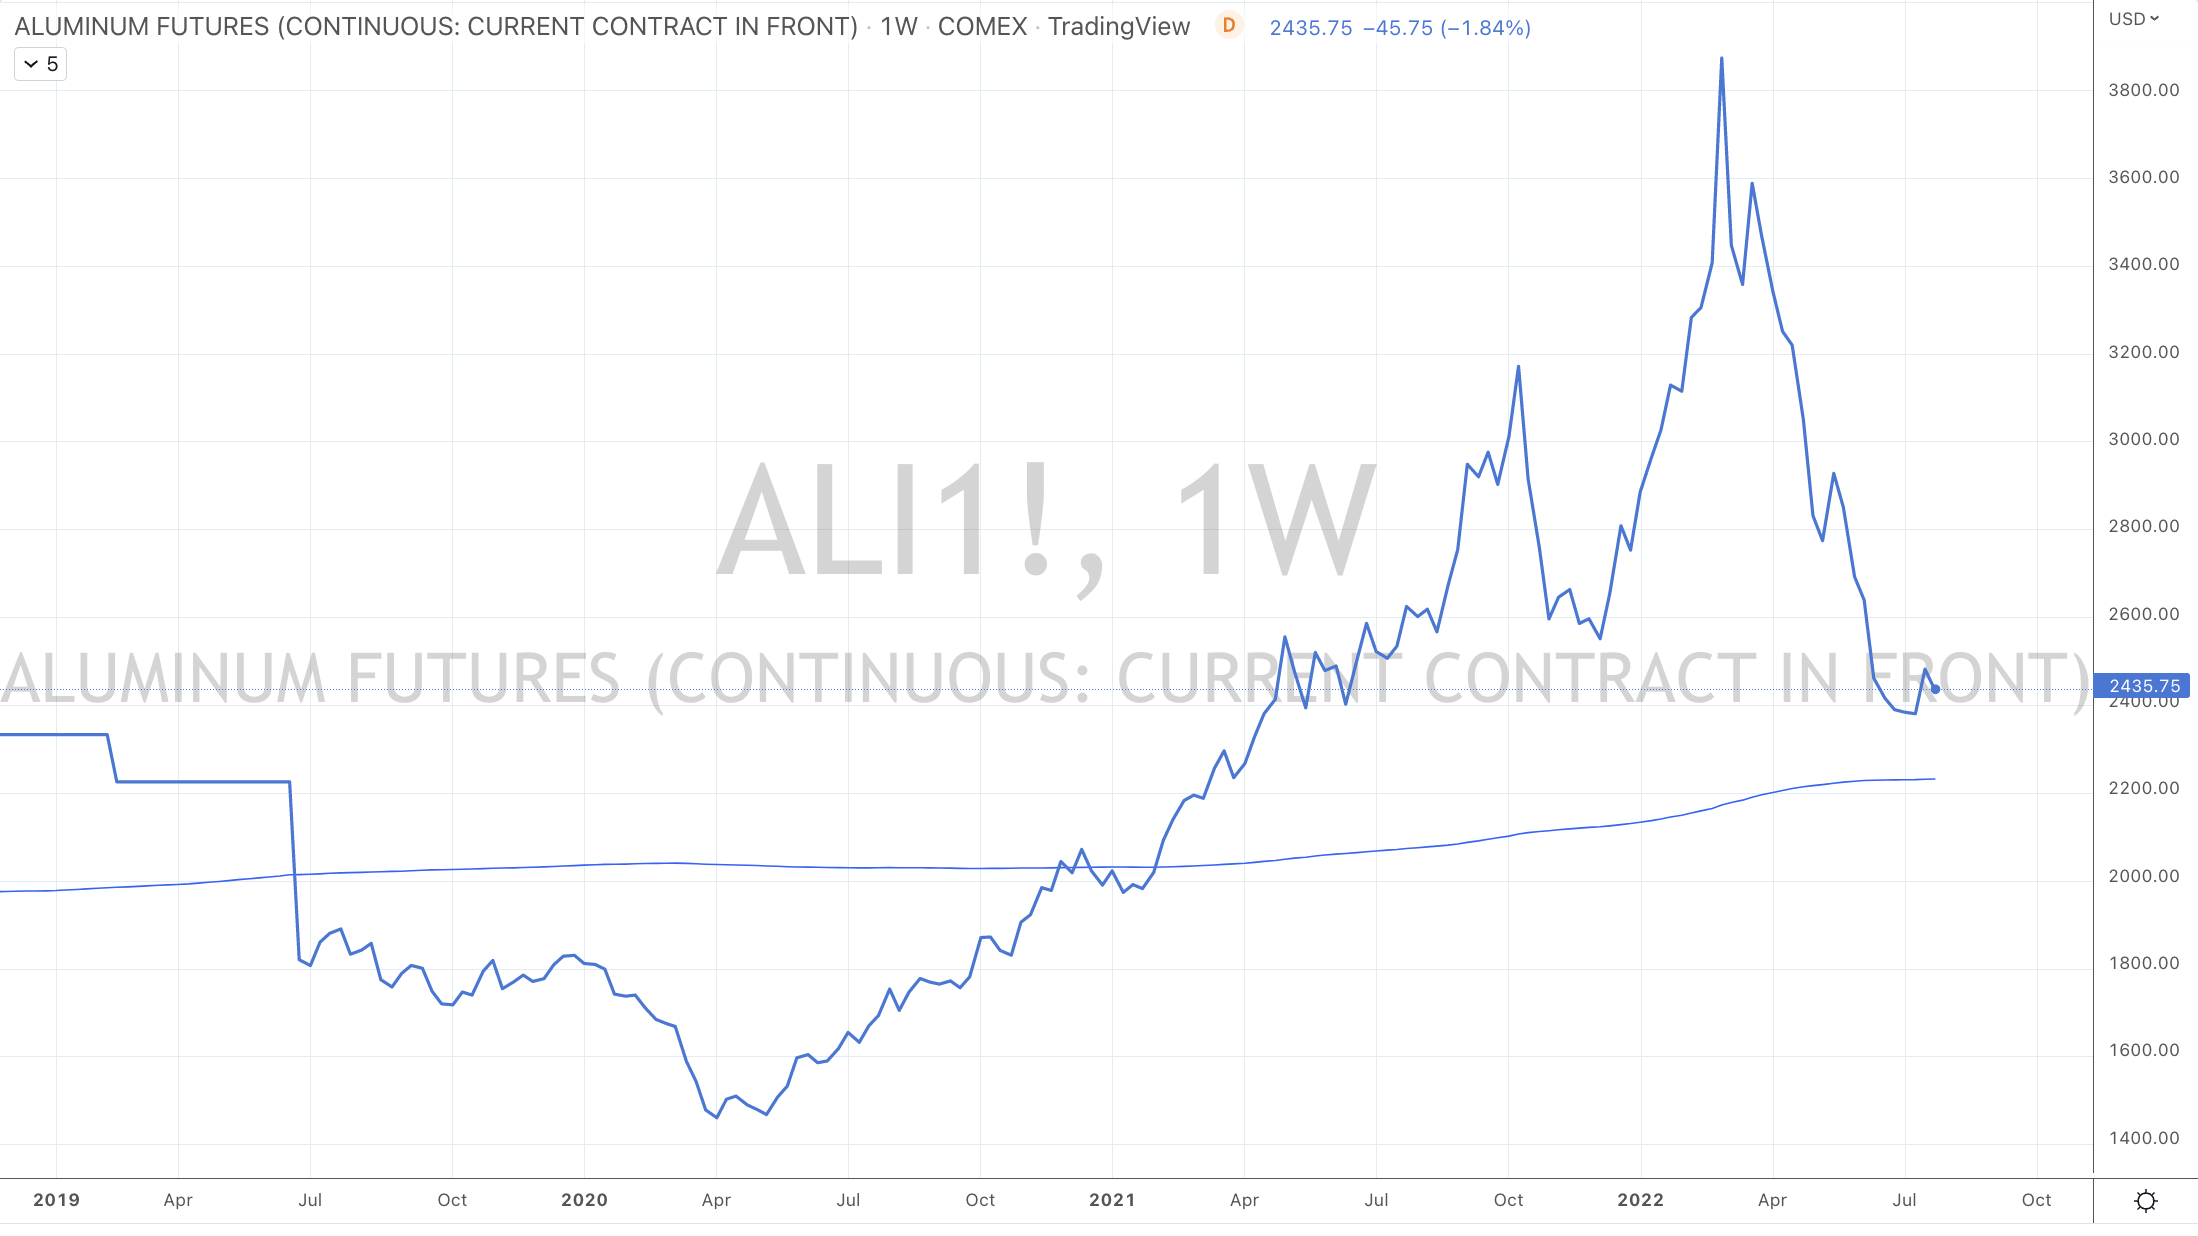
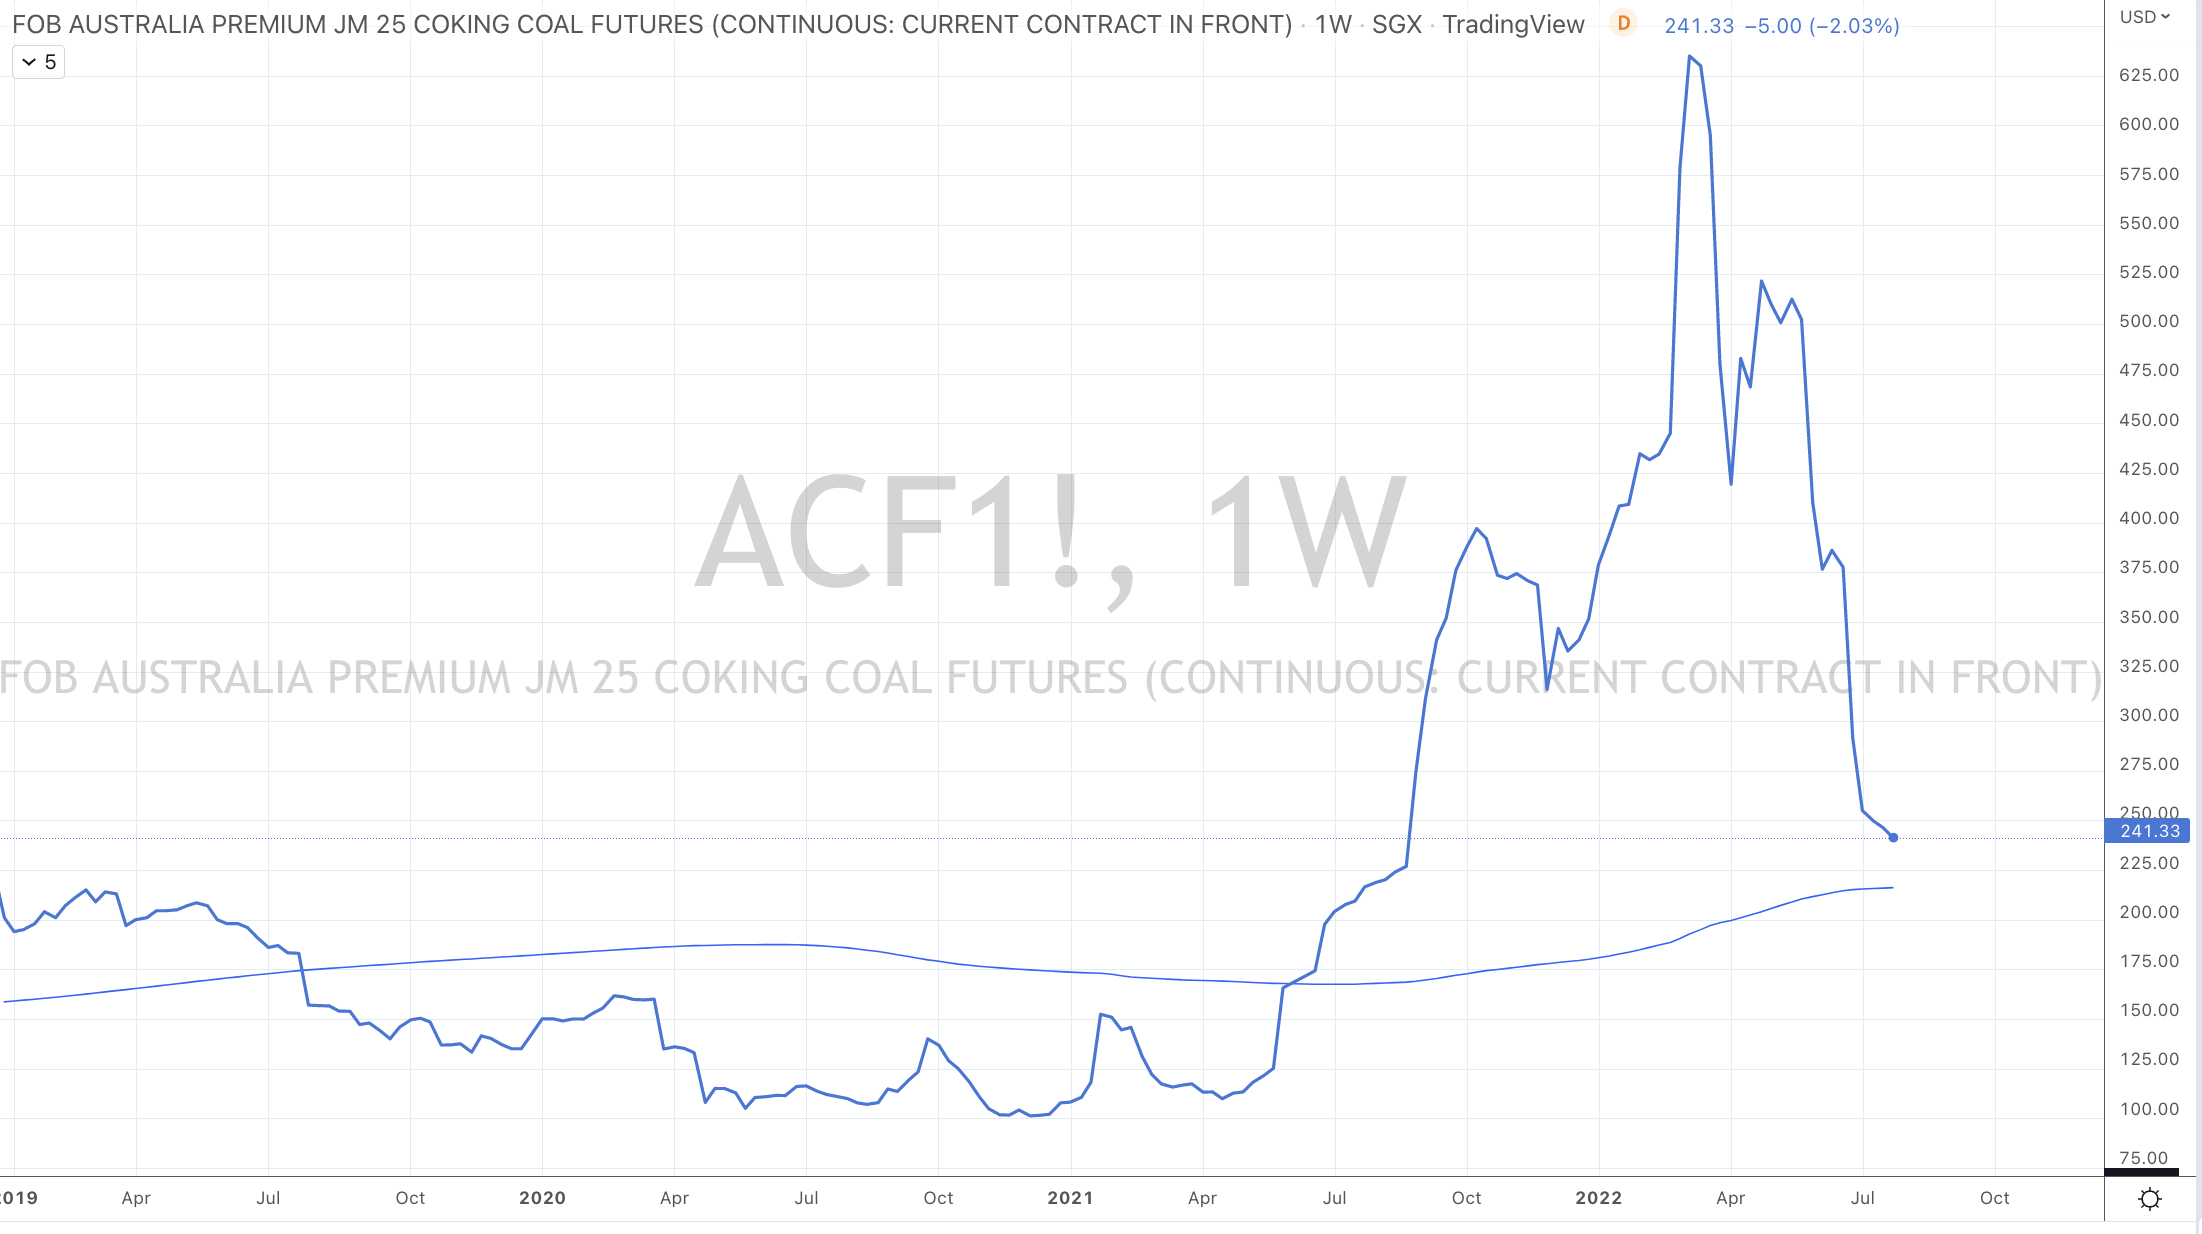
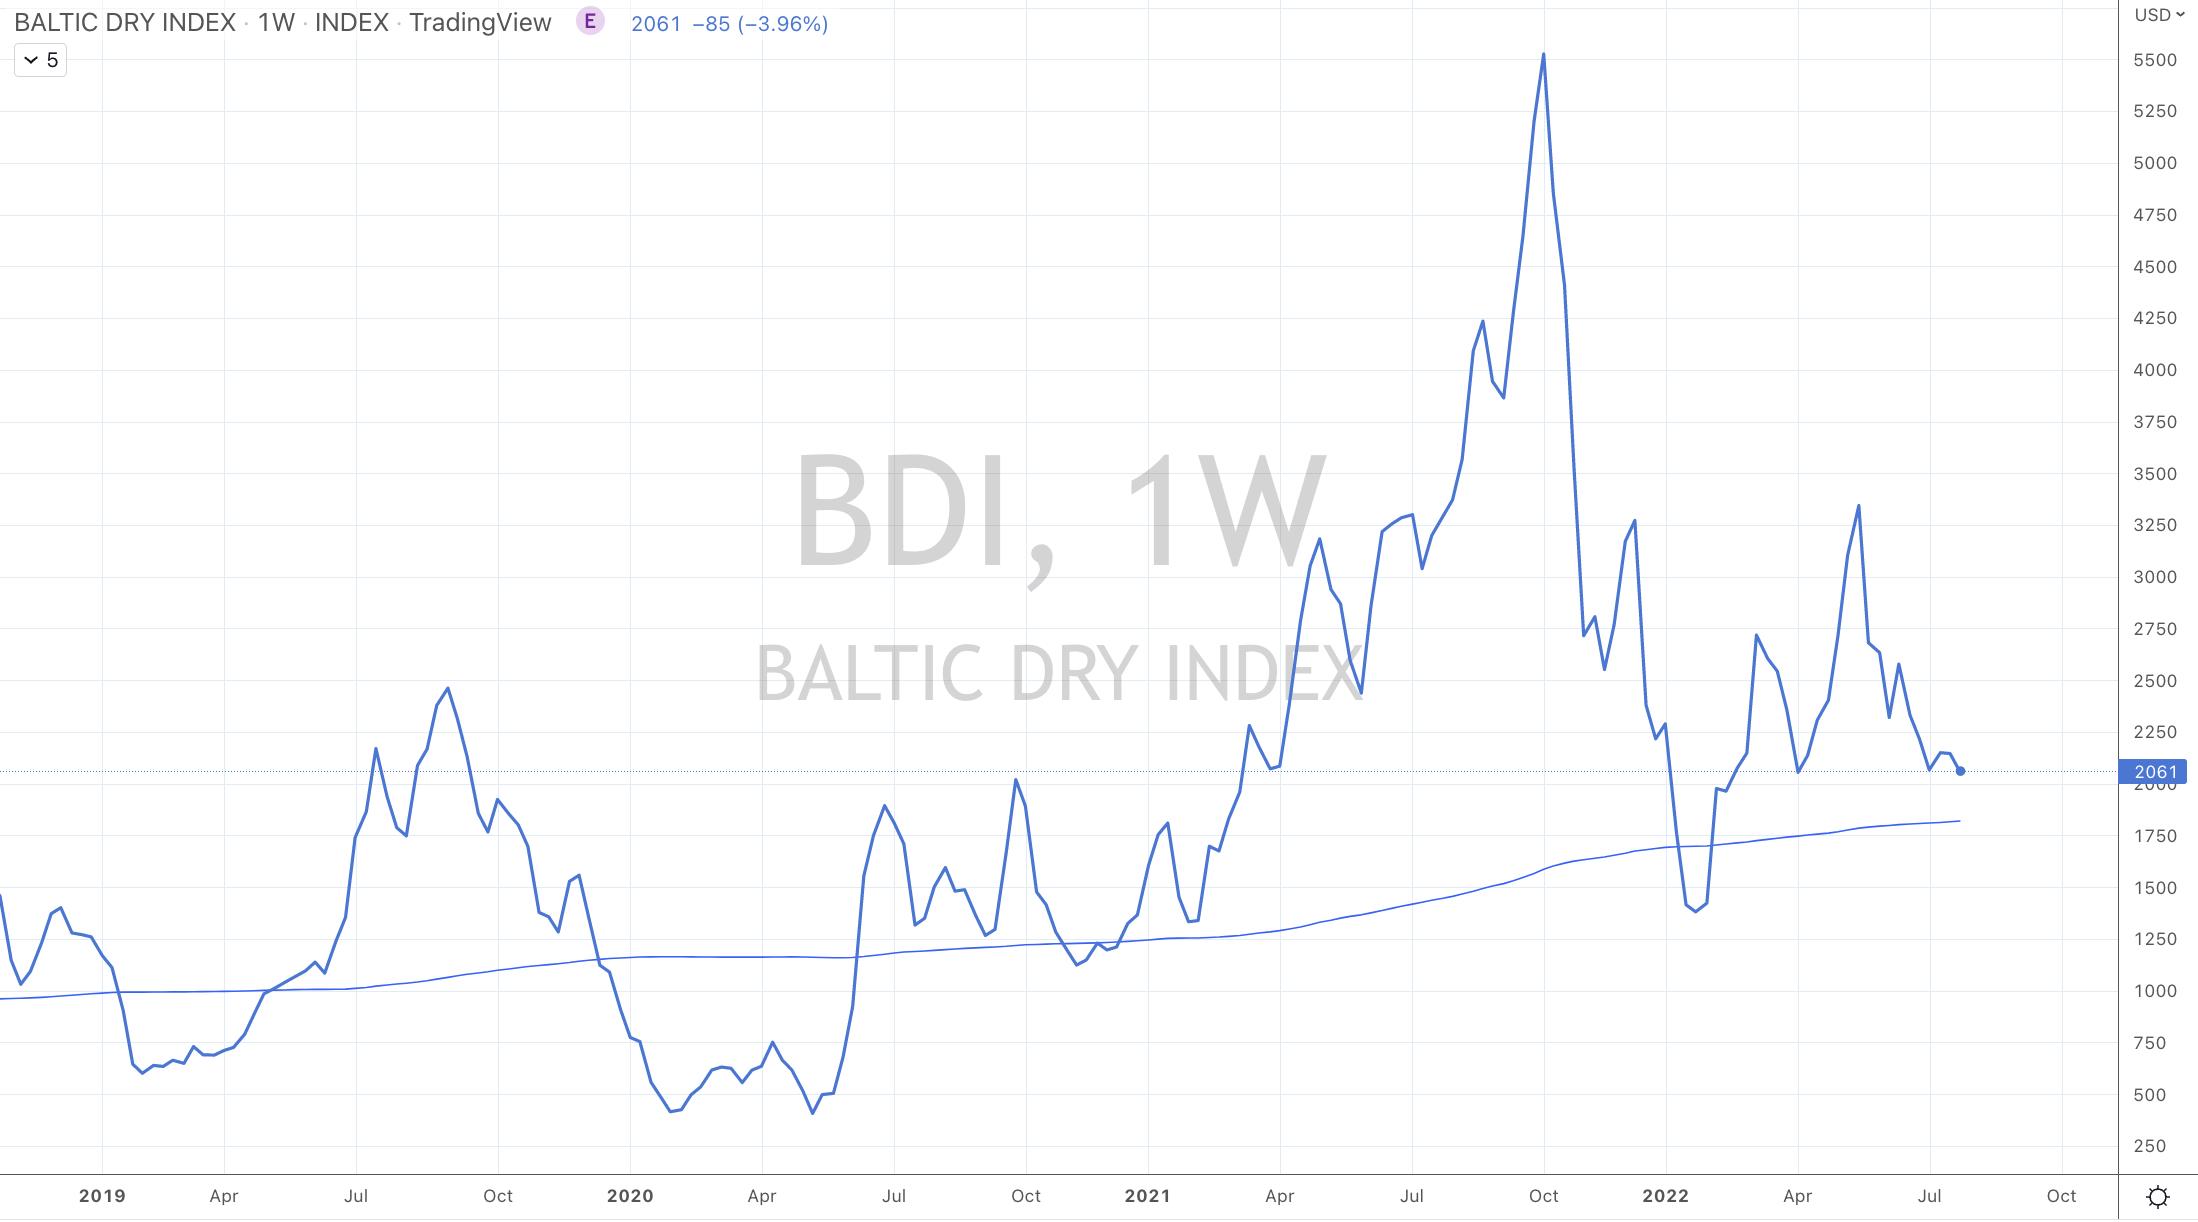
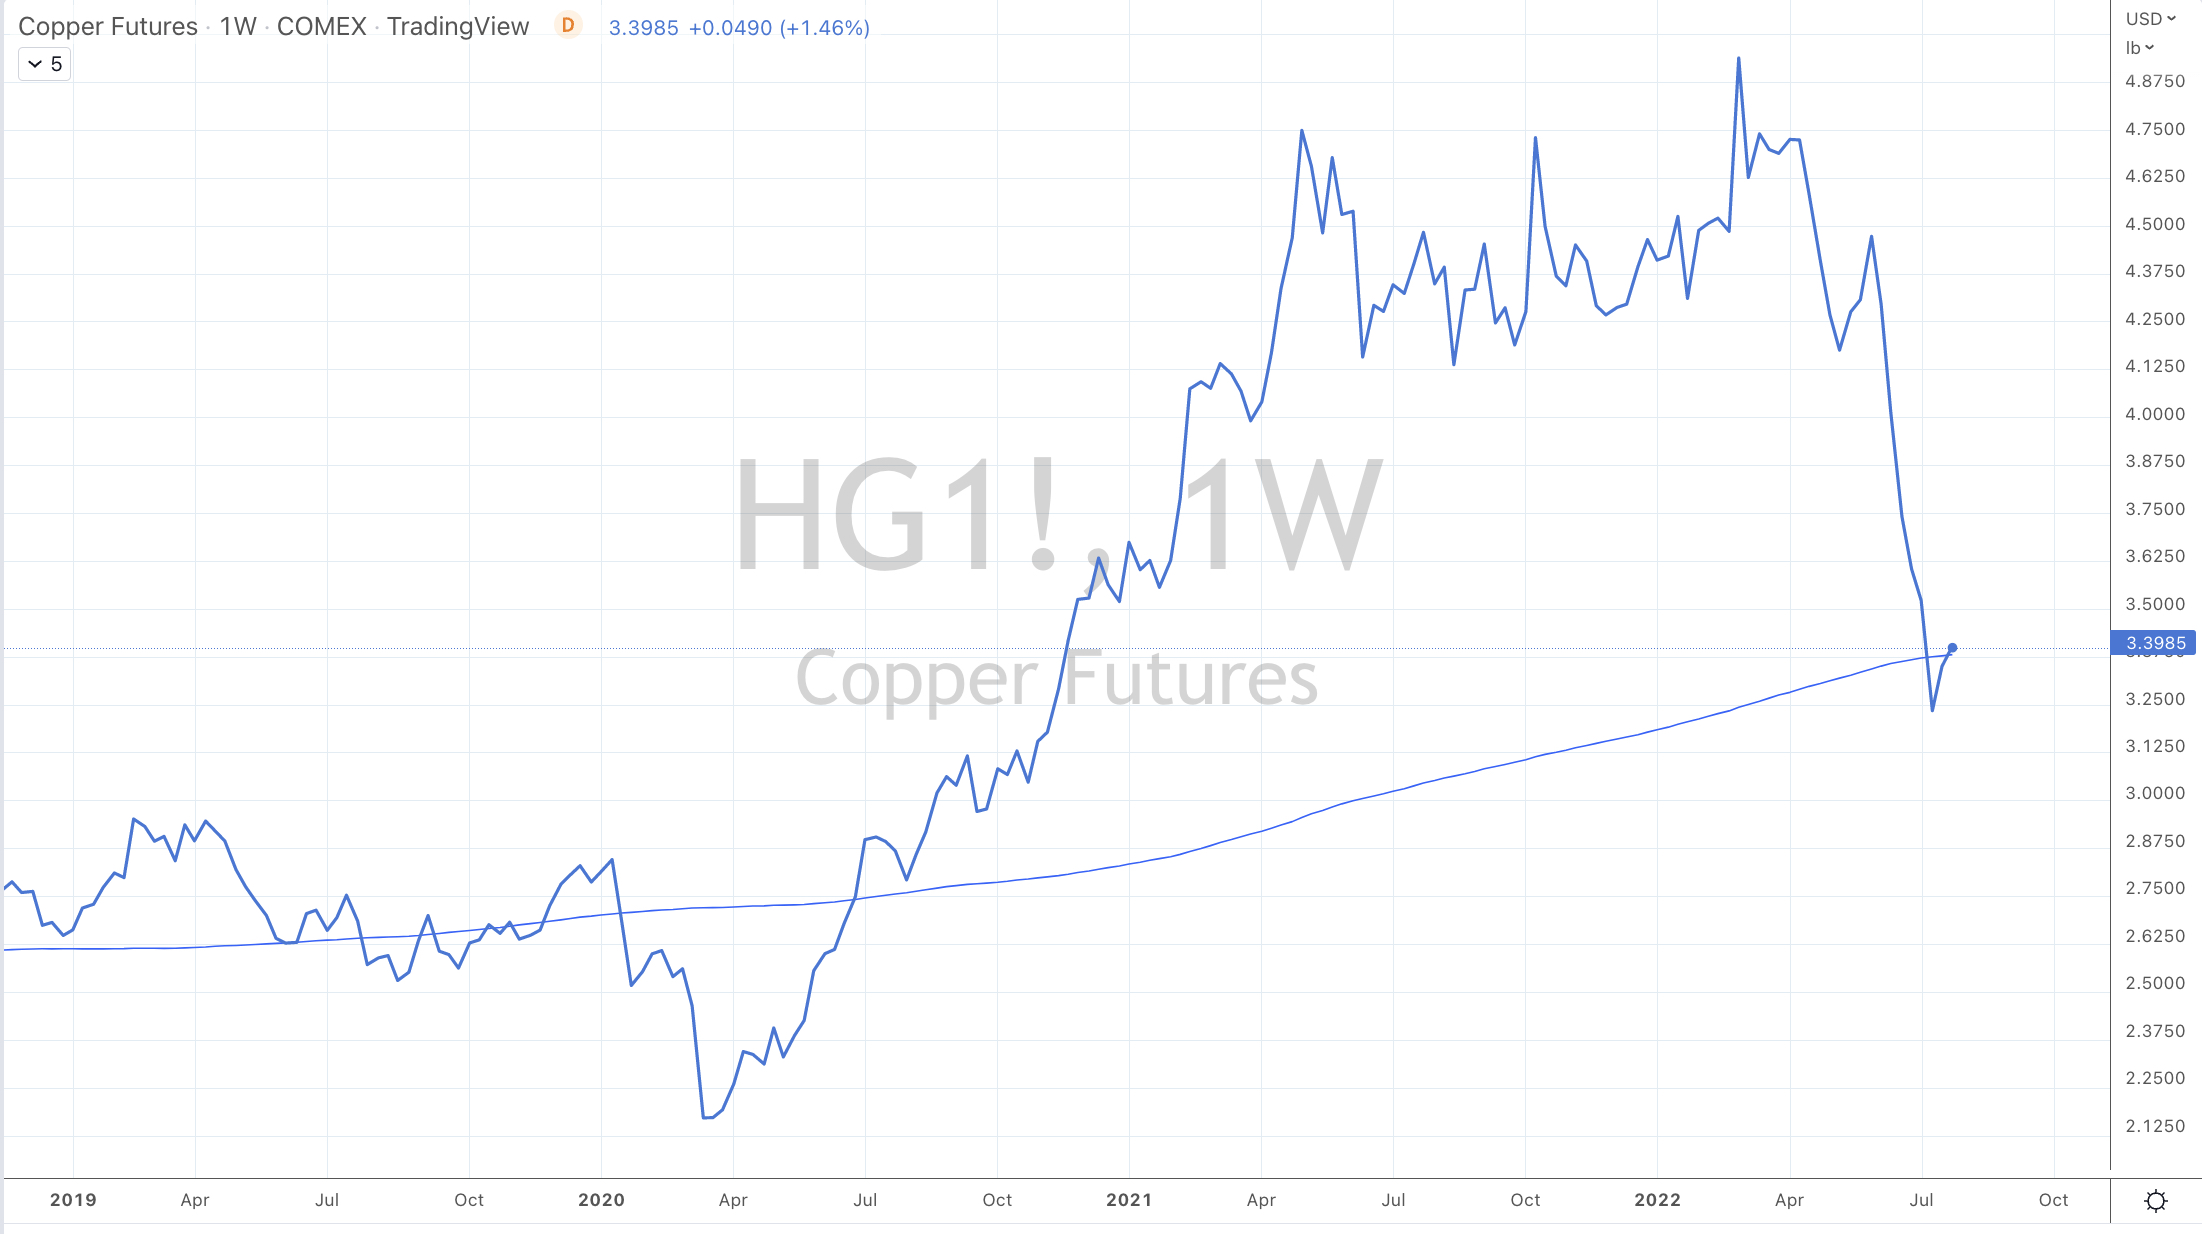
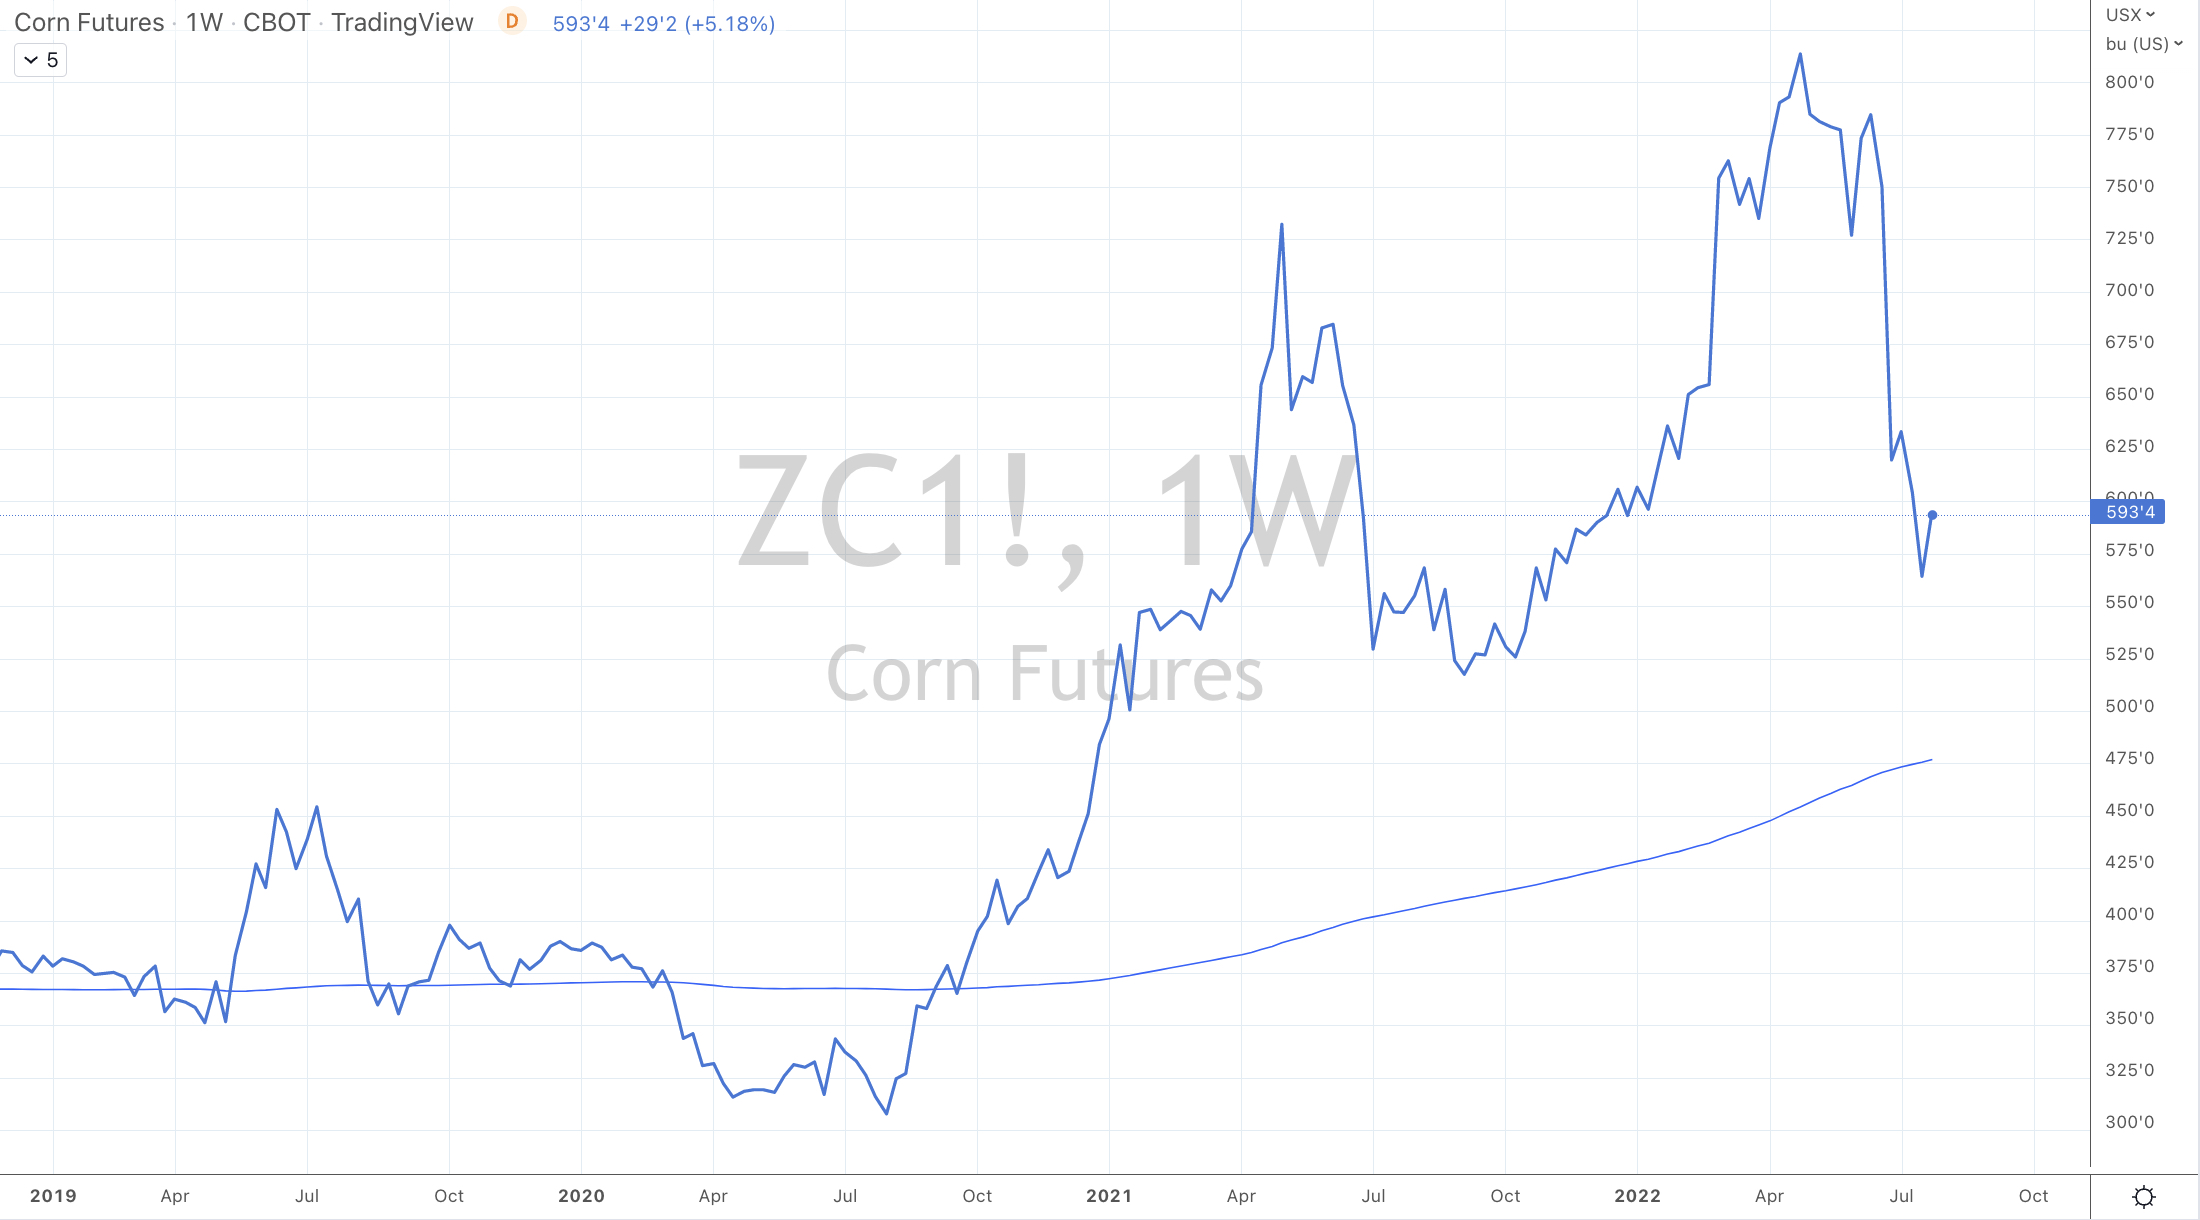
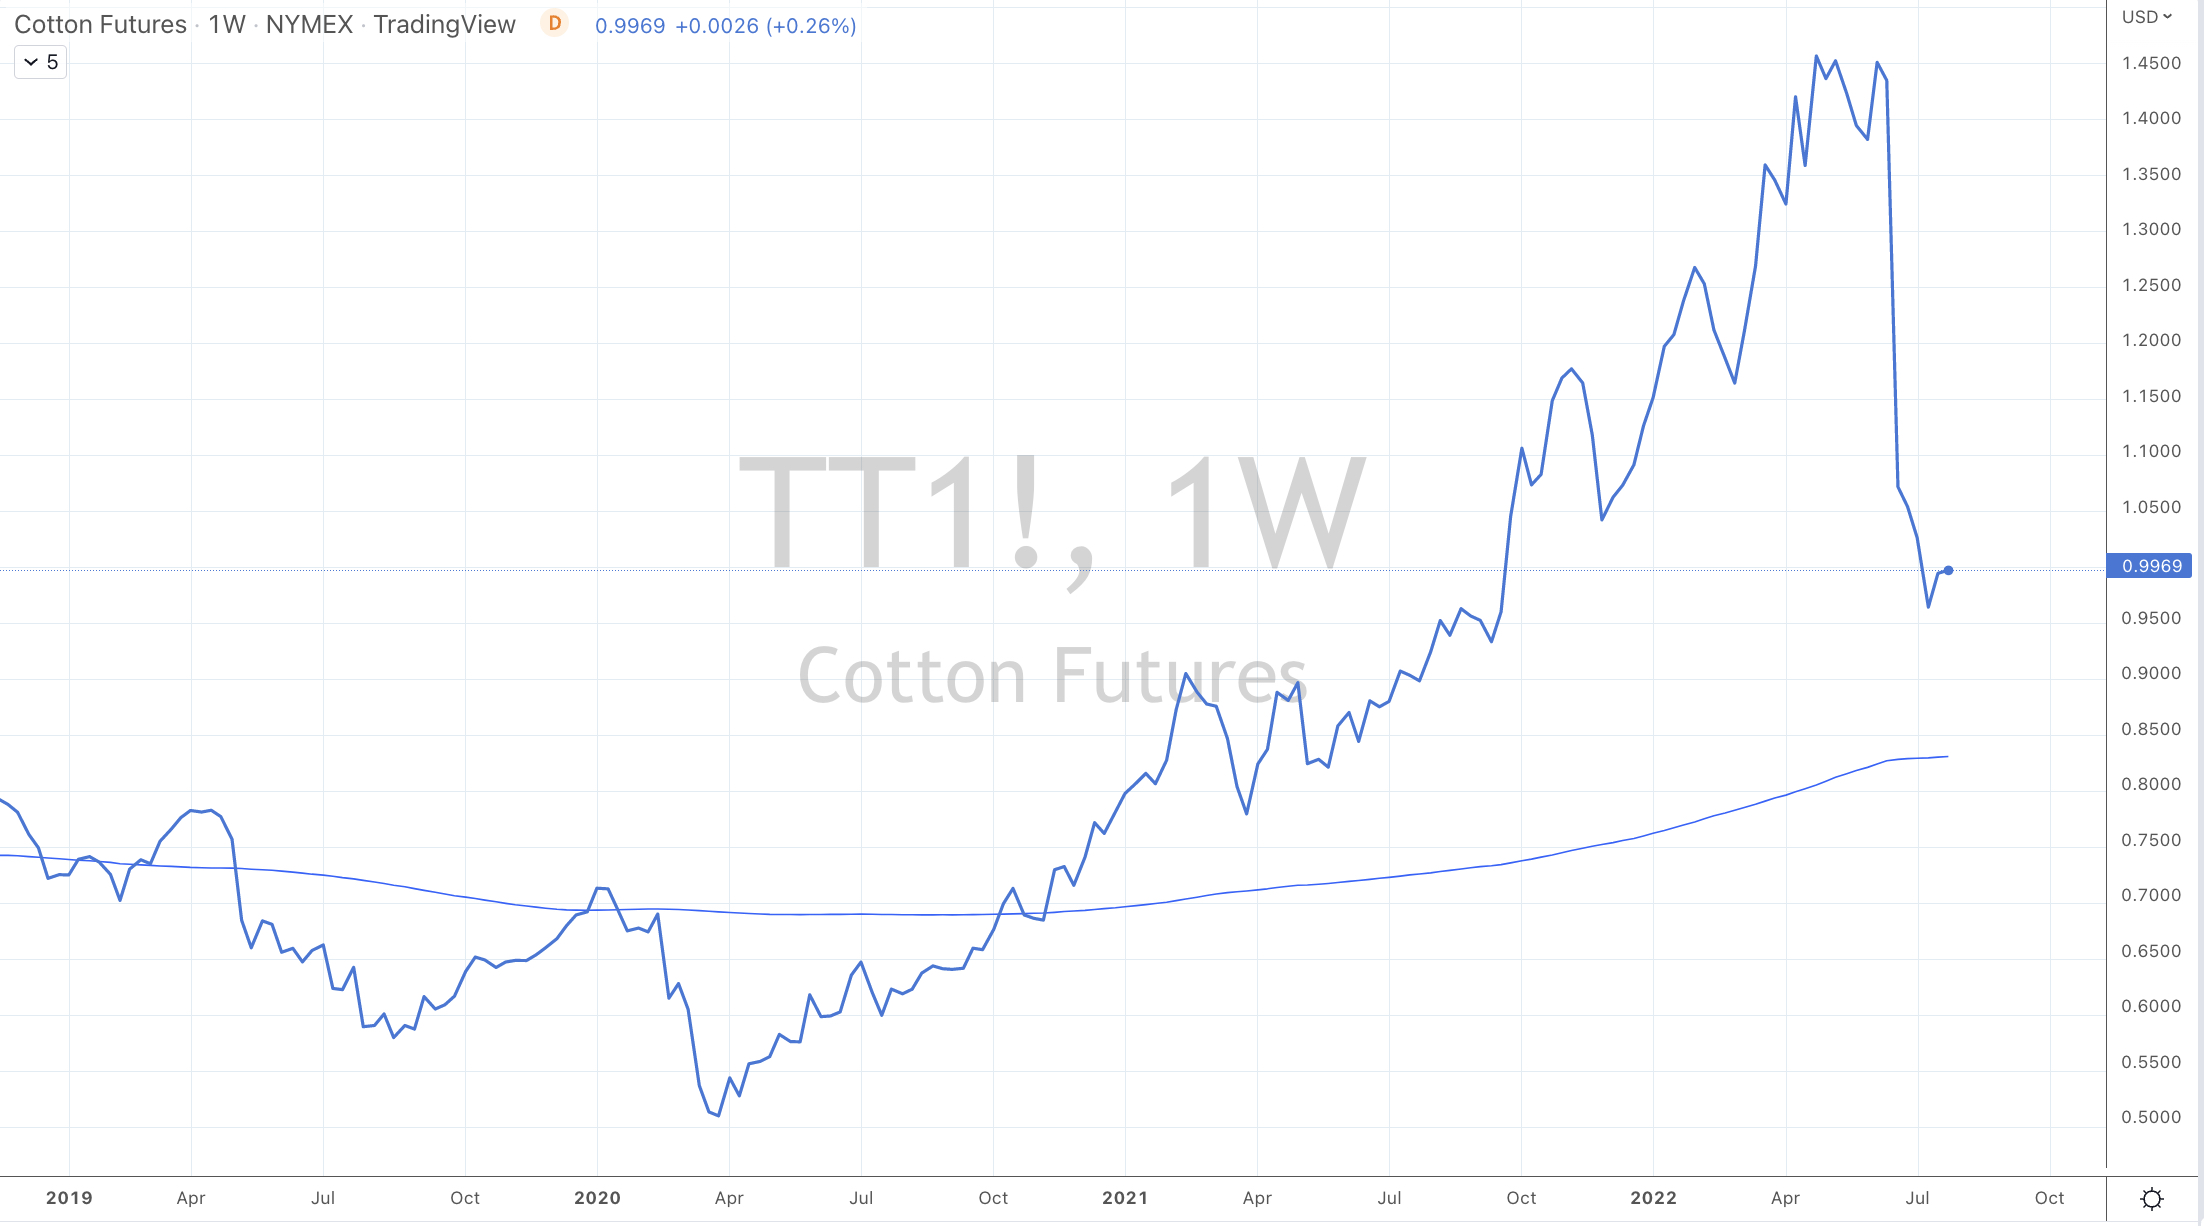
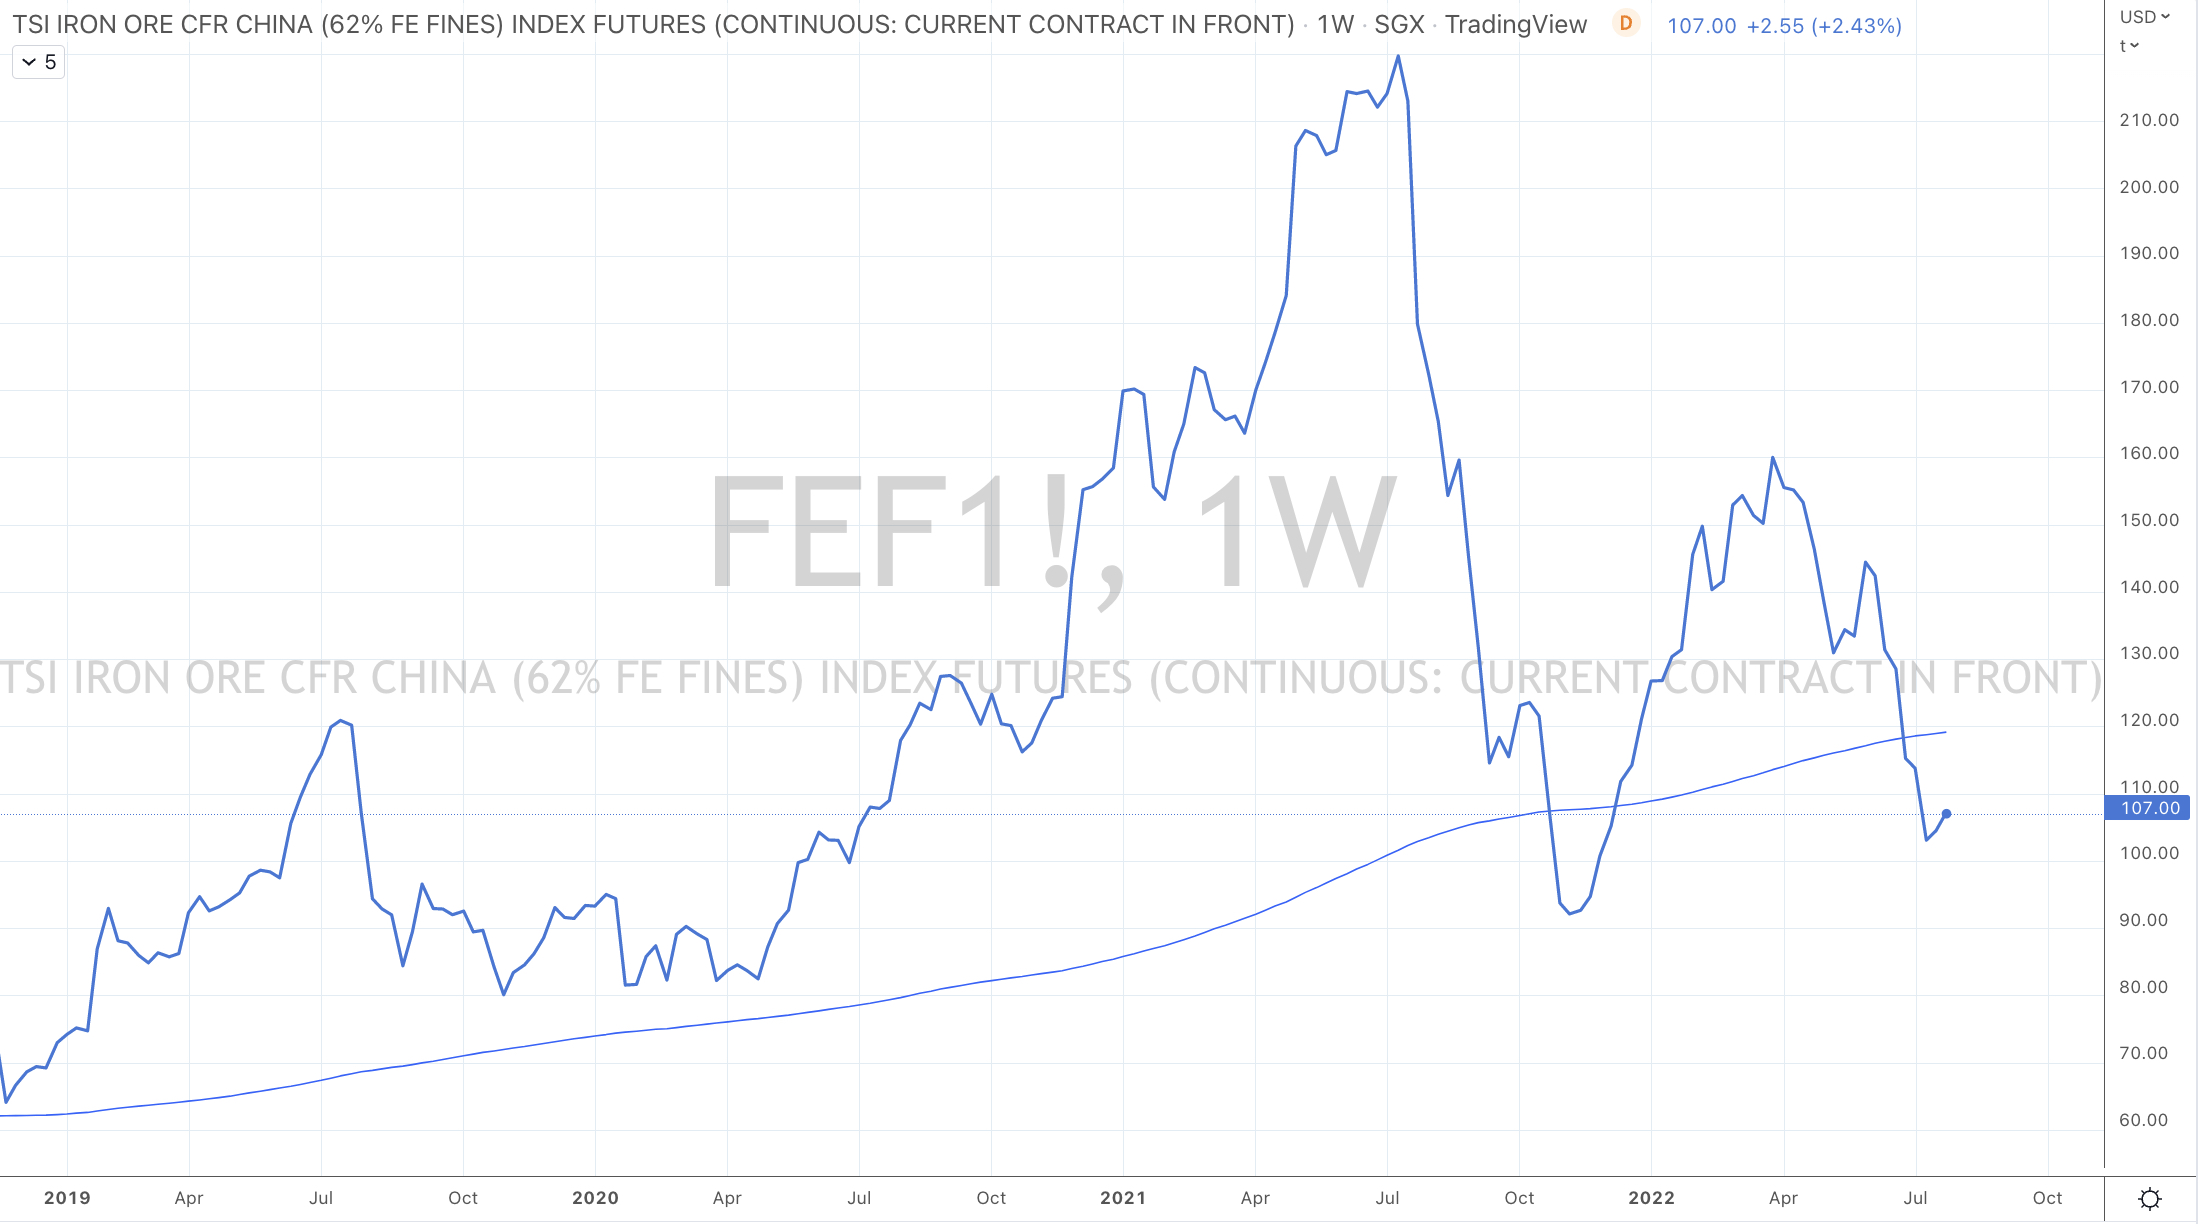
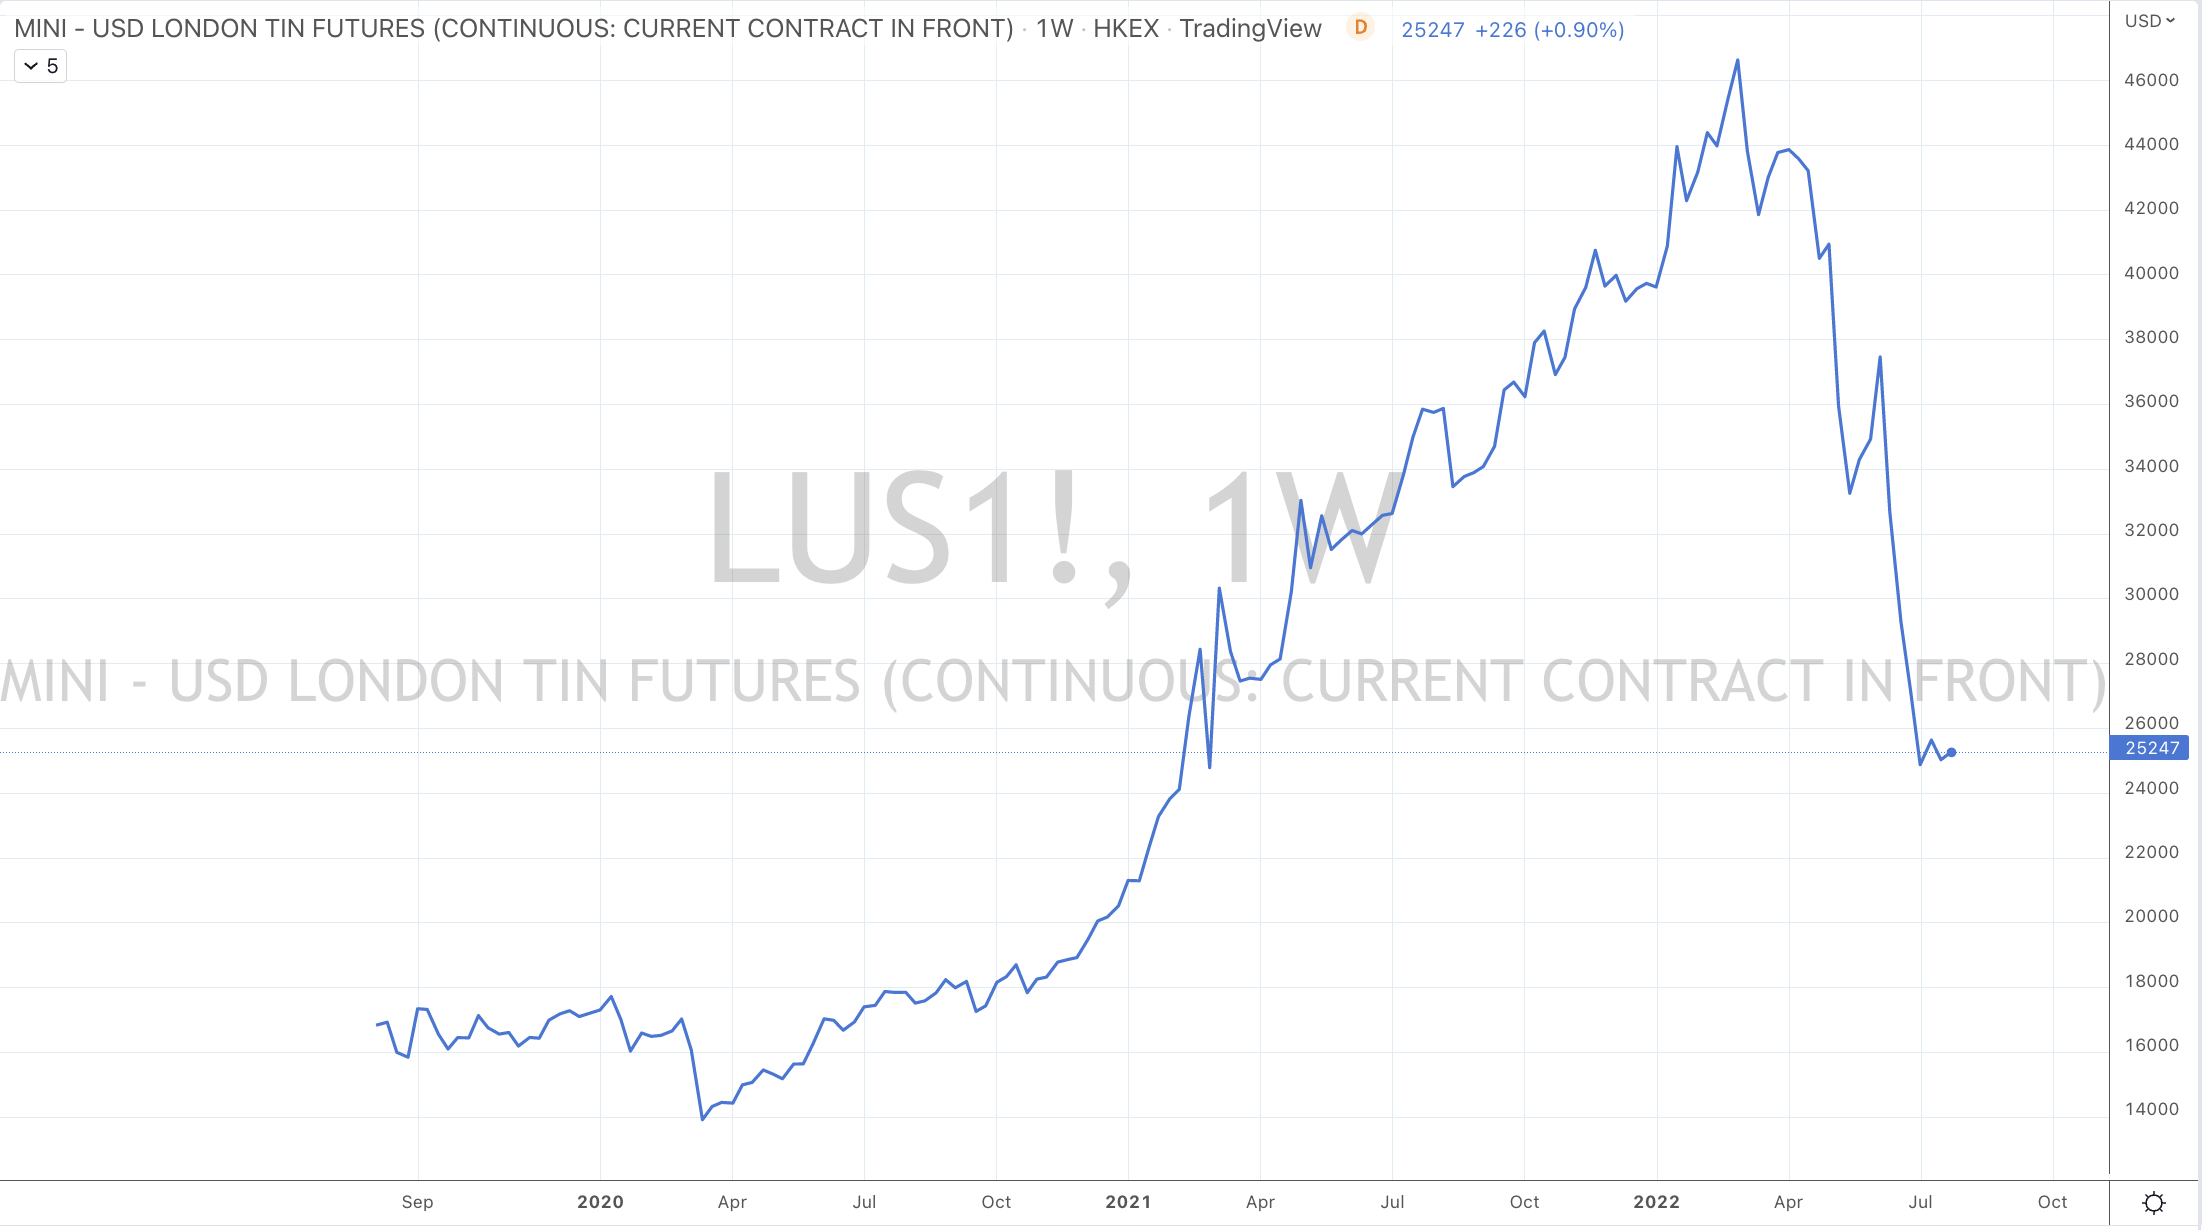
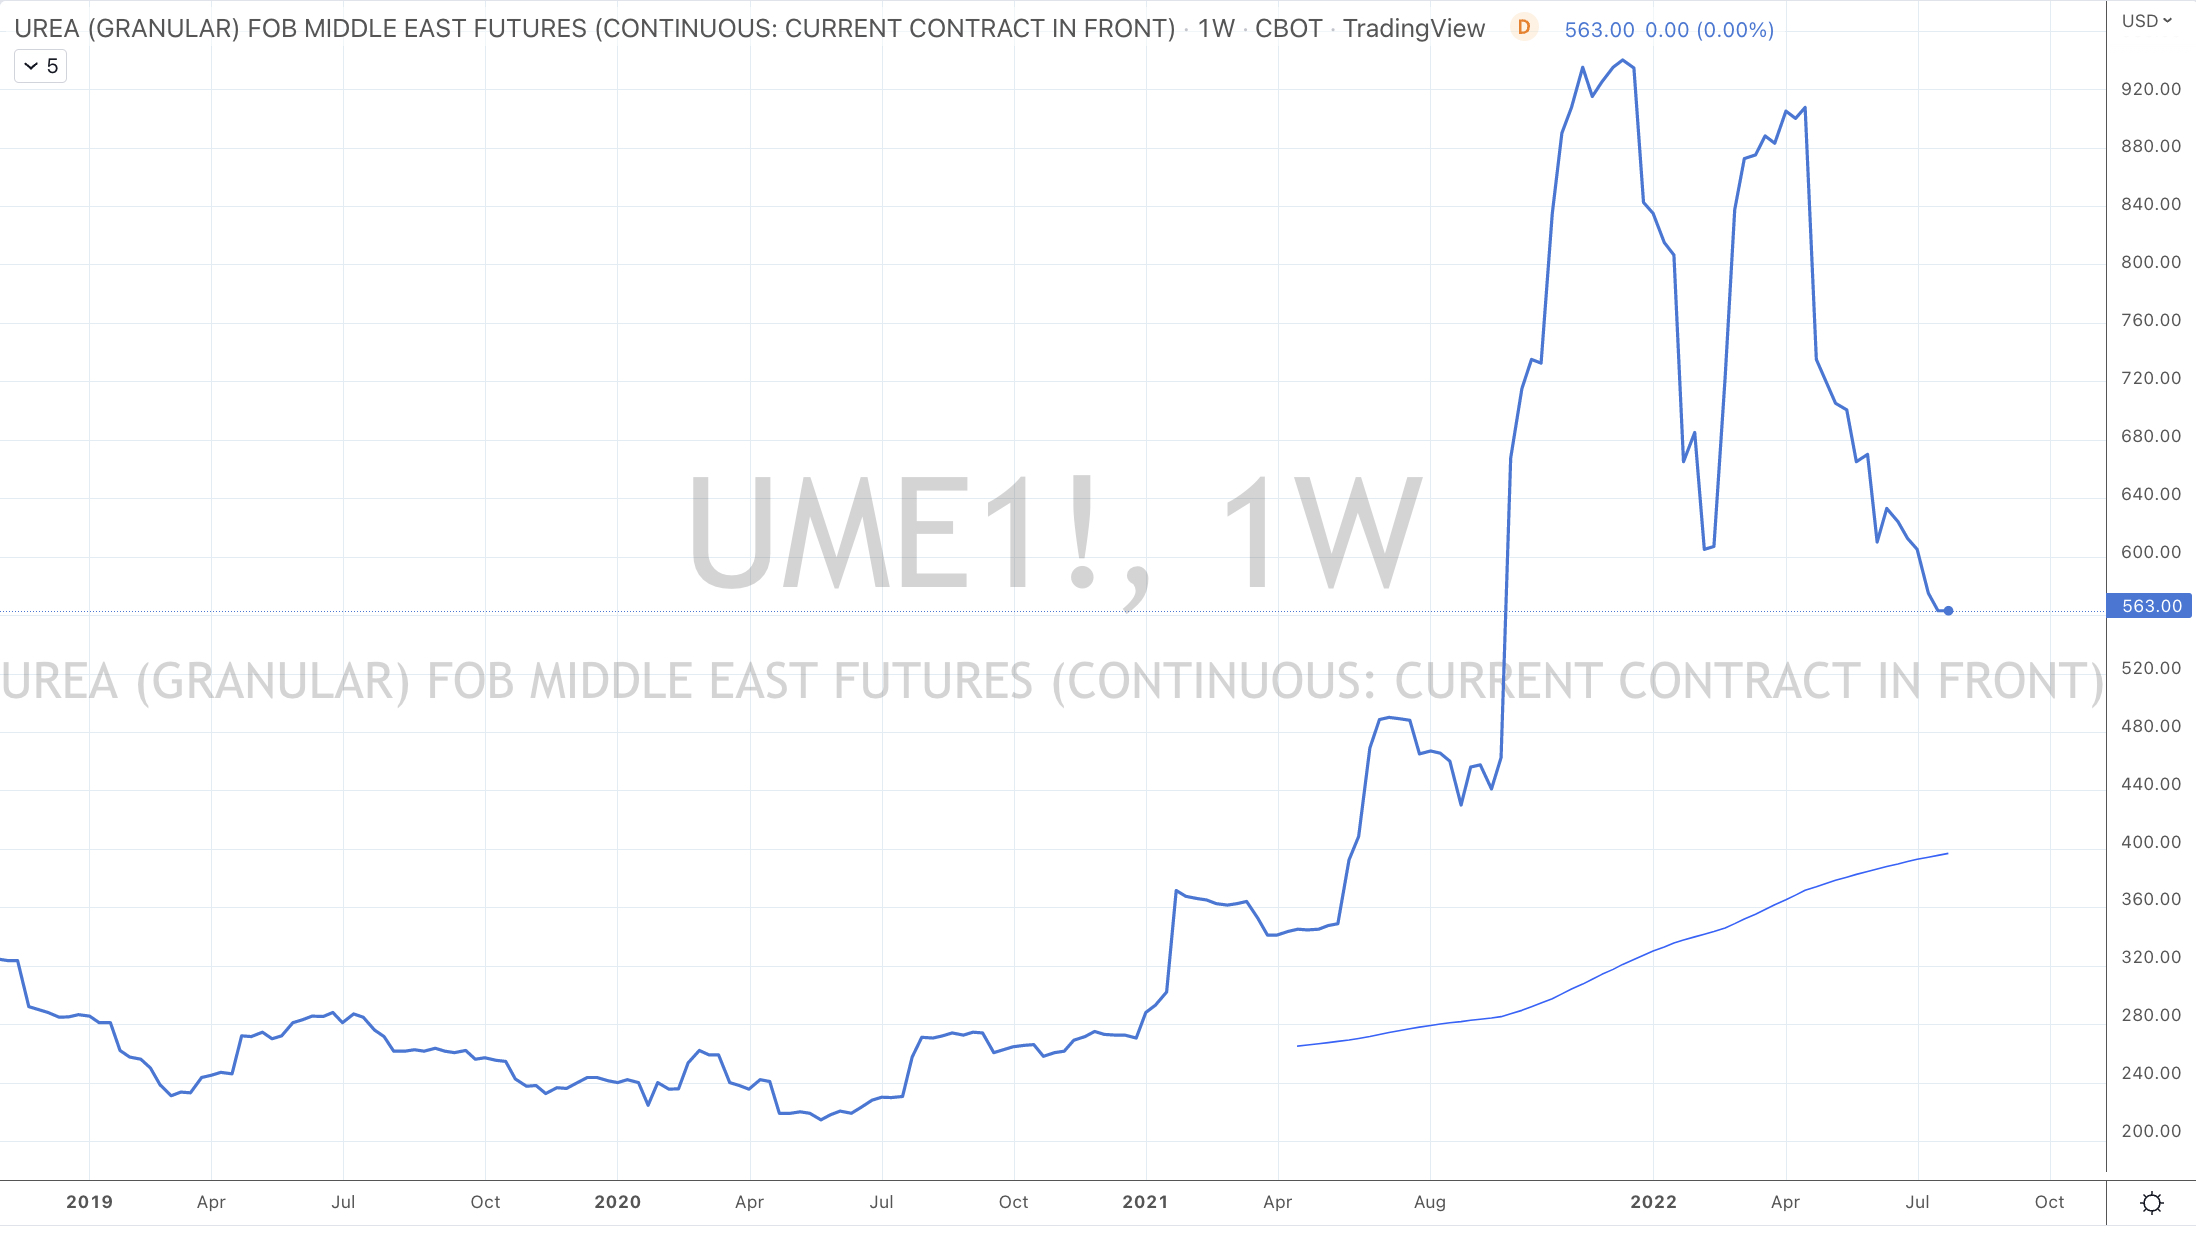
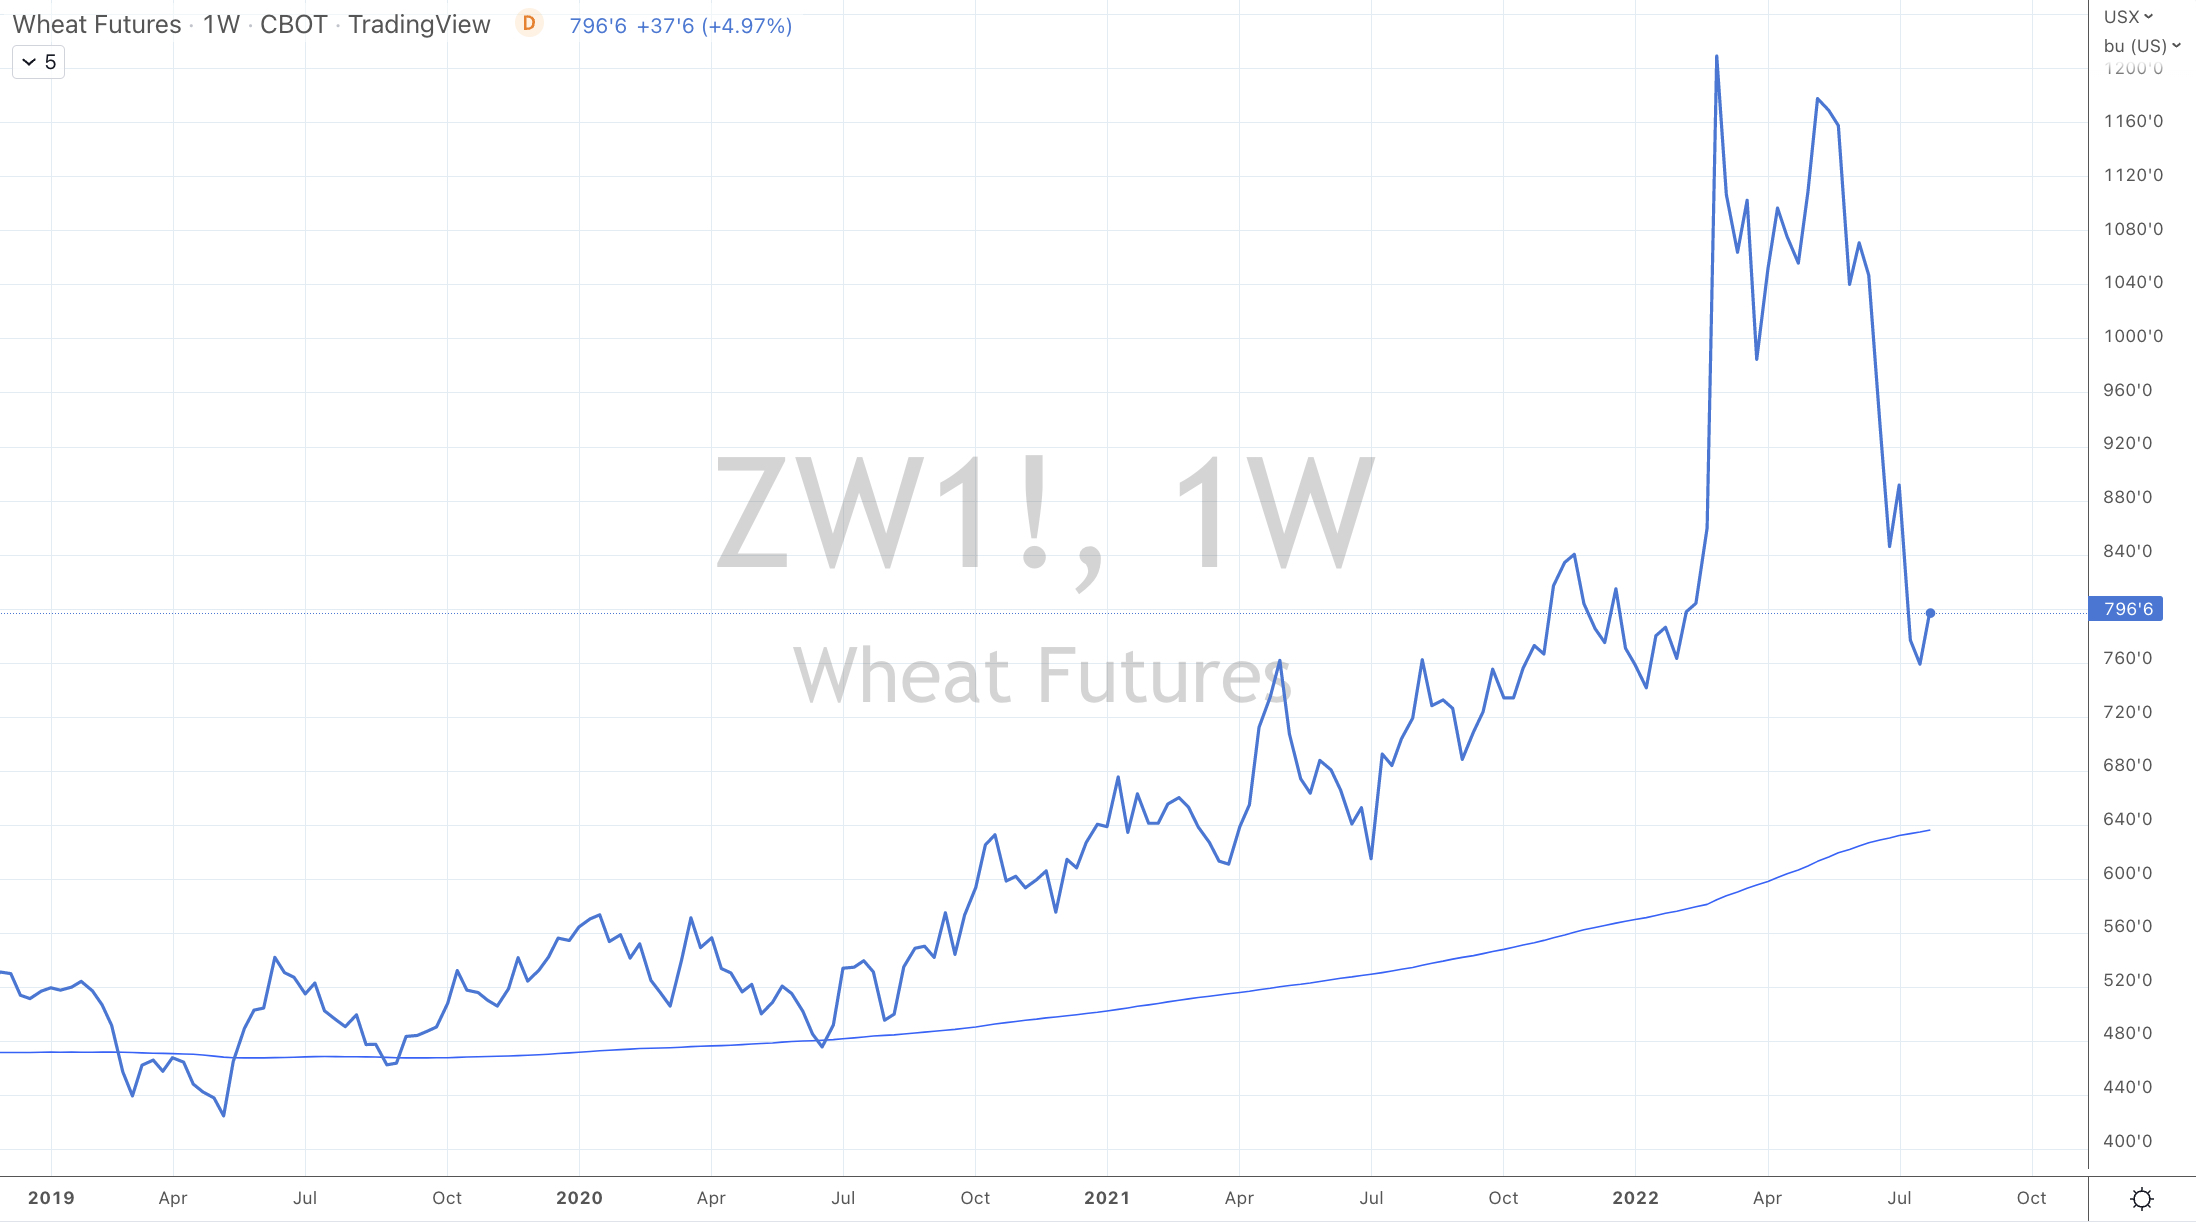
The assorted charts show the declines and mean reversions in commodities ranging from Wheat, Corn, Oats, Soybeans, Copper, Steel, Iron Ore, Australian Coking Coal, Silver, Urea, Tin, Nickel, Cotton, Aluminium and the Baltic Dry (shipping) Index.
These lower prices also equate to lower inputs for those buying at today’s price whilst buyers at higher prices are needing to move inventory of costlier produced product in the face of being undercut by latecomers or the patient.
July 27, 2022
by Rob Zdravevski
rob@karriasset.com.au


July 27, 2022 Leave a comment
“After you buy something you paid for, it doesn’t matter. People cling to the idea that at least they should get their money back; maybe there is bad news, and you should sell before it goes lower; maybe put it into something else where you get your money back, but people prefer to make it back where they lost it. People anchor numbers in their heads, and they hold on to them.”
– extract from recent Seth Klarman interview
July 27, 2022 Leave a comment
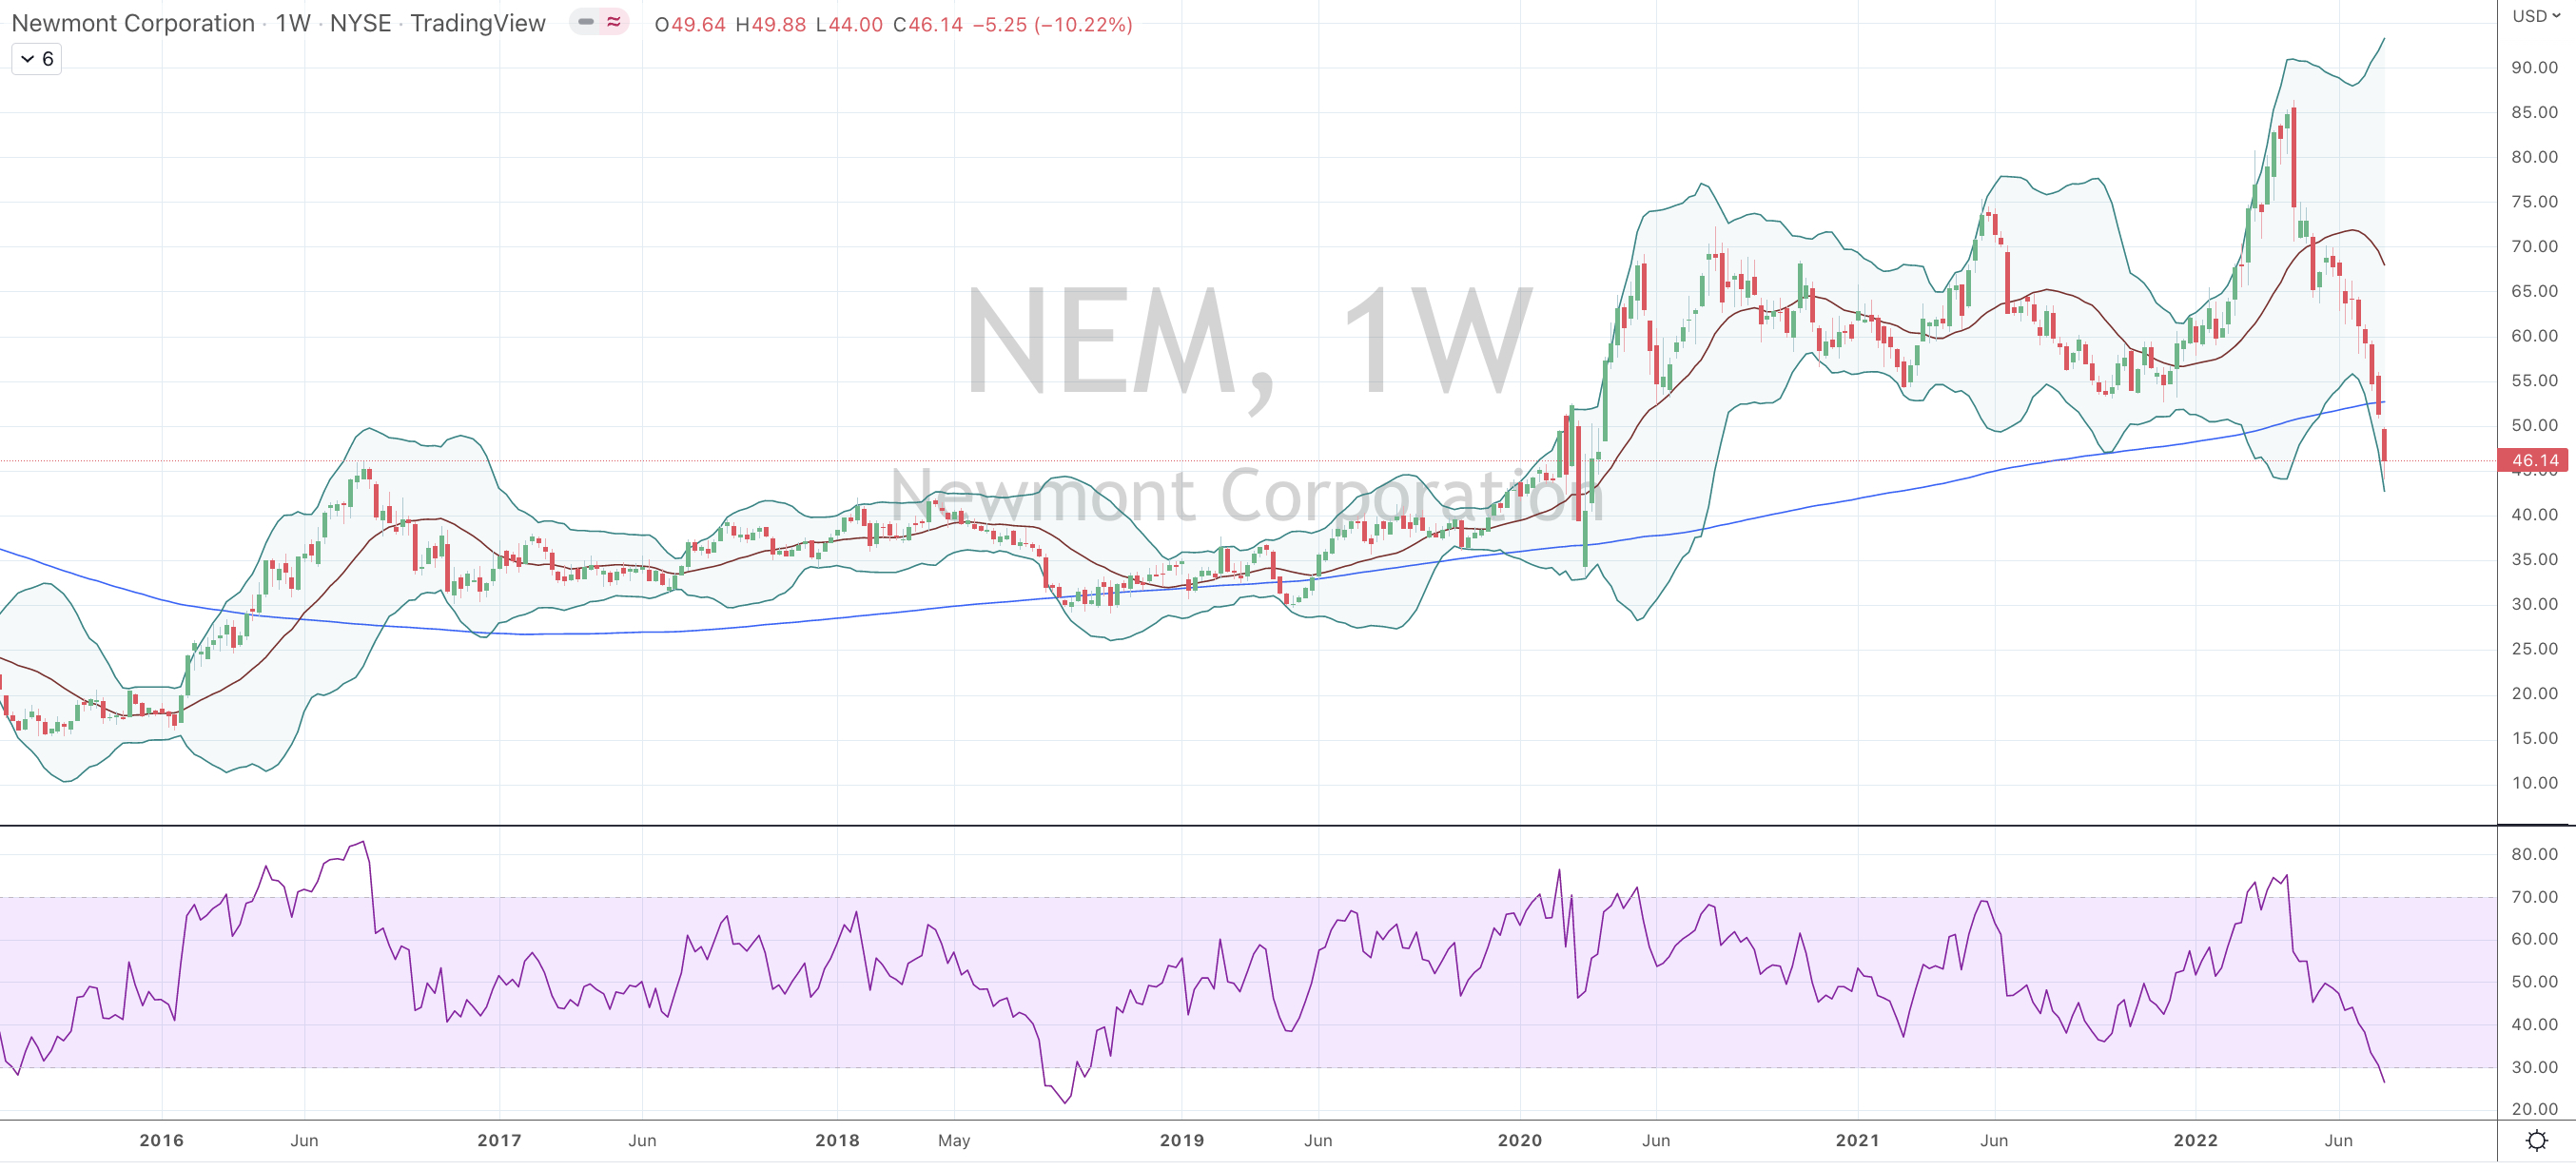
Yesterday, Newmont Mining’s (NEM:US) quarterly result was not well received by the stockmarket.
Its shares fell 13%.
I’ve been waiting for cheaper prices in Newmont Mining and has mentioned this is various writings, with the most recent post link attached.
A day later, NEM stock bounced 3.5%.
Its recent closing price is $46.14
Only 3 month ago, Newmont’s stock price was $86.
That was April 18th, 2022
Its market capitalisation was $66 billion.
On April 20th, 2022, I wrote this note, calling for Newmont’s stock price to ease.
An extract from that note was, “…….it’s plausible that Newmont uses its well priced equity to make some acquisitions or raise some capital itself.”
Today, it’s market cap is $35.4 billion
Now I’m wishing to buy the stock at $42.80.
Furthermore, we’ve seen 35% of the total shares outstanding (502 million) turnover since that April high.
While 300 million shares or 21% of its share issuance have traded in the past 9 weeks, which 8 of those weeks posted negative returns.
When coupled with the indicators on the chart below, I’d say we are looking a picture of exhaustion and cumulative amount of volume capitulation.
July 27, 2022
by Rob Zdravevski
rob@karriasset.com.au
July 26, 2022 Leave a comment
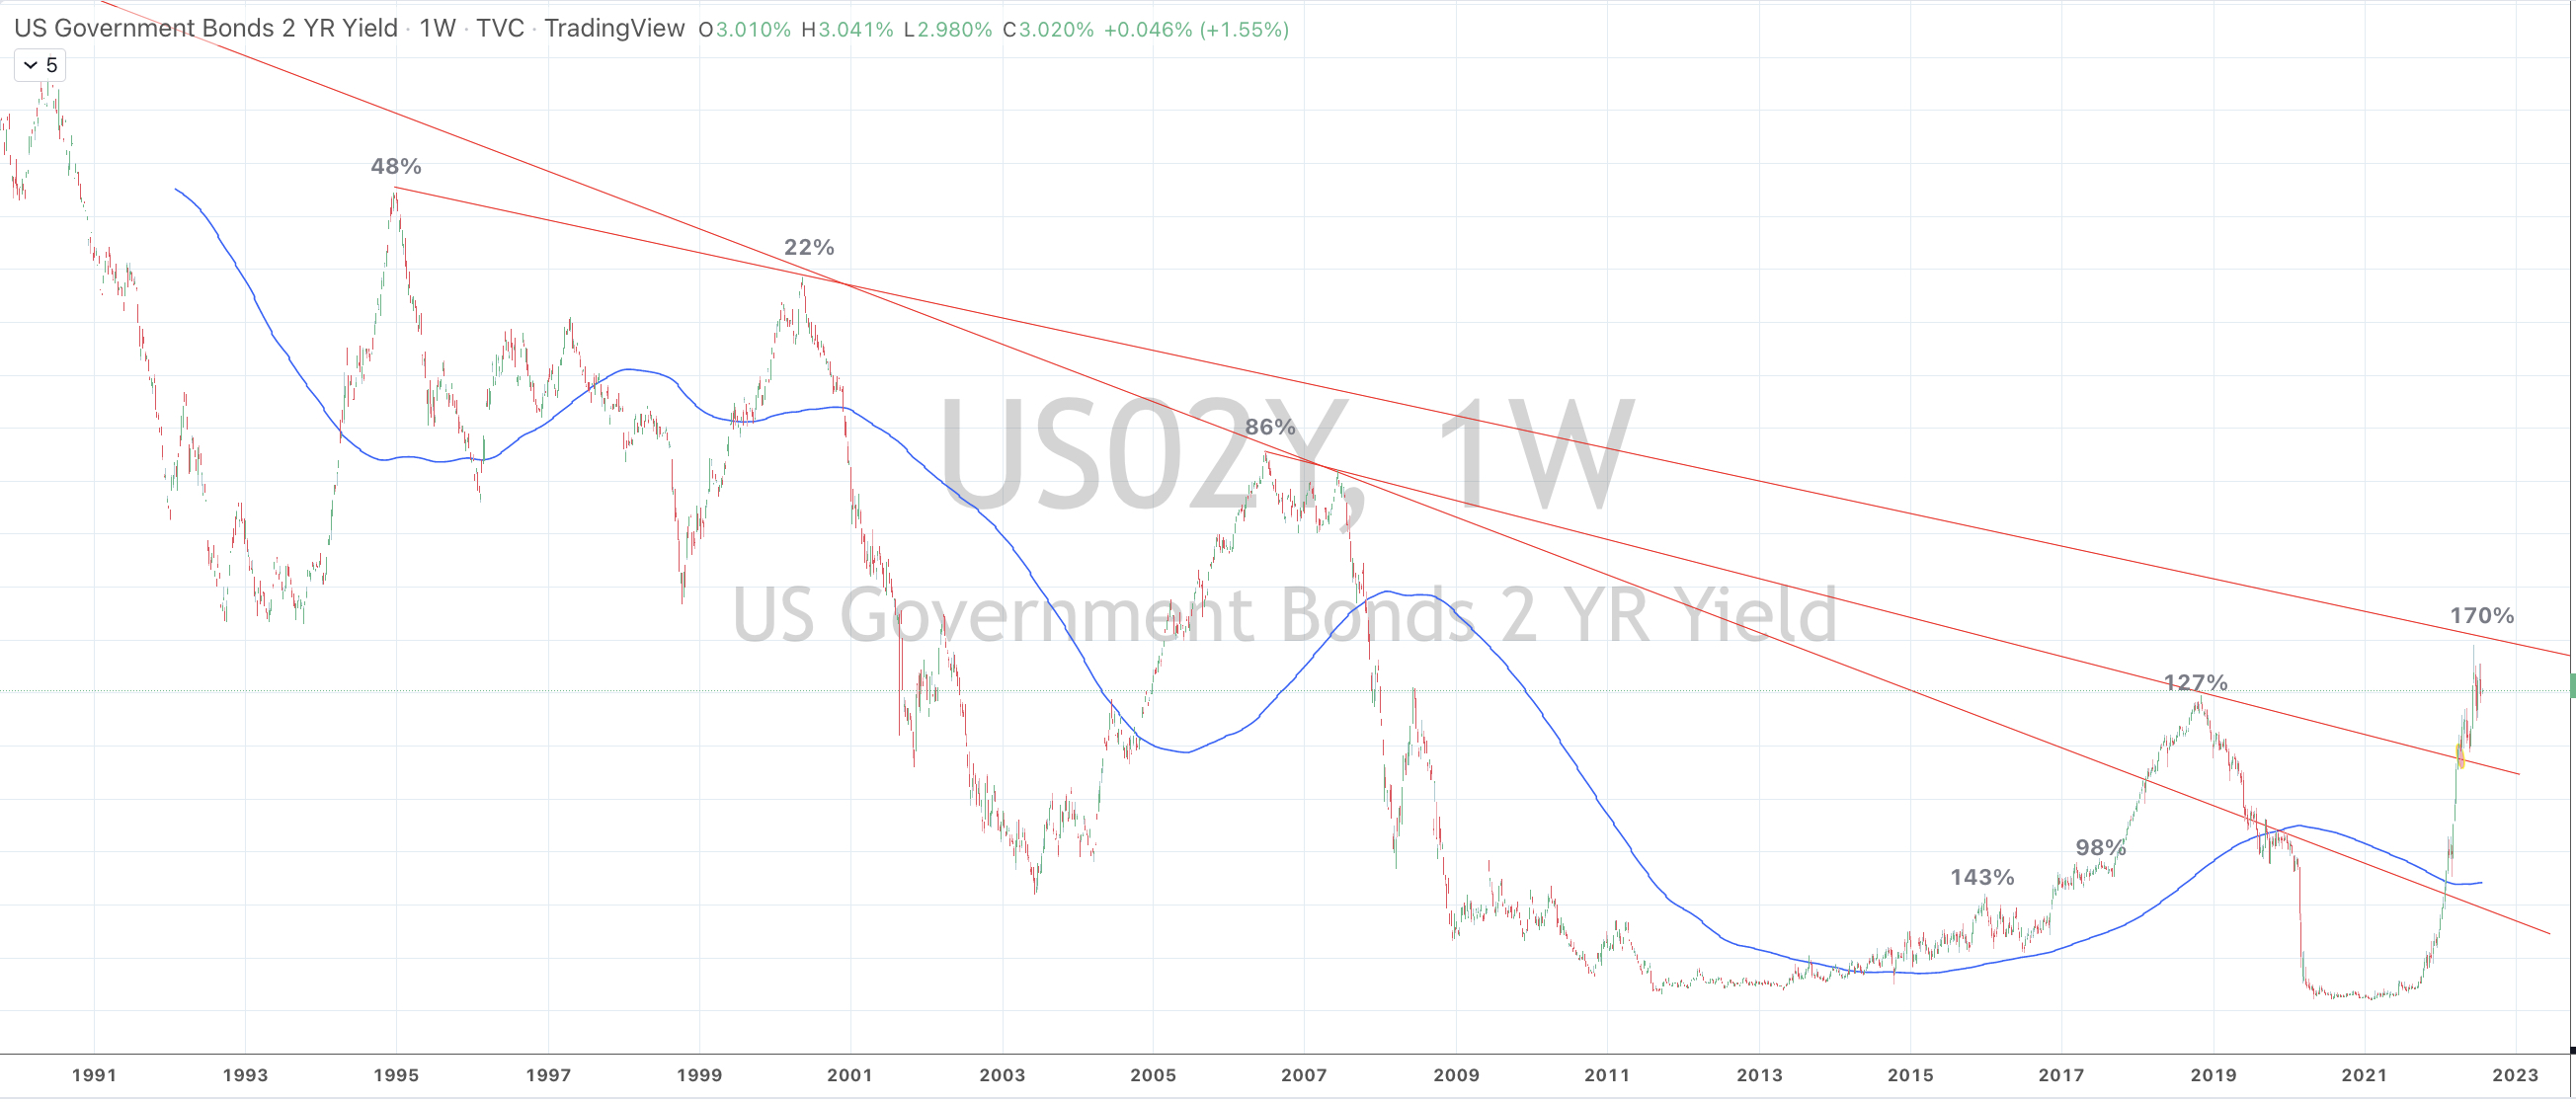
It’s not a solid of piece of analysis, but playing with the US 2 year government bond yield and the percentage it has traded above its 200 week moving average, while mean reversion beckons.
July 26,
by Rob Zdravevski
rob@karriasset.com.au
July 26, 2022 Leave a comment
Walmart just reported its latest quarterly earnings.
On Monday (July 26, 2022), the company said it needed more price cuts to pare inventories. The stock is trading 10% lower in the after-market.
“In May 2022, Walmart said it was sitting on over $60 billion of inventory at the end of the first quarter and promised “aggressive” price cuts on items such as apparel.”, said a Reuters report.
Inventories at general merchandise stores at the end of April were the highest since at least 2000, U.S. Census Bureau data showed.
My blog post on July 1, 2022 mentioned the risk of bloated inventories leading to discounting.
….while 6 weeks earlier, Reuters reported “Target Corp on Tuesday cut its quarterly profit margin forecast issued just weeks earlier, and said it would have to offer deeper discounts to clear inventory as decades-high inflation takes a toll on demand.”
Keep in mind that inventory turnover ratios are lagging indicators.
However, some perspective behind that large number of $60 billion of stock sitting in Walmart’s stores and warehouses actually equals 11% of Walmart’s revenue. Industry goals tend to aim for that ratio to sit between 5 and 10.
Walmart’s is usually around 7.5% and the 11% is the same level the company saw in 2013.
From a stock investors perspective, these types of announcements are also considered ‘good cleansing’ statements.
American companies and their management are good at doing this and taking decisive action.
European and Japanese executives tend to be more reluctant doing so.
Nevertheless, discounting is deflationary as are the lower (20%-40%) prices of many commodities already being seen over the past 2-3 months.
In turn, this will aid the moderation of interest rates, as I have alluded in this note written 4 days ago.
and perhaps this ‘designed’ mid-cycle slowdown culminates with this week’s Federal Reserve hike of 75 basis points, being considered a ‘dovish’ hike?
July 26, 2022
by Rob Zdravevski
rob@karriasset.com.au
July 25, 2022 Leave a comment
Only the 4th time in the past 15 years has AUD priced Silver simultaneously traded below its 200 week moving average and into Oversold territory on the Relative Strength Indicator (RSI).
First tranche is being accumulated at current A$26.93 region.
Probability of $25.40 being seen remains.
July 25, 2022
by Rob Zdravevski
rob@karriasset.com.au
July 24, 2022 Leave a comment
The following assets (on a weekly timeframe) registered an Overbought or Oversold reading and/or have traded more than 2.5 standard deviations above or below its rolling mean.
Extremes “above” the Mean (at least 2.5 standard deviations)
AUD/GBP
Overbought (RSI > 70)
Brazil 10 year government bond yields
The Overbought Quinella – Both Overbought and Traded at > 2.5 standard deviations above the weekly mean)
None
Extremes “below” the Mean (at least 2.5 standard deviations)
U.S. 10 year minus U.S. 5 year government bond yield
Gold in AUD
Corn
Oversold (RSI < 30)
Hot Rolled Coiled Steel
Copper
Tin
Silver (in USD)
Silver (in AUD)
INR/USD
JPY/USD
KRW/USD
IDR/USD
The Oversold Quinella – Both Overbought and Traded at > 2.5 standard deviations above the weekly mean)
None
Notes & Ideas:
This past week’s biggest news was the rally in equities, the decline in the USD and the continued decline in agricultural and energy commodities.
Wheat has fallen 40% over the past 2 months and is now at its lowest close since January 10, 2022 which is well below the price when Russia invaded Ukraine.
While Corn is at its lowest price since November 8, 2021.
Other mean reversion being seen in Gasoil is on its way. It fell 4% for the week even following a 4% rebound on Friday alone. This diesel fuel was mentioned in this recent post.
Bonds caught a bid and saw yields fall, as they move back to some ‘normalisation’.
The IEF and TLT bond ETF’s rose 1.4% and 2.1%. Quite a good weekly result of a government bond fund.
The U.S. yield curve remains inverted for the 4th week in a row and Oversold for 2 consecutive weeks while the U.S. 5 year minus 3 month yield spread hit my Oversold Trifecta.
In equities, I’m reflecting on my previous comments pondering ‘what if the lows (in equities) have already been seen”?
Past posts have highlighted the extreme lows seen in various U.S. indices such as the Russell 2000, the Smallcap 600, S&P 500 and the Nasdaq. Since their June 16, 2022 intra-day lows, these indices have risen between 10% and 12%.
On June 7, 2022, I suggested that Natural Gas was trading at the mother of all peaks’.
It fell 34% from $9.45 to $6.22 within 14 days. The post below prompted the closing of that position and taking the ‘fat part of the trade’. That was on June 26, 2022.
This past week, Natural Gas rose 18% and it is now 33% higher in the past month.
There is indeed merit in taking the ‘fat part of the trade’.
Today, it’s no mans land and I don’t see a trade.
We saw a weakening in a persistently strong USD.
The Aussie rallied 2% agains the USD.
The hoo-ha about the Euro touching parity didn’t actually mean much. EUR/USD is at 1.02 today.
The Copper/Gold Ratio bounced out of Oversold territory, nor is the GBP/USD or the SEK which rallied 2.5% against the USD.
The Yen remains weak and the Indian Rupeee and Chilean Peso are trading at all-time lows.
Crude posted its lowest weekly close since the Ukraine invasion, which is 5 months to the day.
Recents posts about bourses in Taiwan, South Korea and Germany being Oversold saw the corrective action with 3% rallies.
And last week, I wrote about Gold and Silver nearing their Oversold regions and Silver in AUD at $26.50 would be an interesting entry point. It’s low for the week was $26.54.
The larger advancers over the past week comprised of;
Aluminium 4.3%, Bloomberg Commodity Index 2.7%, Hogs 4%, Copper 3.6%, JKM LNG 7.5%, Coffee 3.5%, Cattle 1.8%, Natural Gas 18.3%, Palladium 10.4%, Platinum 4.4%, Cotton 3.1%, Brent Crude 2.8%, Rice 2.1%, AEX 4.9%, KBW Banking Index 2.1%, CAC 3%, DAX 3%, Dow Jones Industrials 2%, DJ Transports 4.5%, HSCEI 2.1%, Bovespa 2.5%, KOSPI 2.7%, S&P Midcap 400 4%, Nasdaq 100 3.5%, Nikkei 4.2%, Sensex 4.3%, Oslo 3.8%, Copenhagen 4.2%, Helsinki 2.7%, Stockholm 4%, Russell 2000 3.6%, Philadelphia Semiconductor Index 5.5%, S&P 500 2.6%, Singapore STI 2.7%, TAIEX 2.7%, Nasdaq Transports 5.1%, ASX 200 2.8%, Toronto’s TSX 3.2%, S&P Smallcap 600 4.2%, Nasdaq Composite 3.3%.
The group of decliners included;
Rotterdam Coal (2.3%), WTI Crude Oil (3%), Gasoil (4%), Heating Oil (6.6%), LNG (6.6%), Tin (2.1%), Sugar (7.1%), Urea (2.1%), Silver in AUD (2.4%), Corn 6.6%, Oats (2.9%), Soybeans (3%), Wheat (2.3%) and the Nasdaq Biotechnology Index fell 1.6%.
July 24, 2022
by Rob Zdravevski
rob@karriasset.com.au
July 22, 2022 Leave a comment
In January 2022, the Australian 2 year government bond was yielding 0.40%.
The Reserve Bank of Australia’s (RBA) cash rate was 0.10%.
7 months later, the yield in the Aussie 2’s rose 9-fold, up to a recent high of 3.50%.
Today, they are 2.97%.
‘Shorting’ bonds and long commodities was your inflation trade. That’s all over now.
Now, the RBA’s cash rate is 1.35% which is a 13-fold increase from that January 2022 rate.
The designed and manufactured mid cycle slowdown is working for them.
I don’t think the RBA increases rates to anything close to 2%.
Commodity prices have been falling and I’m expecting an inventory ‘discounting’ war which will aide the abating or moderation of inflation.
The prices of assets in various markets are telling me that inflation has peaked.
This means, I think interest rates also decline.
I’ll look for the Australian 2 year government bond yield to move lower towards the 1.50% – 1.60% range over time. It won’t occur in straight line, however probability of a mean reversion increases notably following parabolic price rises.
Arguably, you don’t want to fix your borrowing costs.
A move lower in interest rates is inherently positive for equity prices (more so for technology stocks) along with bond prices.
Although it bodes poorly for oil prices, many commodities and generally, the Australian Dollar.
By the way, Lower oil prices are good for overall corporate earnings as are cheaper commodity ‘inputs’.
And keep in mind that Copper has already declined 35% and usually leads the direction of credit market yields.
July 22, 2022
by Rob Zdravevski
rob@karriasset.com.au

July 21, 2022 Leave a comment
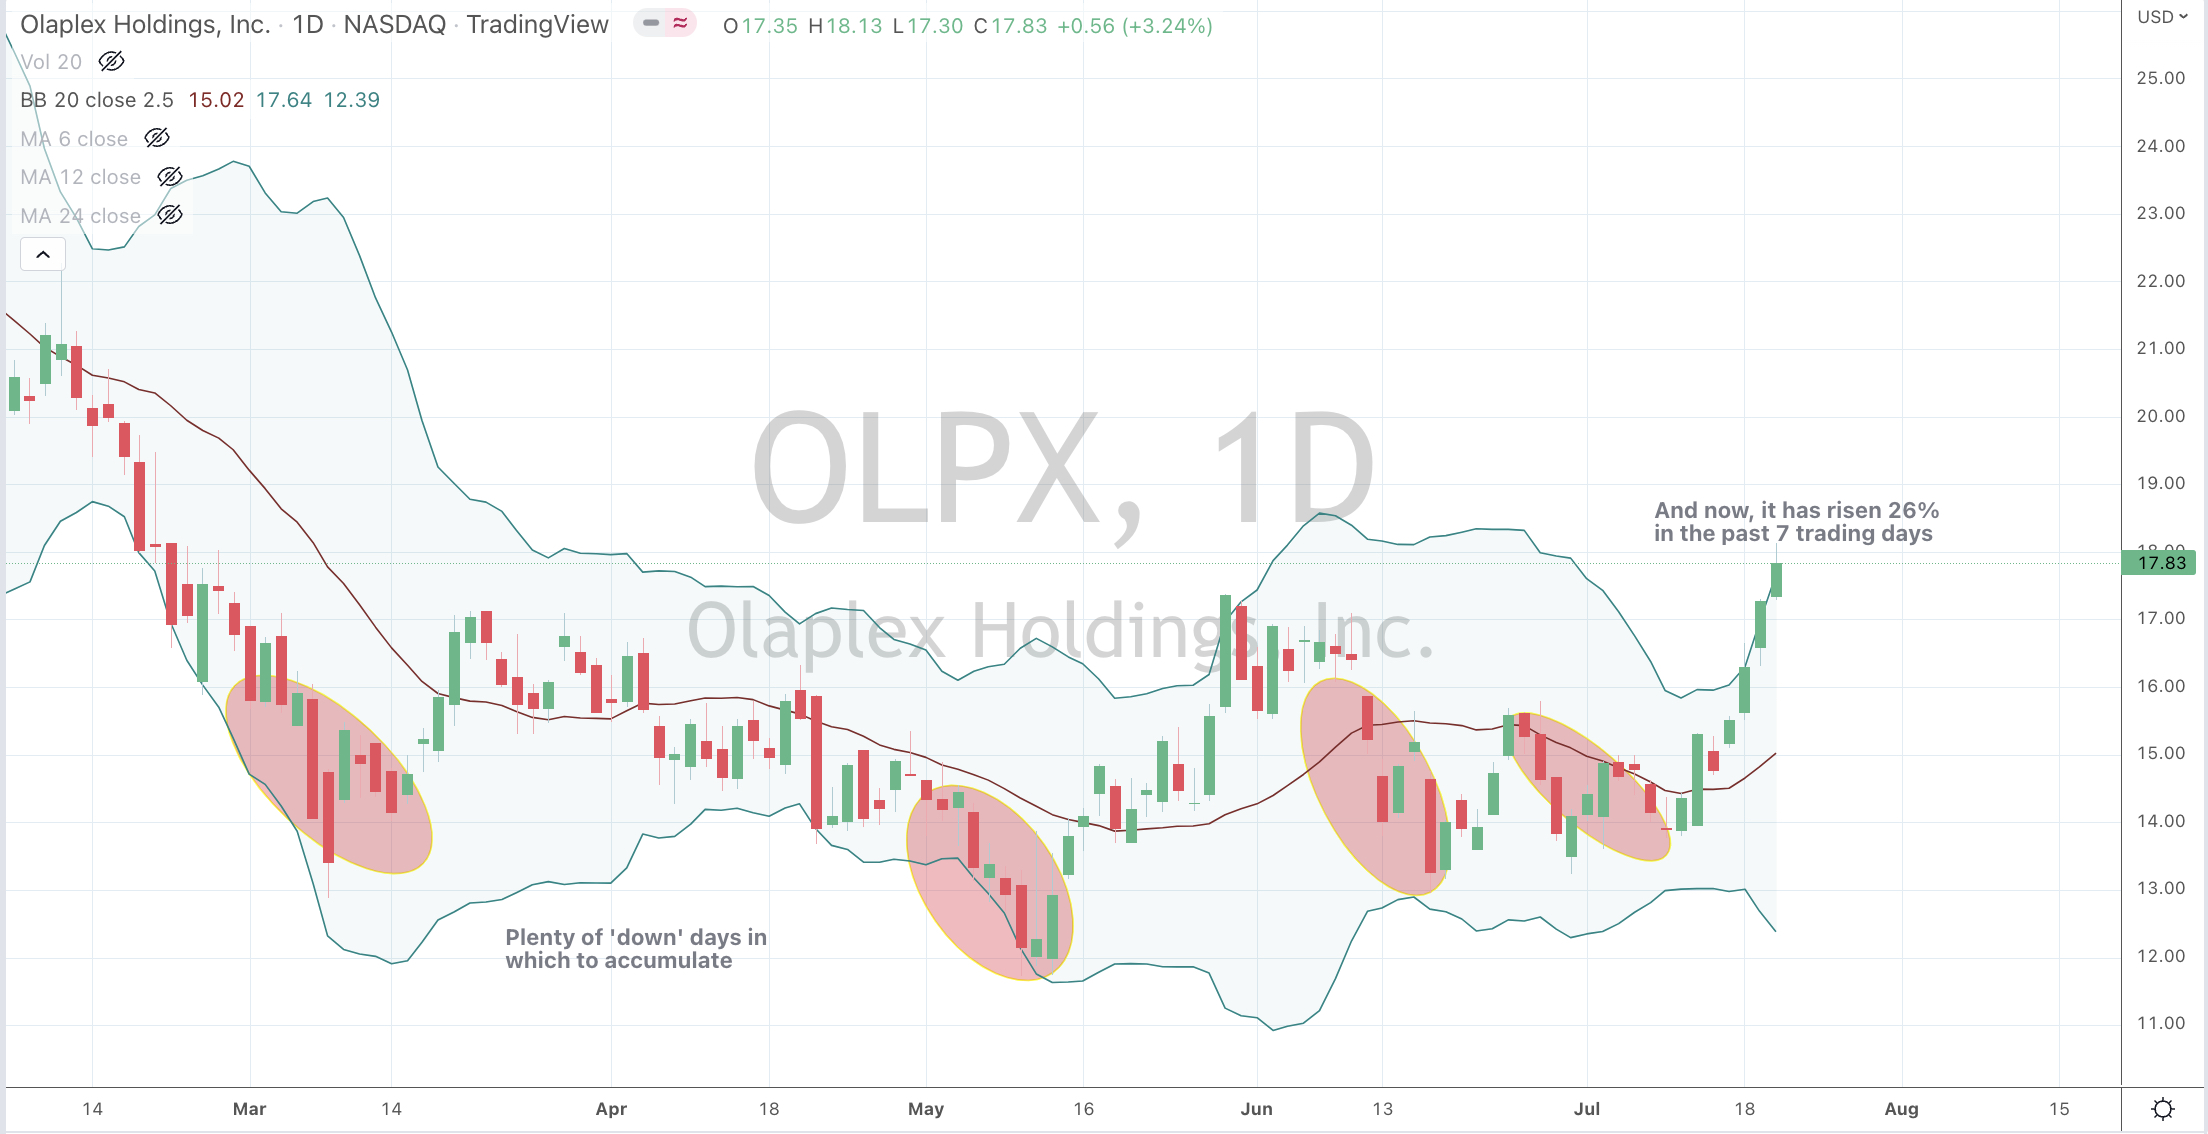
I don’t like the recent stock moves.
In the chart below, U.S. listed Olaplex has risen 26% in the past 7 trading days.
Short covering, momentum buying, benchmarking pressure….blah blah blah….are all some reasons for the spike in many stock prices over the past few days.
Heck, Citigroup has climbed 18% in 4 days,
Following a challenging couple quarters or lagging performance and lower fees, do you think is plausible fund managers lock in those gains, especially considering the comparative return of cash or the index?
Look for these types of stocks to give up perhaps half of the recent gains, in the coming days.
July 21, 2022
by Rob Zdravevski
rob@karrriasset.com.au