A short-term observation in selected equities recommends prudence not to chase momentum and ‘spikes’ when trading days which resemble ‘bounces’ and ‘relief rallies’.
When stocks, indices or commodities ‘gap-up’, there is a high probability that prices trade lower relatively soon to ‘back and fill’ those gaps or spaces in the charts.
My experience suggest that ‘Gap ups’ are often honoured and ‘closed’ in the nearer term when volatility is running above average.
A simple example is that on Friday June 17, 2022, Apple saw an intra-day high of $133.08. The next day (Monday) it opened higher and throughout that day its low was $133.32. There is a 24 cents gap in that price chart.
Then, a few days later (on Wednesday Juen 23rd) its high was $138.59. The following day, the stock price opens higher from the previous days close (gaps-up) and its intra-day low was $139.77.
There is another gap in the chart.
These should be ‘backed and filled’.
In other words, if you are a buyer of Apple stock (this is not a research recommendation), you shouldn’t chase it at today’s $143 high but instead wait for those gaps to be filled and be patient at $133.10.
So, my preference is to accumulate on days when prices are falling, rather than chasing the momentum of the herd.
I’ve spent a lot of time telling clients and readers about staying away from certain stocks, commodities or bonds.
But the underlying message is to position yourself before the next move happens.
On June 3rd, 2022, when the share price of Hess Corporation was hitting a high of $131.40, I wrote in the note below that Hess’ stock prospects is either ‘a ‘$30 up or $30 down…..this is hardly compelling’
While the decline in certain energy related securities and commodities is not over.
In the interim, I expect a bounce in these prices for various reasons which translate ‘the sudden drop is overdone’.
From the book of ‘taking the fat part of trade’, by shorting Natural Gas at $9.45 (it’s now trading at $6.22) and now enjoying a 34% gain, it is prudent to close out that position, whether its wholly or partially.
This is an extraordinary result in any asset class over a 12 month period, let alone in 14 days.
It’s important to not confuse genius with being fortuitous.
But that’s the past……
Preparedness (analysis and mathematics) should be valued rather than the reporting of what has already occurred.
You want to be prepared for a trading low in Copper and Tin, which have fallen 26% and 40% respectively and the current trough in South Korea’s KOSPI equity index (currently at 2,367 points), to mention a few.
10 days, I wrote this note about the Buy signals appearing in South Korea.
Today, the trend in those indices may be improving but your margin of safety has diminished if you are now buying those markets at a price which is 20% higher.
The following assets (on a weekly timeframe) registered an Overbought or Oversold reading and/or have traded more than 2.5 standard deviations above or below its rolling mean.
Extremes “above” the Mean (at least 2.5 standard deviations)
None
Overbought (RSI > 70)
Australian 2 & 3 year government bond yields
U.S. 2 and 5 year government bond yields
Canadian, Swiss, German, Spanish, French, Italian, Korean and Portuguese 10 year government bond year yields
TBT & TLT
USD/JPY
The Overbought Quinella – Both Overbought and Traded at > 2.5 standard deviations above the weekly mean)
None
Extremes “below” the Mean (at least 2.5 standard deviations)
Copper
Copper/Gold Ratio
Oats
Soybeans
S&P MidCap 400 and SmallCap 600
SMI
Toronto’s TSX
ASX 200
Oversold (RSI < 30)
JPY/USD
The Oversold Quinella – Both Overbought and Traded at > 2.5 standard deviations above the weekly mean)
South Korean KOSPI Index
Chilean Peso / U.S. Dollar
Bitcoin and Ethereum (also touching their 200 week moving average)
Notes & Ideas:
This week’s biggest news was the rally in stocks, the pullback bond yields and all the currencies moved from away from their extremes.
As I reflect on the most recent editions of this periodical, both of these asset classes were and have spent time at the ‘extreme’s.
The crescendo of a surging yield Japanese 10 year yield of 2 weeks ago, peaking at 0.45% seems more pointed now they at 0.22%. This decline aligned with one of many signals of a rally in equities.
Another interest rate and market indictor to watch is the Copper/Gold Ratio, which I’ve written about previously. It also touched its 200 week moving average this past week.
The U.S. Dollar Index isn’t Overbought, nor the Australian 5 and 10 year bond yields, Germany’s 2 & 5’s or the U.S. 10’s.
The US 10 year minus Australian 10 year yield is no longer Oversold, nor is the GBP/USD, the Korean Won or the S&P 500.
Last week we had a hint of a rise in stocks as the Nasdaq rose amongst a list of losers and I wrote “The U.S. biotech index closed up 0.06%. Perhaps some rotational resilience for a bludgeoned sector”.
The Nasdaq Composite rose 7.5% while the Biotech Index soared 9.7%……for the week.
Natural Gas continued is decline (down 32% in 2 weeks) while LNG prices added to the previous weeks gains.
While, the other Gas (LNG) spiked 46% for the week.
Tin declined 10%, adding to last week’s fall of 12.8% and the relevance of this note, its down 40% since its Overbought Quinella on March 7th, 2022 edition of this note
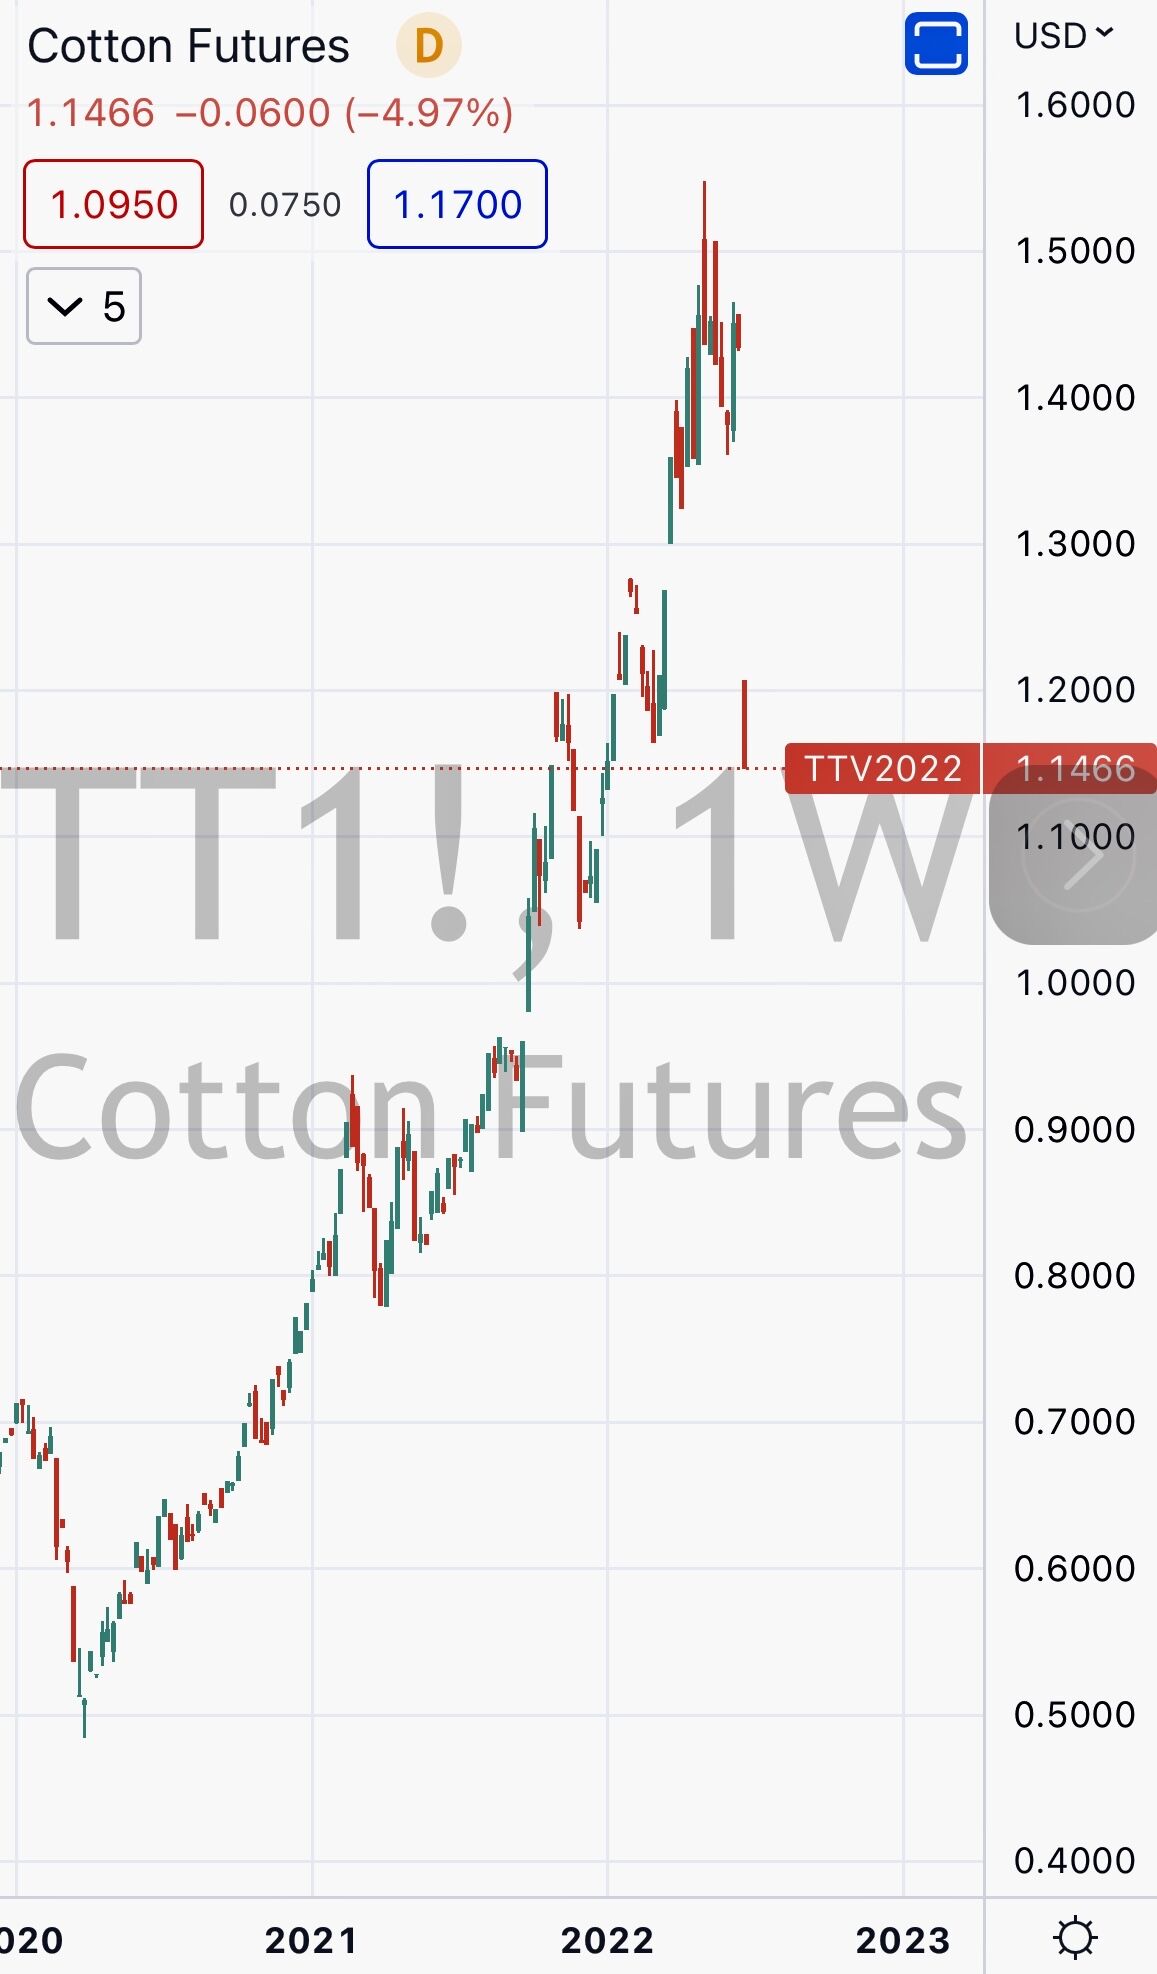
Cotton slipped 25% for the week. Why? Is it speculators realised that’s replenishable?
Perhaps the same realisation occurred in the Oats, Corn, Wheat and Soybean market last week?
Unsurprisingly, the Bloomberg Commodity Index is down 11% in 3 weeks, while Oil didn’t contribute to any of this decline for it only fell 0.6% for the week, following last week’s 10% slump.
Nor did Gold, as it only fell 0.6%, but then again Gold has been acting strangely for many months.
The larger advancers over the past week comprised of;
JKM 9.3%, Lumber 1.9%, LNG 6.4%, Palladium 3.1%, Gasoline 2.4%, Dutch TTF Gas 9.1%, Uranium 1.4%, AEX 3.9%, KBW Banking Index 4.5%, CAC 3.2%, CSI 300 2%, Dow Jones Industrial 5.5%, DJ Transports 5.3%, MIB 1.6%, HSCEI 3.6%, HSI 3.1%, Midcap 400 4.6%, Nasdaq 100 3.5%, Nikkei 2%, Sensex 2.7%, OMX 5.2%, Russell 2000 6%, SMI 3.6%, SOX 5.4%, S&P 500 6.5%, FTSE 2.7%, S&P SmallCap 600 4.7%, Biotechnology Index 9.7%, Nasdaq Composite 7.5%, ASX 200 1.6% and commodity heavy TSX rose only 0.6%.
The group of decliners included;
Aluminium (1.9%), Bloomberg Commodity Index (4.3%), Australian Coal (2.2%), Baltic Dry Index (9.6%), China Coal (8.7%), Iron Ore (2.2%), Copper (6.8%), Coffee (1.8%), Natural Gas (10.4%), Cattle (2%), Tin (10.4%), Nickel (2.5%), Orange Juice 6.7%, Platinum (2.9%), CRB Index (3.4%), Cotton (25.3%), Silver in AUD (2.6%), Silver (2.5%), Corn (4.4%), Oats (19.8%), Soybeans (6.3%), Wheat (10.5%), KOSPI (3.1%), OBX (2.9%), HEX (2%), STO (1%) and Taiwan’s TAEIX (2.2%).
I’ve been cautioning about lower commodity prices with mean reversion being the major undertone.
My writings have broadly warned about not chasing prices that have ‘gone parabolic’ amongst the many basis’ and theorems.
In todays trade, commodities are getting smashed again.
Copper is down 5%, Natural Gas is 8% weaker, Platinum and Nickel are lower, Silver is off 2%, Corn and Soybeans have declined 3%, Oats have slumped 12% while Wheat and Cotton have eased 4%, with the latter down 20% for the week.
Many of these prices are the same or below the February 23, 2022 Ukrainian invasion.
Remember all that palaver about Ukraine being the ‘bread basket of Europe’. Well that may be the case, but it matters if you chase things higher and pay the wrong prices.
Now, I’m not saying ‘short’ a host of commodities as it’s too late (while some of the energy complex has yet to start) or at least the margin of safety has diminished.
You want to position for the lows and what opportunities appear in the 2nd and 3rd derivitive.
Do you remember all those stories and prescribed theory surrounding all that American money printing and how it will devalue the Dollar.
The vernacular moved “if they keep manufacturing money and its going to be worthless” and when coupled with all of that government debt, the doom seemed excessive.
Keep in mind that the U.S. will never pay off its debt. Its debt is different to our personal debt.
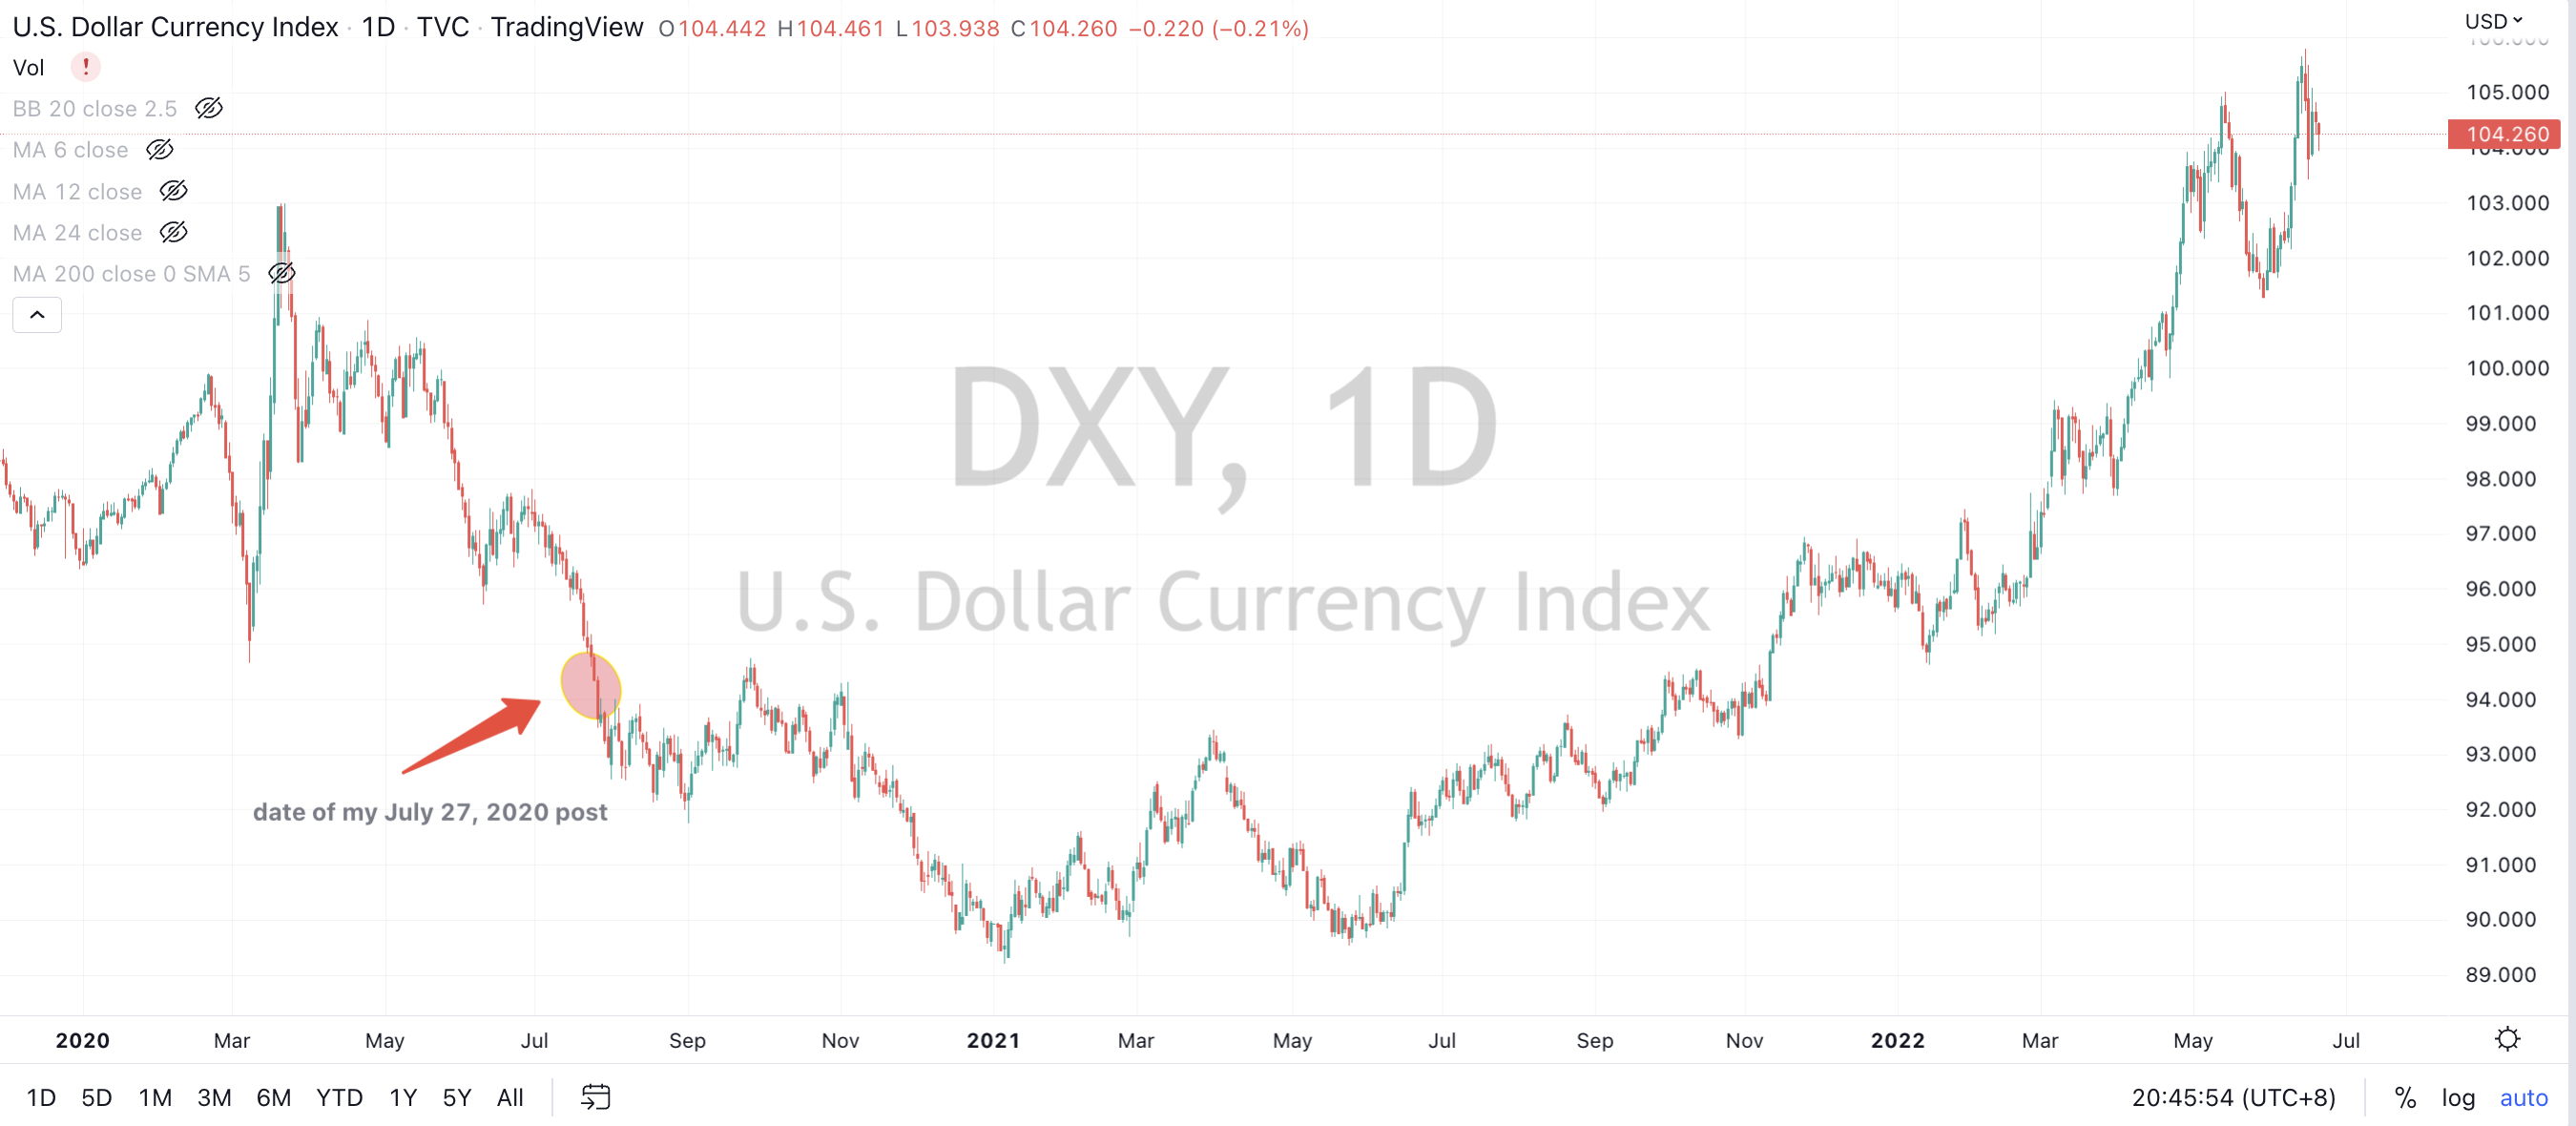
“my strategy has been to Sell AUD / Buy USD at 0.68, 0.71 and then 0.75 (if it touches that level) will bode well for investors……………Structurally, I am a US Dollar Bull…….the United States just saved the world with its cross currency swaps and people think this will be its undoing……….The Dollar will remain the centrepiece of our financial architecture within our lifetime.”
Since July 2020, the U.S. Dollar has maintained its strength.
Here is a chart showing that against a basket of currencies.
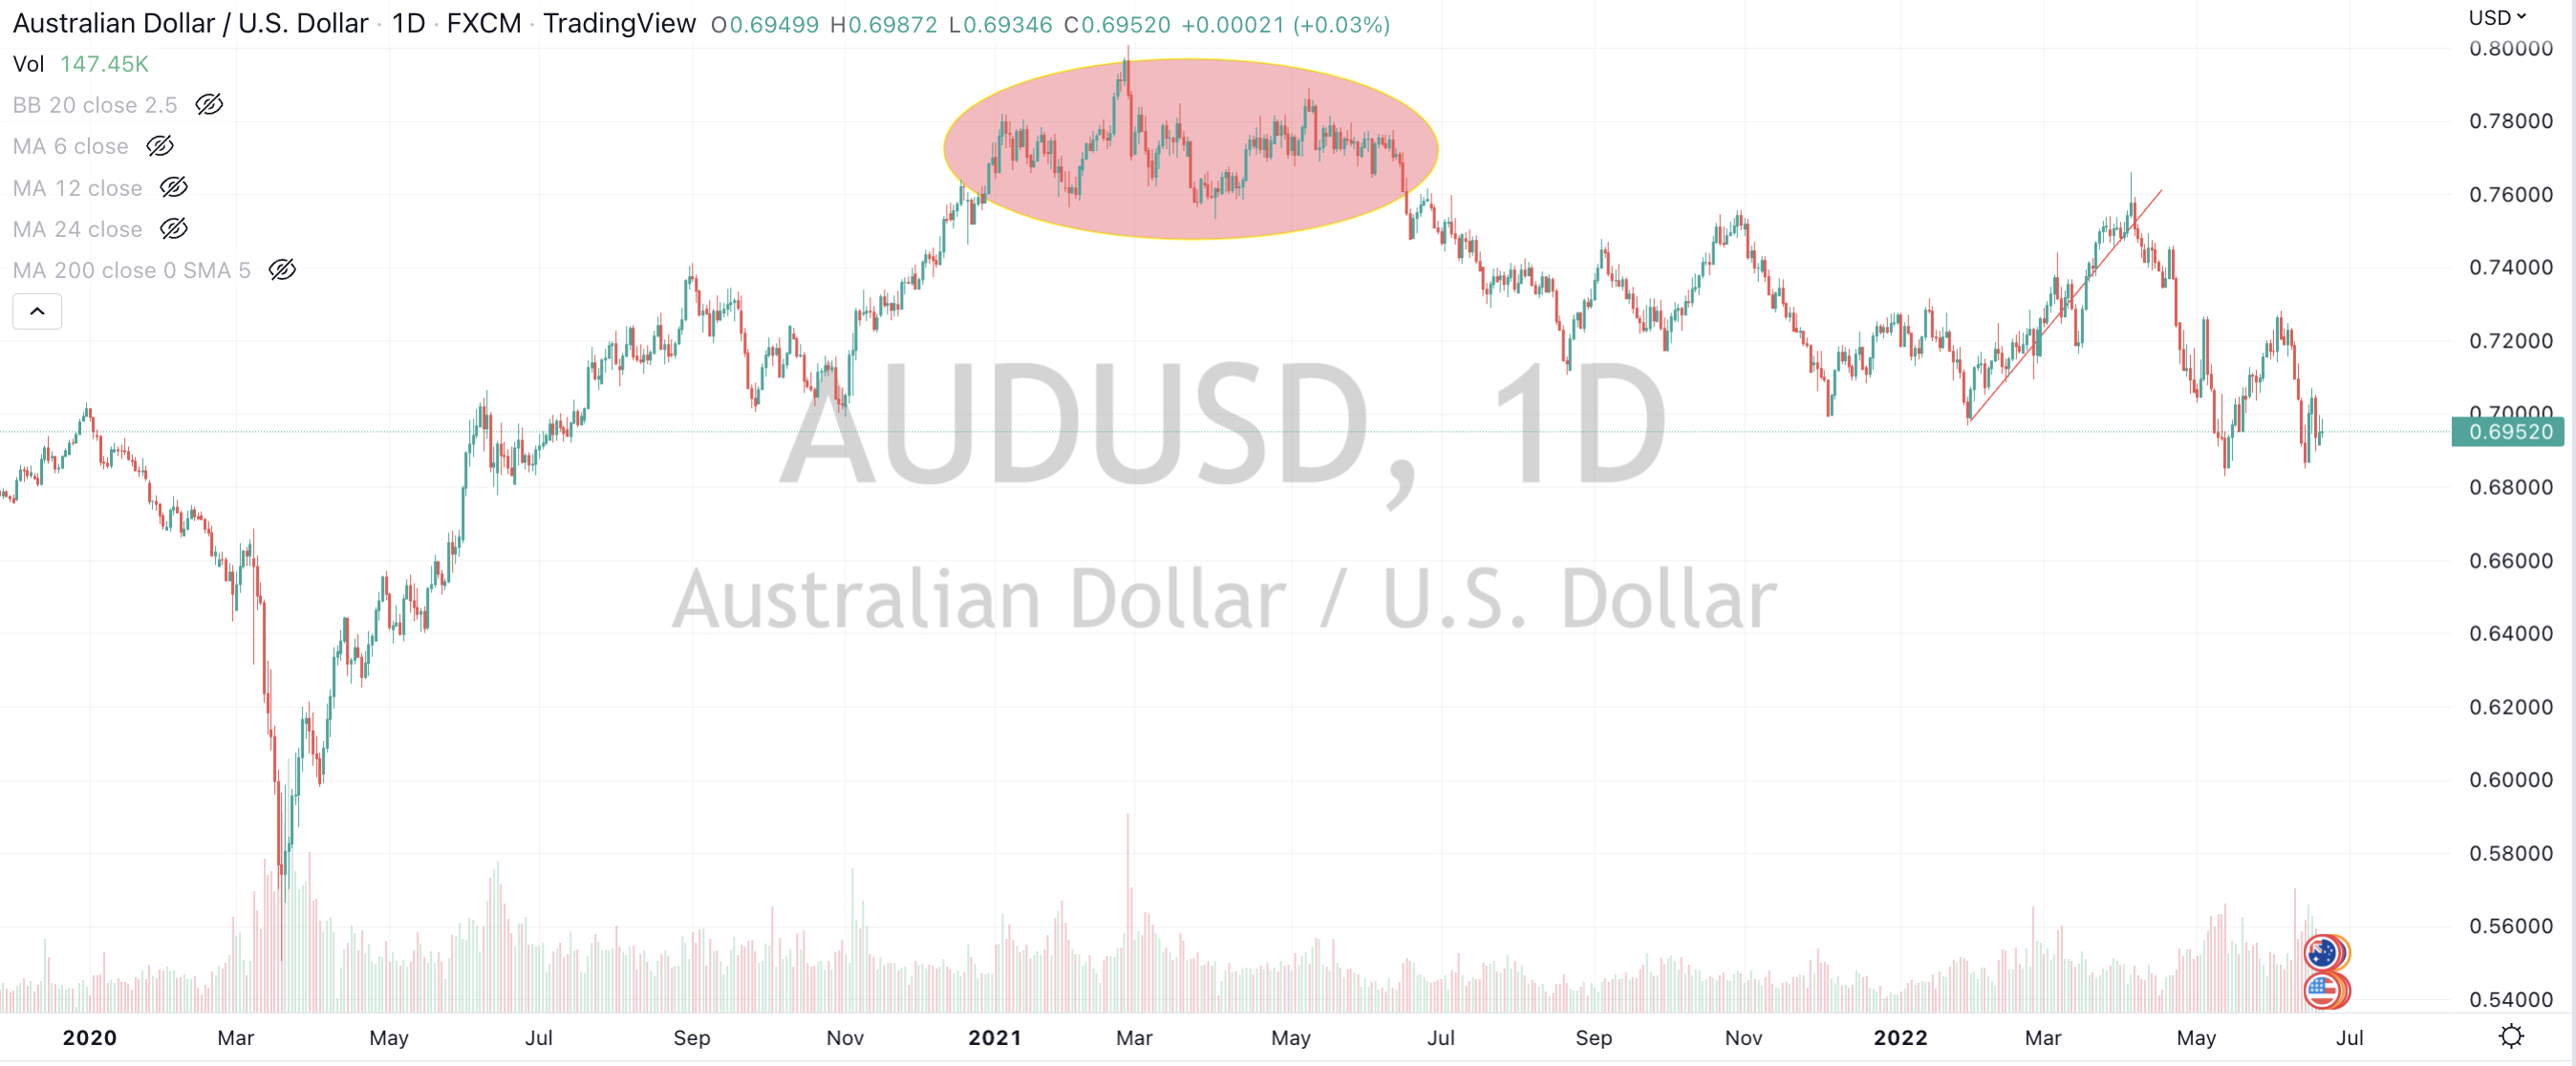
And here is a chart of the Australian Dollar versus the USD.
The ellipse shows the small amount of time the AUD spent above 75 cents, while there seems to be an omnipresent lid on its value.
Today, my bias is for a lower AUD against the USD.
If it trades below 0.6828, then look for a test of the 0.6580 region.
Failing to hold that support area, then probability of 0.6200 commences to increase.
This general view (and the latest decline in the AUD) is commensurate with my view of lower commodity prices, in the interim.
For now, let’s say 2-8 months.
If this pans out, then the positioning will be summarised as Australia would be ‘on sale’, on a global currency basis. It will be beneficial for businesses which sell products (receive revenue) denominated in USD.
we may not need to see a week or two of massive capitulation volume, where instead that volume of aggressive sellers has been spread over some weeks.
And on the mean reversion topic, the S&P 500 is only 170 points away from ‘kissing’ its 200 week moving average.
While I remind myself that ‘timing is everything’, what is evident is we (unless you think there are structural systemic problems) are in a season of being a buyer and not a seller.
Another way to navigate the current pessimism and ‘noise’ is to look past the next few months and understand what you are invested in, the case for its valuation and why you own it.
If cryptocurrencies implode, it only matters if you own cryptocurrencies.
I exchanged some comments in a recent Linkedin post about the current market.
It was based around ‘markets’ not seeing a surge in selling volume to imply that we are closer to a ‘wash-out’ and trough in capital markets.
And while we haven’t seen a ‘crescendo’ of concentrated volume, it prompted me to ponder that there isn’t a rule or requisite that suggests it must do so.
There are some stocks (and indices such as the ASX 200) seeing a ‘double dip’ visit into Oversold territory over a 6 -7 week timeframe.
So I think that perhaps we have seen enough cumulative volume over that time (from the initial Oversold to the current Oversold) to add to up to a ‘washout’.
When you combine above average volume over a longer period of time, where sellers are the more aggressive in ‘hitting the bid’, coupled with buyers simply ‘pulling their bids’ lower, you’ll see the result of prices easing, easily.
And in the absence of ‘strength’ in the trend, a floor seems nigh.
For example, ANZ Bank fell into oversold territory on a ‘daily’ basis on May 10th, 2022 and again, now, on June 17, 2022.
Since the decline commenced on May 5th (for over 31 days) ANZ Bank has seen 208 million shares traded.
ANZ Bank’s average monthly volume (over the past 12 months) has been ~ 113 million shares.
We have nearly seen twice the amount of volume turned over in the past month.
The 208 million traded over the past 31 days equates to 7.5% of ANZ Bank’s shares outstanding.
Albeit, I haven’t got an almanac to be guided by but my experience tells me that this is a large amount of turnover devoid of material bad news or downgrades.
Its a sign that the holders of the stock are in the process of reverting from weak hands to stronger hands.
The following assets (on a weekly timeframe) registered an Overbought or Oversold reading and/or have traded more than 2.5 standard deviations above or below its rolling mean.
Extremes “above” the Mean (at least 2.5 standard deviations)
Chinese 10 year Government Bond Yields
EUR/GBP
Dow Jones Industrial Average
Copenhagen’s OMX 25 Index
Philadelphia Semiconductor (SOX) Index
Singapore’s Strait Times Index
Nasdaq Transports Index
Overbought (RSI > 70)
Australian 2, 3, 5 & 10 year government bond yields
TBT & TBX
U.S. Dollar (DXY) Index
USD/JPY
The Overbought Quinella – Both Overbought and Traded at > 2.5 standard deviations above the weekly mean)
U.S. 2, 5 & 10 year government bond yields
British, Canadian, Swiss, Spanish, French, Greek, Italian & Japanese 10 year government bond year yields
German 2, 5 & 10 year government bond yields
Extremes “below” the Mean (at least 2.5 standard deviations)
Copper/Gold Ratio
Oversold (RSI < 30)
CAD/USD
JPY/USD
KRW/USD
GBP/USD
IDR/USD
TLT & IEF
The Oversold Quinella – Both Overbought and Traded at > 2.5 standard deviations above the weekly mean)
US 10 year minus Australia 10 year government bond yields
Bitcoin and GBTC
Amsterdam’s AEX
S&P Midcap 400
Russell 2000
SMI
S&P 500
ASX 200
Toronto’s TSX
KOSPI
And the S&P 500 Small Cap 600
Notes & Ideas:
This week’s biggest news was seeing government bond yields register my Overbought Quinella of registering a weekly RSI above 70 and trading to 2.5 standard deviations above its weekly mean.
The Japanese 10 year yield surged into what seems like a crescendo of 0.45%. It settled the week at 0.40%.
In fact, we saw many surges intra-week in bond yields. The U.S. 10 year touched a high of 3.50% to then close the week at 3.23%.
A more notable observation in this bond yield surge is that the listed bond ETF’s which represent the long and short of the bond market (they carry the codes of IEF, TLT, TBT and TBX respectively) traded to Monthly Quinella’s of extremes.
Another group in that category, but on the Oversold side of the ‘extremes’ are a host of equity indices.
BUT, can you believe in a week of carnage amongst equites, the Nasdaq 100 rose 1.2% for the week. Incidentally, the Nasdaq Composite fell 4.7%.
Is there some support and strength in the ‘leaders’?
We also saw outside bearish reversal weeks from assets and securities such as the Bloomberg Commodities Index and WTI Crude Oil. These are some of the names which were Overbought over the past couple weeks.
In price action news, I expect Lean Hogs to trade up to $120 and the S&P Midcap 400 closed on its weekly lows, unlike the U.S. 10 year bond yield.
(i.e. Monday may offer a good opportunity to get set)
The U.S. biotech index closed up 0.06%. Perhaps some rotational resilience for a bludgeoned sector.
And finally, Energy isn’t overbought anymore as Oil and Natural Gas tanked following weeks being Overbought.
Natural Gas has fallen 27% since my “Sell” call 11 days ago at $9.50, where I called it the ‘mother of all peaks’.
Carrying today’s writing theme of the Trifecta of where prices are seeing a Weekly Oversold reading, touching its 200 week moving average and trading at 2.5 standard deviations below its rolling weekly mean……..
the chart below shows circles where South Korea’s Kospi has done so and bodes well as moments to accumulate, should your investment time horizon be longer than 8 minutes.
Although, this is hardly surprising given that its largest company by market capitalisation is also sending the same signals following its 26% decline over the past 52 weeks.
The ‘window’ to sell can see seen at the opposite end of the pendulum.
This week, we are in an accumulating ‘window’.
And, the South Korean Won is at a 13 year low, making their products much more competitive.
I can’t imagine the United States imposing any onerous import tariffs to combat this, either.
Especially following President Biden’s trade and security visit to South Korea only last month, in May 2022