The following assets (on a weekly timeframe) registered an Overbought or Oversold reading and/or have traded more than 2.5 standard deviations above or below its rolling mean.
Extremes “above” the Mean (at least 2.5 standard deviations)
AUD/GBP
Overbought (RSI > 70)
Dutch TTF Gas
Japan Korean LNG Marker price
The Overbought Quinella – Both Overbought and Traded at > 2.5 standard deviations above the weekly mean)
Istanbul Stock Exchange
Extremes “below” the Mean (at least 2.5 standard deviations)
Japanese 10 year government bond yields
U.S. 10 year minus 5 year government yield spread
Oversold (RSI < 30)
U.S. 10 year minus U.S. 2 year government bond yield ‘spread’
U.S. 5 year minus U.S.3 month government bond yield ‘spread’
Hot Rolled Coiled Steel
Tin
The Oversold Quinella – Both Overbought and Traded at > 2.5 standard deviations above the weekly mean)
None
Notes & Ideas:
This big news over the past week was an extension in the equities advance which was mainly appearing in North American markets and the strength in many commodities.
The feature in the latter was amongst the energy complex.
In last week’s edition of Macro Extremes, I wrote,
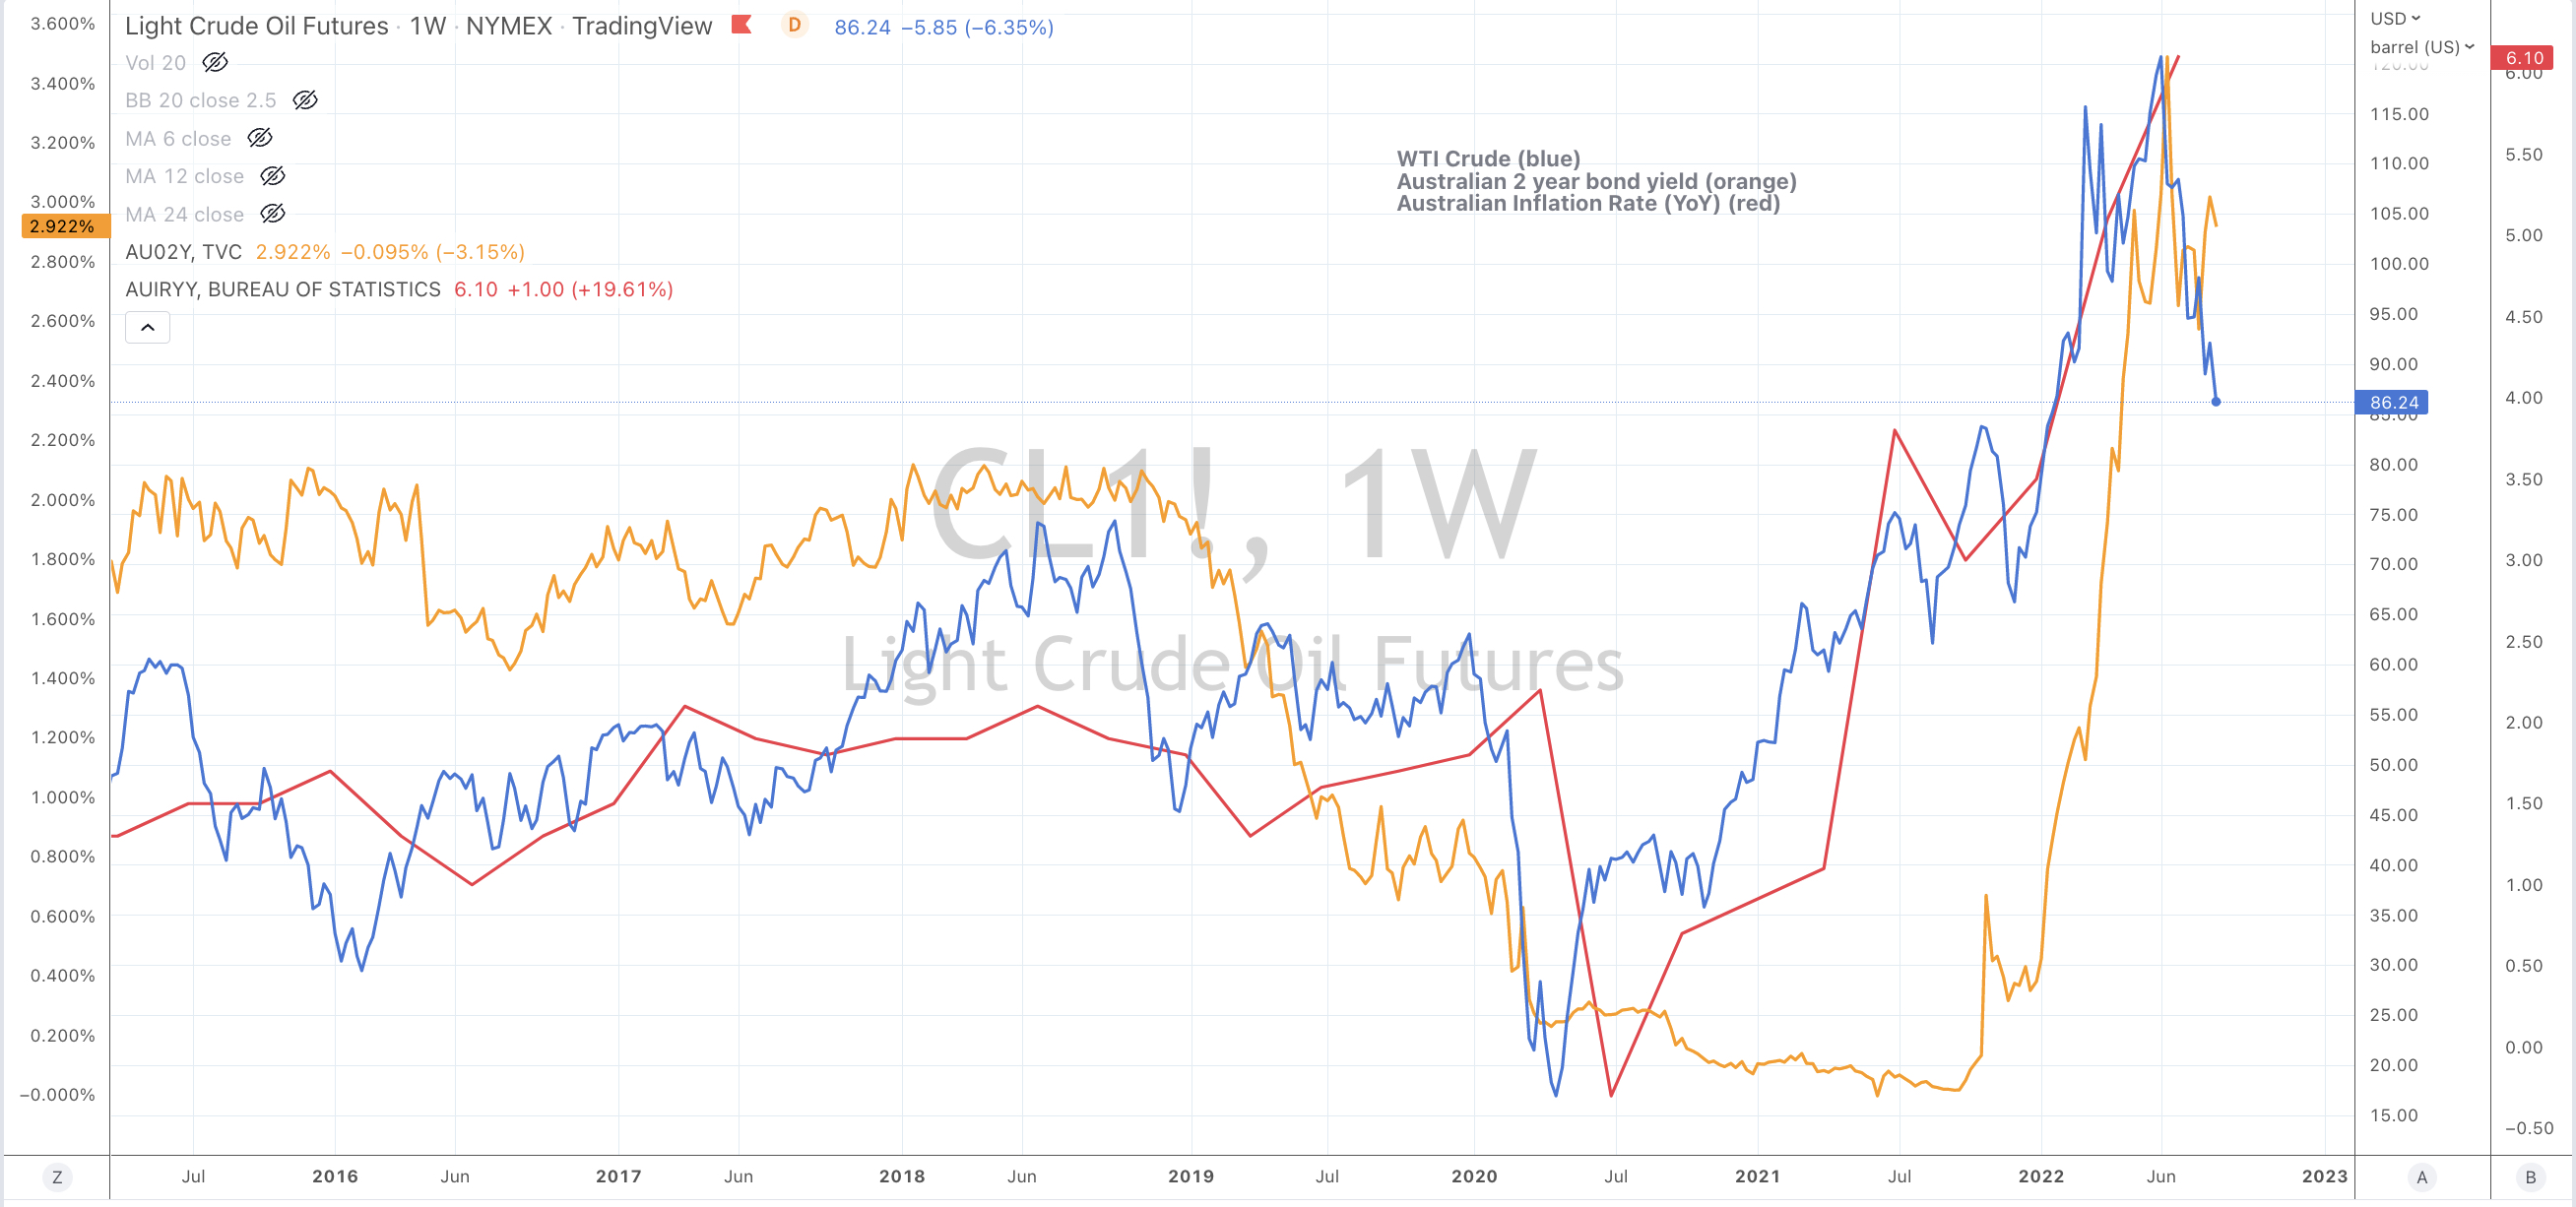
“Now that Gasoil and Crude prices have fallen 30% from their recent highs, Crude Oil specifically is near an interim low and due for a ‘bounce’.
I’ll look for WTI Crude and Brent to trade down to $85.50 and $92.00 respectively.”
That bounce did occur over this past week and WTI Crude and Brent traded near but not quite down to those targets. For example, Brent touched $93.07.
Resilient to recent energy price retracement has selected gas prices.
Over the past 12 weeks, the Japan Korean LNG Marker has risen 137% while the Dutch (European) TTF Gas price has climbed 150% in only 9 weeks.
Lately, I have been writing about how the lows of this recent trading rally were seen in mid June 2022 and Buy signals were appearing in Small and Mid Cap indices.
Since then, the MidCap 400 has rallied 19% and the Russell 2000 has soared 23%, of which 5% occurred in this past week. This adds to the argument of being careful chasing momentum at the tail end of what I see as an interim wave.
Incidentally, that Russell 2000 is still 18% below its November 8, 2021 peak.
This also comes from the playbook that small caps peaked early and likely ‘troughed’ first. There was much damage done in the small caps.
Lastly, the U.S. yield curve remains inverted for the 6th week in a row and Oversold for 4 consecutive weeks.
The larger advancers over the past week comprised of;
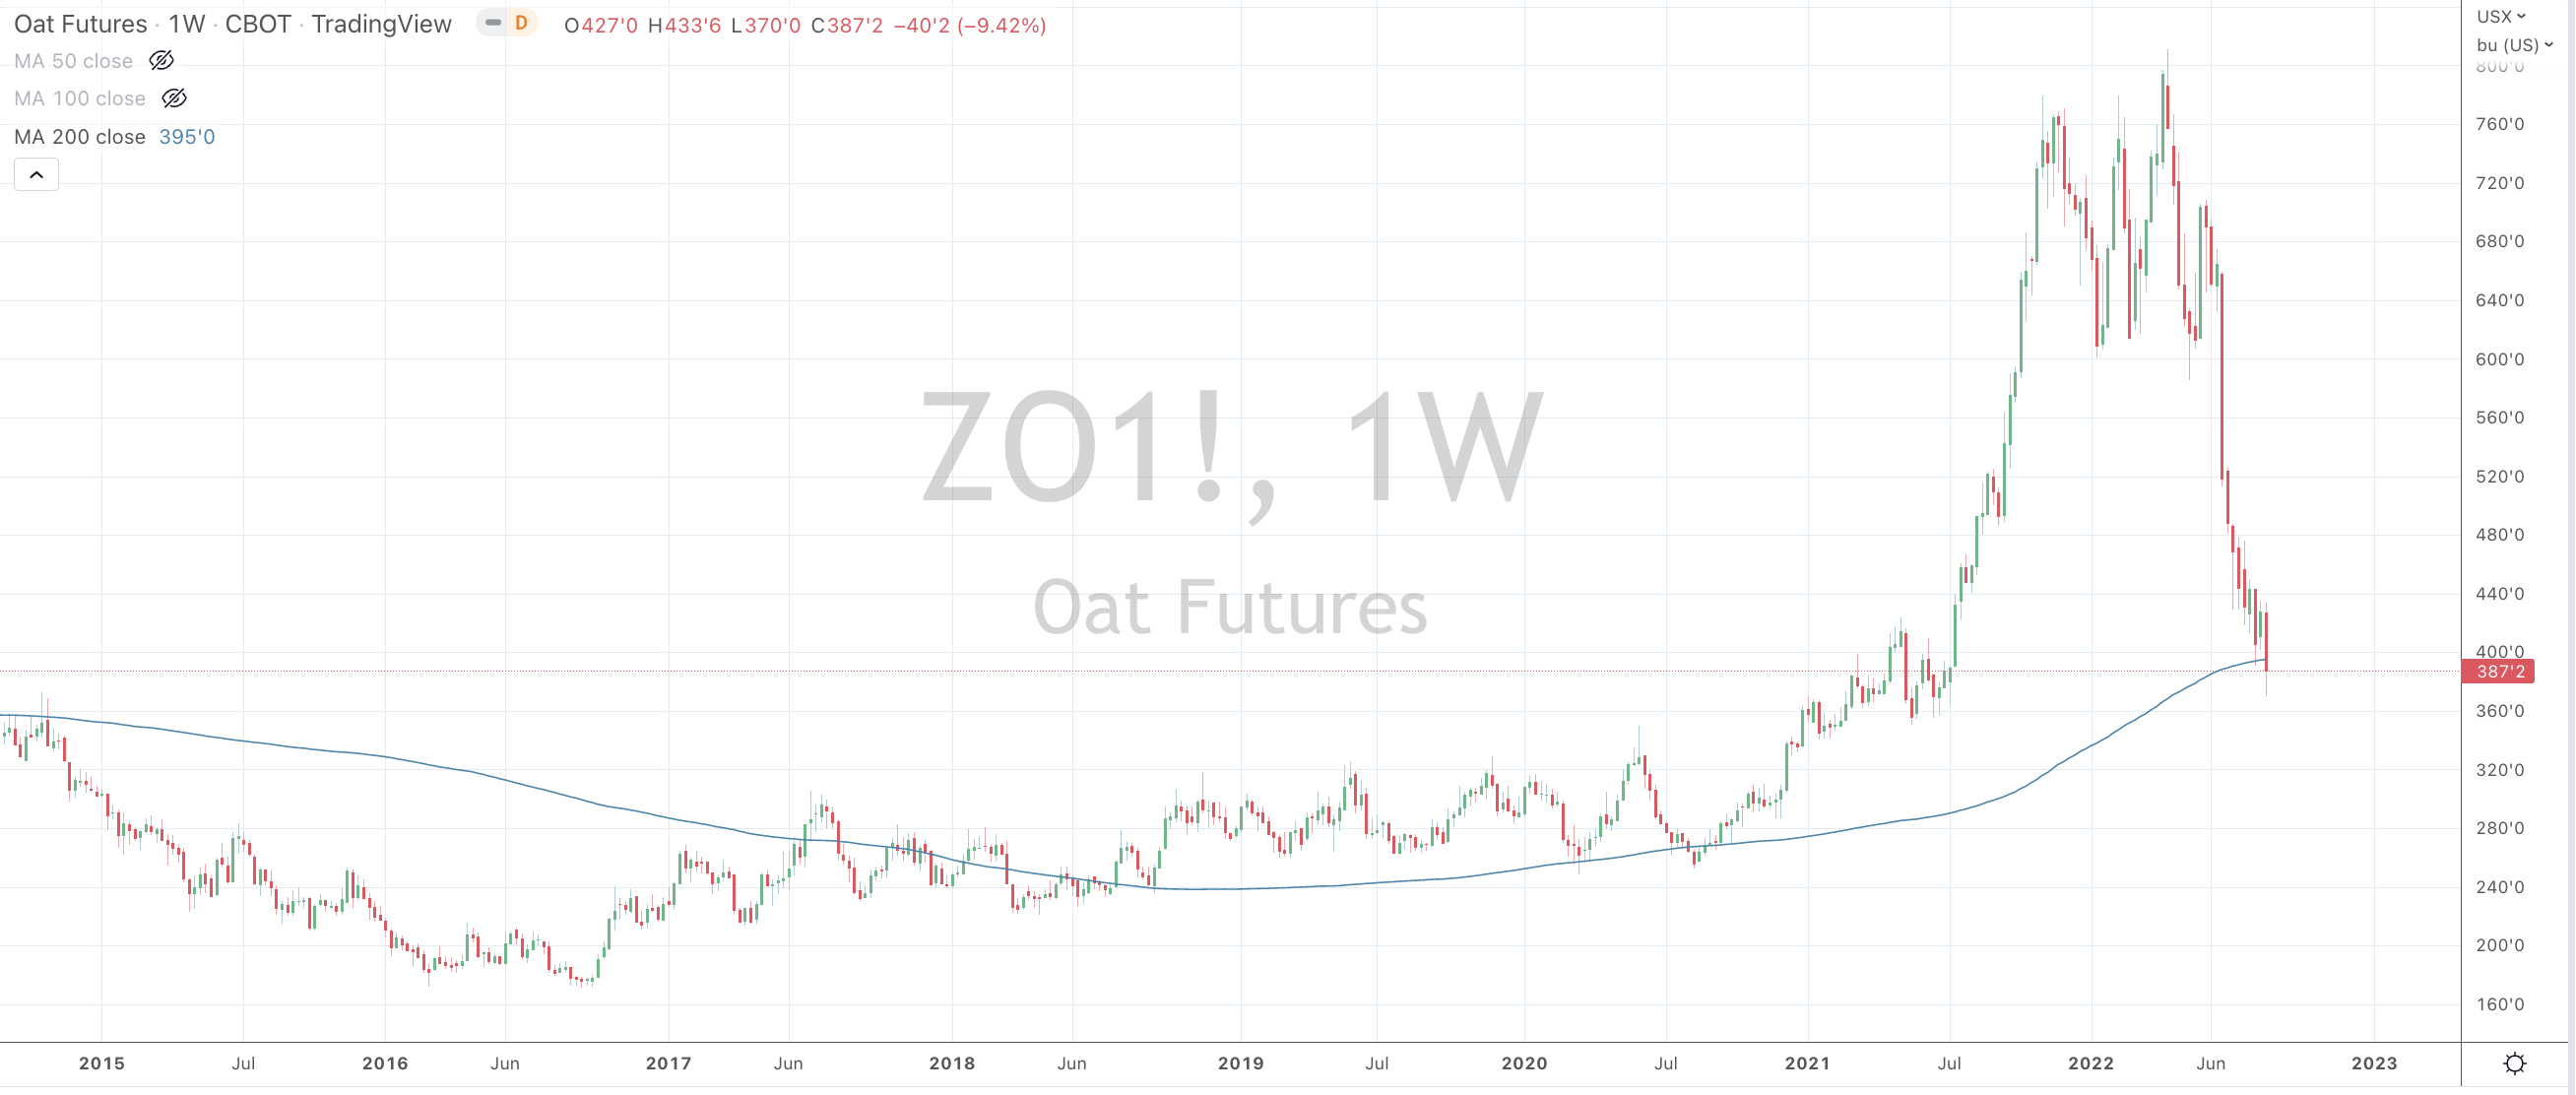
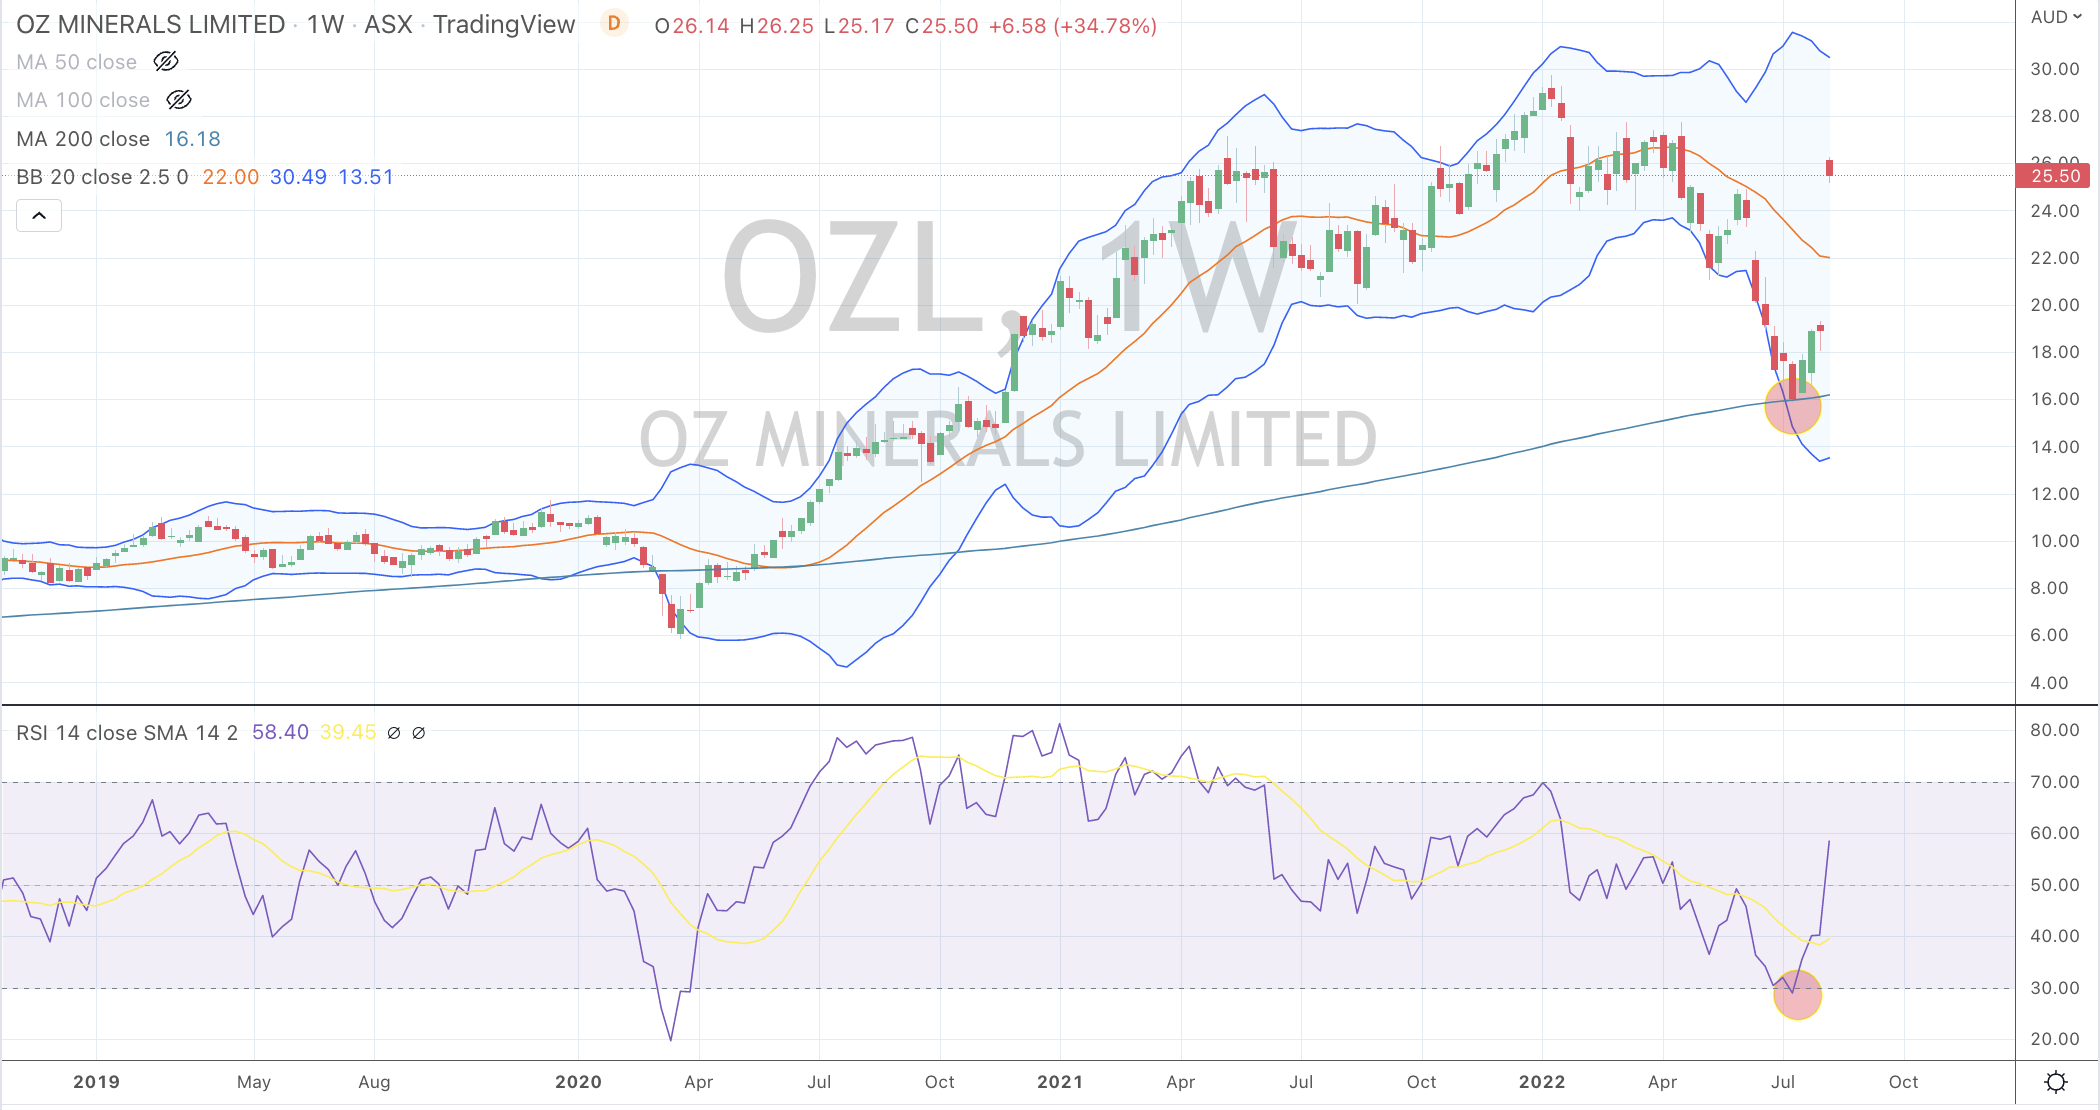
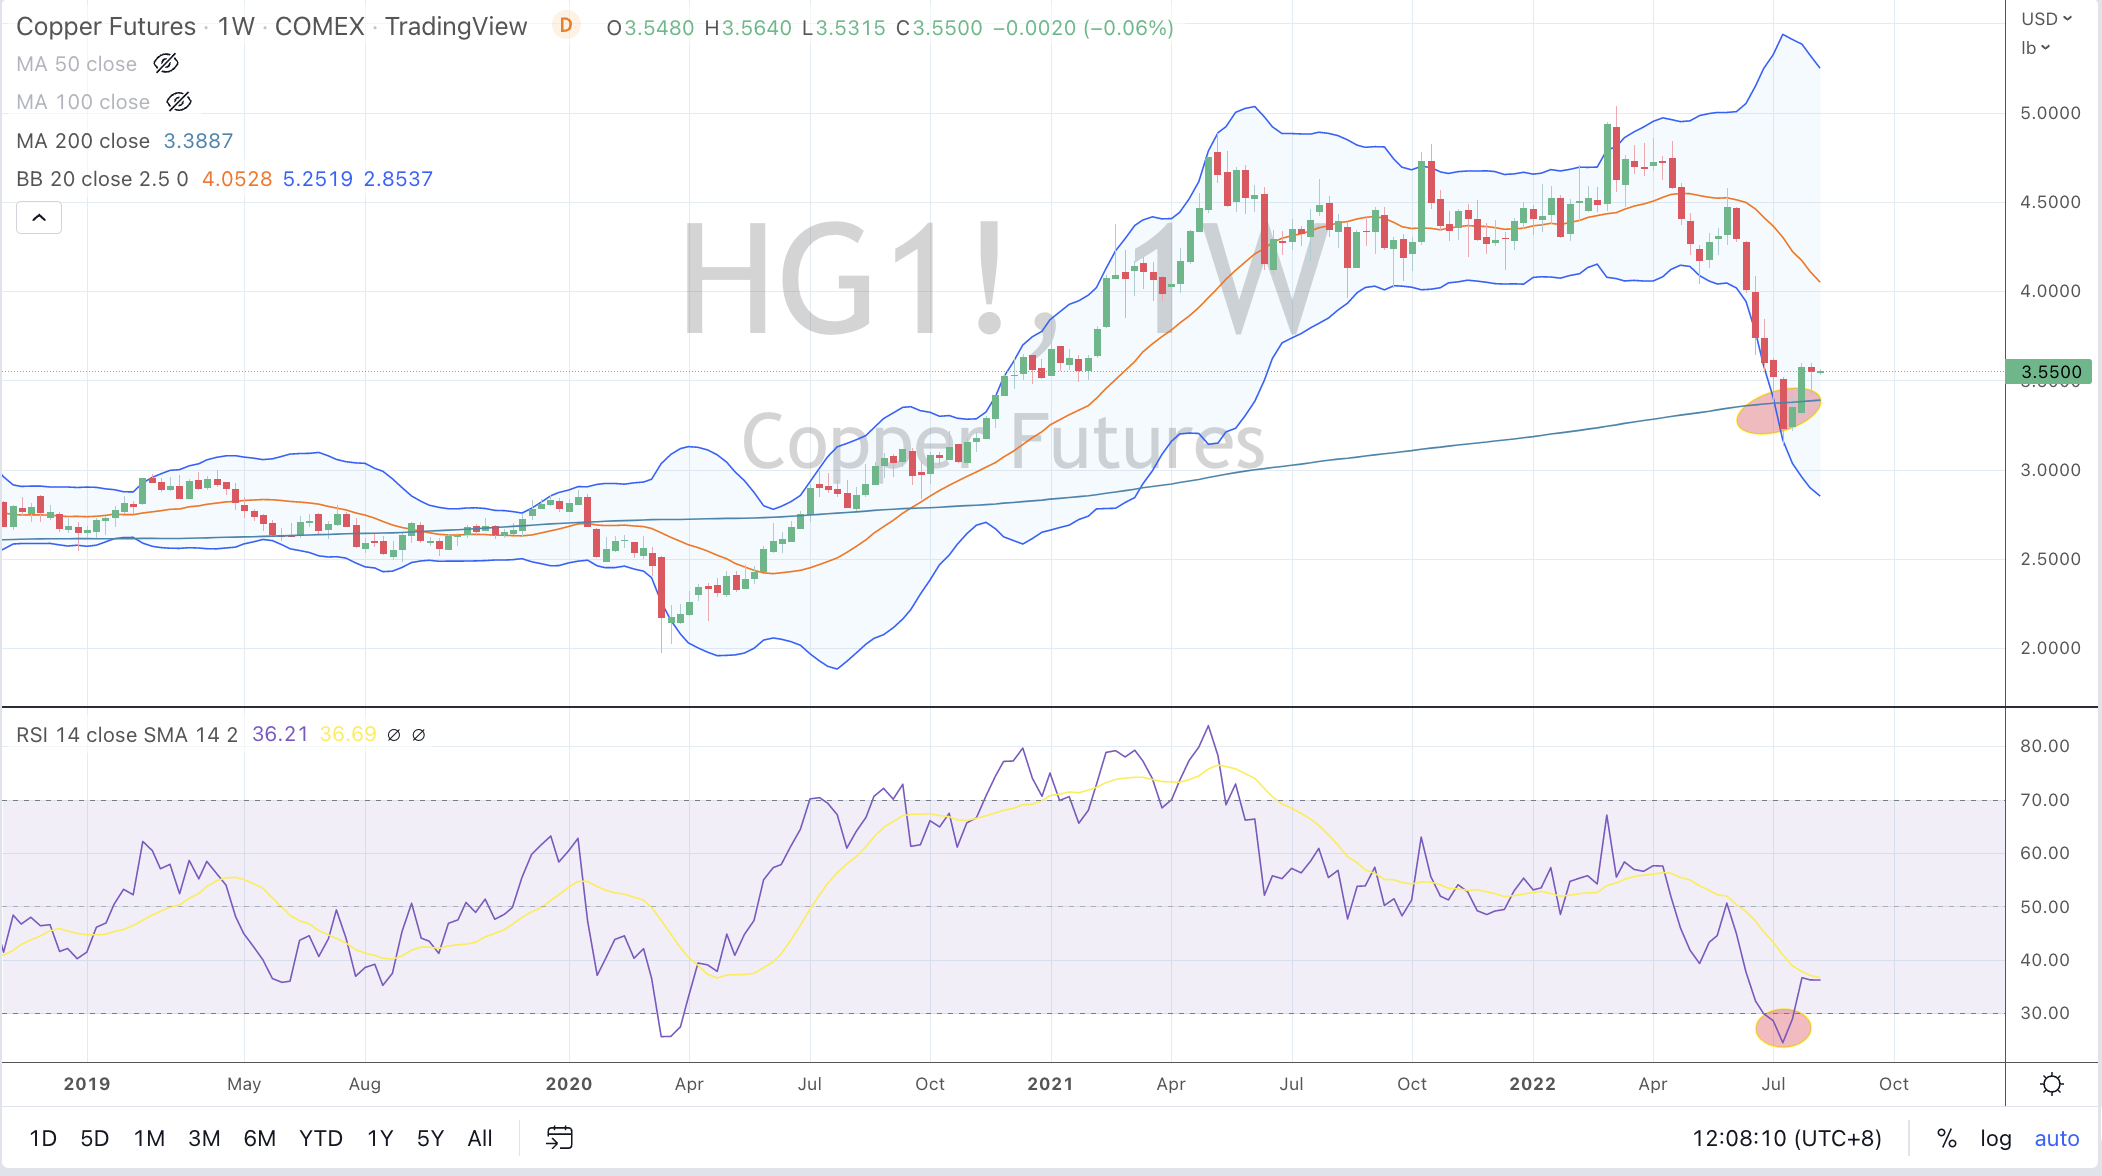
Australian Coking Coal 5.8%, Rotterdam Coal 11.8%, Bloomberg Commodity Index 4.5%, Baltic Dry Index 2.1%, Cocoa 3.9%, China Coal 9%, WTI Crude 3.5%, Gasoil 5.6%, Copper 3.3%, Heating Oil 9.4%, JKM 16.2%, Coffee 6.2%, Lumber 22.9%, Natural Gas 8.7%, Palladium 4.3%, Platinum 3.8%, Gasoline 6.7%, Sugar 3.7%, Silver 4.6%, Cotton 12.6%, Dutch TTF Gas 5%, Brent Crude 3.7%, Corn 4.8%, Oats 5.4%, Soybean 3.2%, Wheat 3.9%, KBW Banking Index 5.8%, Dow Jones Industrials 3%, DJ Transports 3.7%, IBEX 2.9%, BOVESPA 5.9%, S&P Midcap 400 4.5%, Nasdaq 2.7%, Helsinki 2%, Russell 2000 4.9%, Sensex 1.8%, S&P 500 3.3%, TAIEX 1.7%, Toronto’s TSX 2.9%, S&P SmallCap 600 3.9%, Nasdaq Composite 3.1% while Australia’a ASX 200 only rose 0.24%.
The group of decliners included;
Nickel (2.5%), Urea (U.S. Gulf) (2.5%)
August 14, 2022
by Rob Zdravevski
rob@karriasset.com.au