The following assets (on a weekly timeframe) registered an Overbought reading or traded more than 2.5 standard deviations above its rolling mean.
Extremes “above” the Mean (at least 2.5 standard deviations)
Nil
Overbought (RSI > 70)
Tin (for the 10th week)
Gasoil
Heating Oil
RBOB Gasoline
WTI Crude Oil
Brent Crude Oil
Iron Ore
Hot Rolled Coil Steel
Orange Juice
the CRB (commodities) index
France’s CAC-40 equity index (for the 12th consecutive week)
Korea’s KOSPI equity index
Switzerland’s SMI equity index (for the 3rd week)
the Nasdaq 100
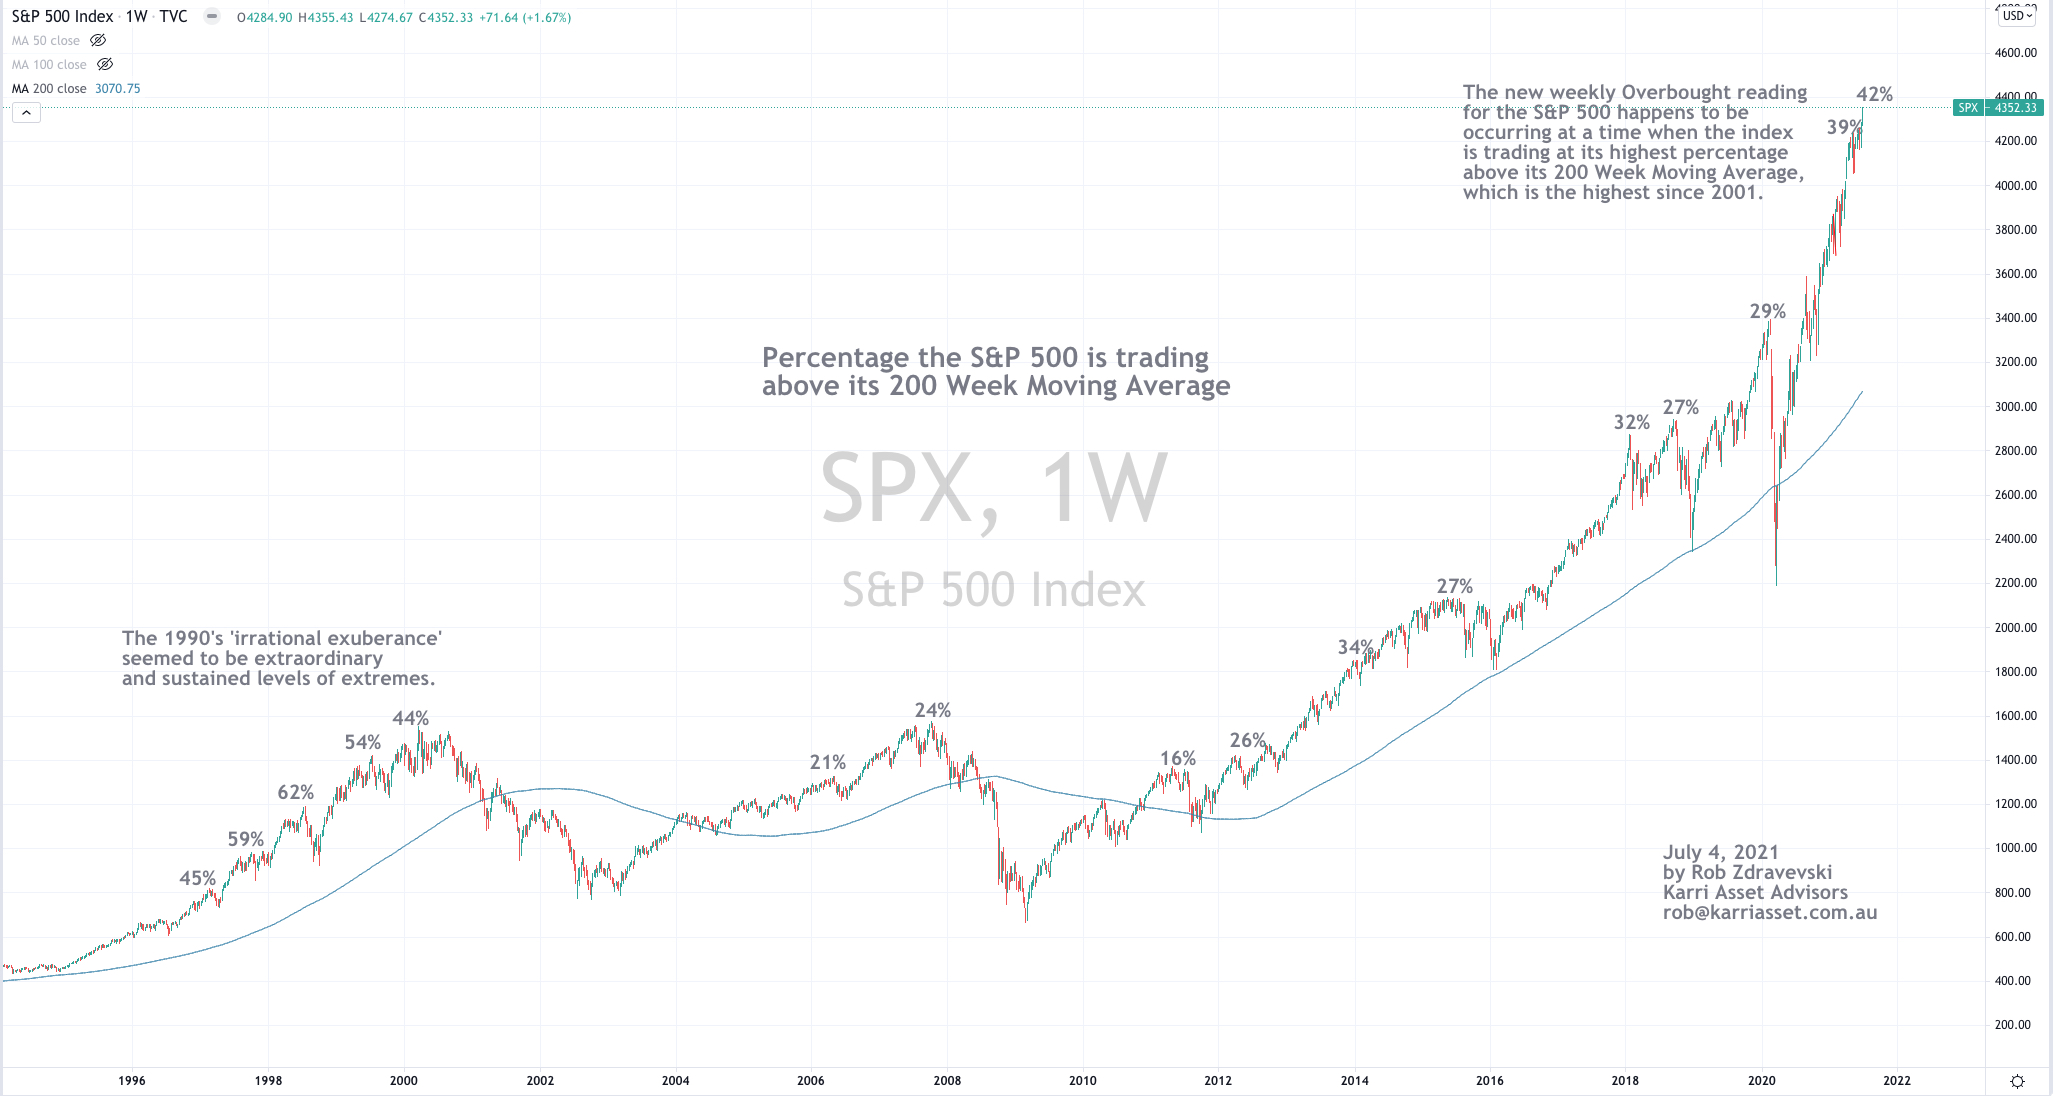
the S&P 500
and the Copenhagen, Stockholm and Helsinki equity indices.
The Overbought Quinella – Both Overbought and Traded at > 2.5 standard deviations above the weekly mean)
Natural Gas
Assets (securities) within my immediate universe which touched the other side of the extreme, being Oversold (where the RSI is < 30) or were at least 2.5 standard deviations below its mean are;
Extremes “below” the Mean (at least 2.5 standard deviations)
AUD/USD (for the 3rd consecutive week)
Oversold (RSI < 30)
Nil
The Oversold Quinella – Both Oversold and Traded at < 2.5 standard deviations above the weekly mean)
Nil
Notes & Ideas:
The list of extreme readings remains light as new trend are developing and mean reversions take place.
It’s time to prepare for when the new occurrences of extremes arise.
In the past week, most price volatility occurred in the commodity and equity markets, while currencies and bonds remained subdued.
Movers for the week include…
Aluminium +3%
Hot Rolled Coil Steel +7%
Natural Gas +6% (see my break-out trading call)
Leans Hogs rose 6% (after falling 17% in the past 2 weeks)
Corn rose 7%, recouping last week’s 8% decline
Soybeans +10%
The biggest news is the Nasdaq and S&P 500 rose (2.7% and 1.7% for the week respectively) to make new All-Time Highs and reach Overbought territory.
All while the Banking and Transports indices are not.
Furthermore, the Russell 2000’s high is back on March 15, 2021 and the MidCap 400 high was April 26, 2021.
Other notable moves included a 3.5% decline in the Hang Seng Index and a 4.2% fall in the Hang Seng China Enterprises Index (HSCEI)
Korea’s KOSPI and Australia’s ASX 200 were flat on the week and that was enough have their RSI reading ease below the Overbought 70 mark.
The U.S. 10 year bond yield it yet to break above 1.75%. The yield fell to 1.43% from last week’s 1.53%. The 10’s remain range bound. Markets could become explosive is they break either below 1.25% or above 1.65%.
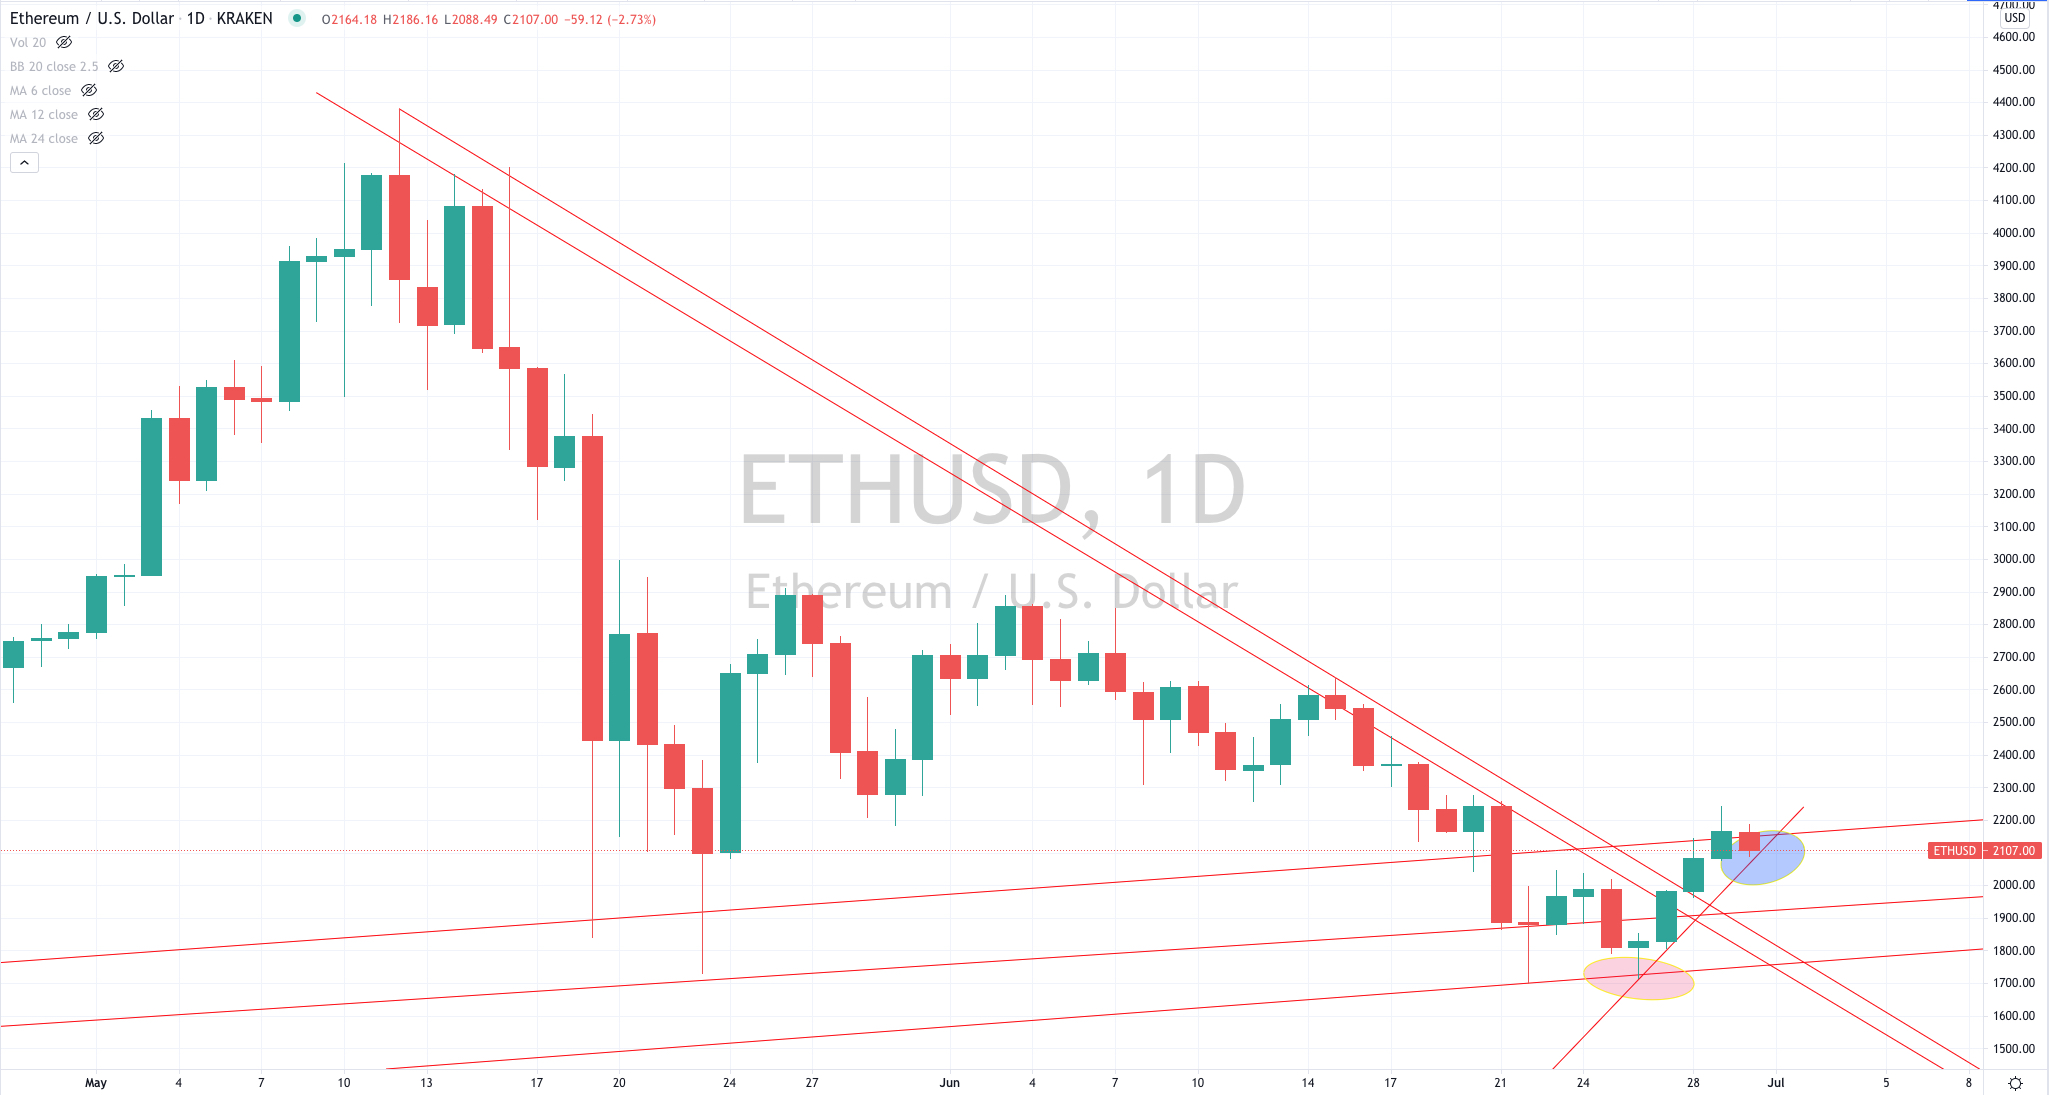
A mostly benign week for Cryptocurrencies except for Ethereum’s 12% rise.
Here is my Trading Buy call.
And lastly, Bitcoin is trading 154% above its 200 Week Moving Average, which is slightly higher than last week’s 149% reading and certainly lower when compared to its 466% peak in mid-April 2021.
July 4, 2021
by Rob Zdravevski
rob@karriasset.com.au