The following assets (on a weekly timeframe) registered an Overbought reading or traded more than 2.5 standard deviations above its rolling mean.
Extremes “above” the Mean (at least 2.5 standard deviations)
Cocoa
Shanghai Composite equity index
Russia’s MOEX equity index
Japan’s Nikkei 225 index
Overbought (RSI > 70)
Hot Rolled Coil Steel (for the 50th consecutive week)
Natural Gas
the Nasdaq 100 index
Amsterdam’s AEX,
and India’s NIFTY 50 equity index
The Overbought Quinella – Both Overbought and Traded at > 2.5 standard deviations above the weekly mean)
Aluminium
Assets (securities) within my immediate universe which touched the other side of the extreme, being Oversold (where the RSI is < 30) or were at least 2.5 standard deviations below its mean are;
Extremes “below” the Mean (at least 2.5 standard deviations)
None
Oversold (RSI < 30)
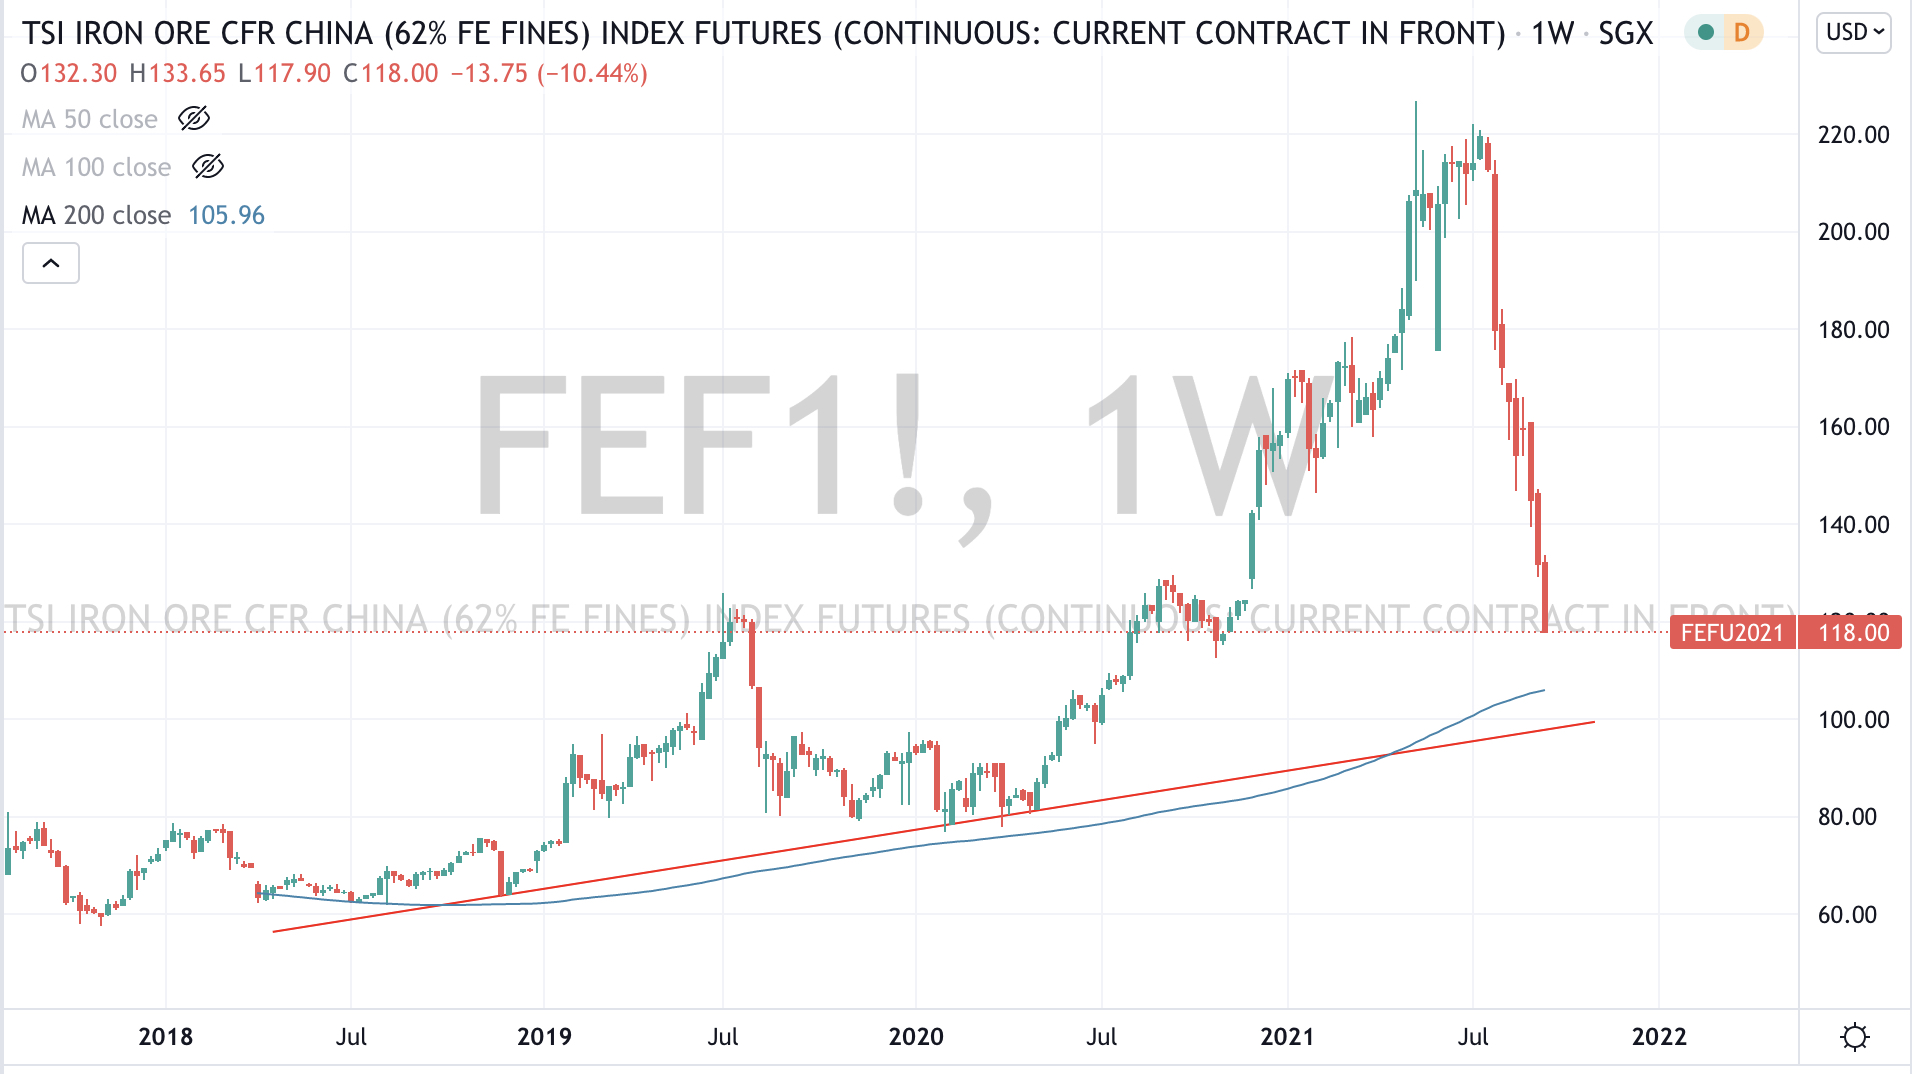
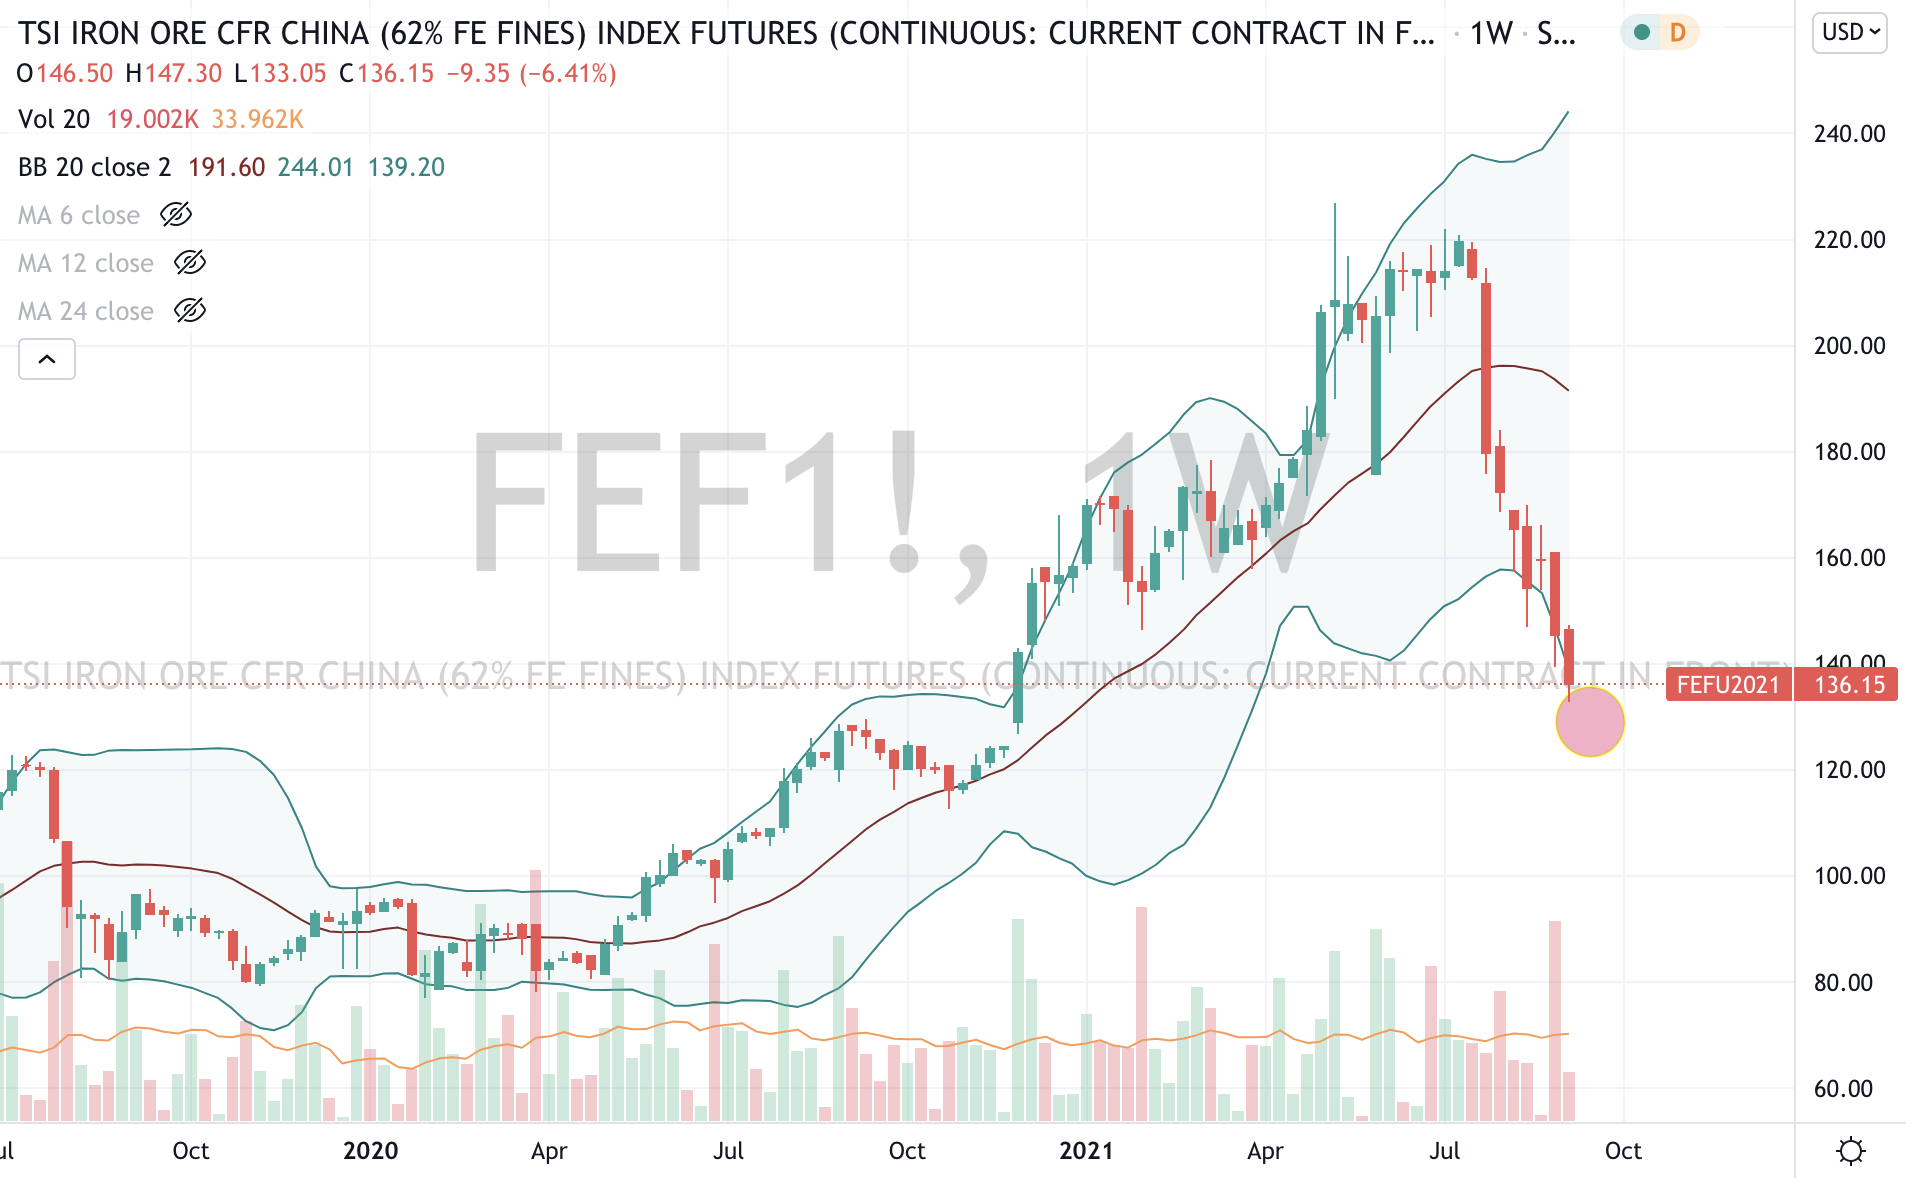
Iron Ore
Brazil’s BOVESPA equity index
Notes & Ideas:
This past week continued last week’s general muted state of activity especially amongst currencies and equities.
Notable departures from the list included the previously overbought Cattle, the S&P 500 and the Nordic stock exchanges.
This list is the smallest over the past 6 months.
The larger advancers over the past week comprised of Aluminium +7%, Natural Gas +5%, Nickel +4%, Copper +2.7% and China’s Shanghai and CSI 300 indices both rose 3.4%.
The Shanghai Composite has risen 8% in the past 3 weeks….
The group of decliners included Platinum (6.3%), Wheat (5%), Sugar (4%), Silver (3.6%), Tin (3.3%), Coffee (2.5%), Cocoa (2%), Gold (2%), Nikkei 22 (2.8%), S&P Midcap 400 (2.7%), both Dow Jones and Nasdaq Transportation indices fell 2.7%, the Bovespa, SMI and Kospi declined (2.3%), Spain’s IBEX (2%), the Dow Jones Industrial Average (2%), the S&P 500 (1.7%) and Australia’a ASX 200 fell 1.6% for the week.
September 11, 2021
by Rob Zdravevski
rob@karriasset.com.au