A story about the AUD and the ASX 200

Check out the chart below.

It is the Australian Dollar (vs USD) laid over the ASX 200.

(AUD in blue and the ASX 200 is in orange)

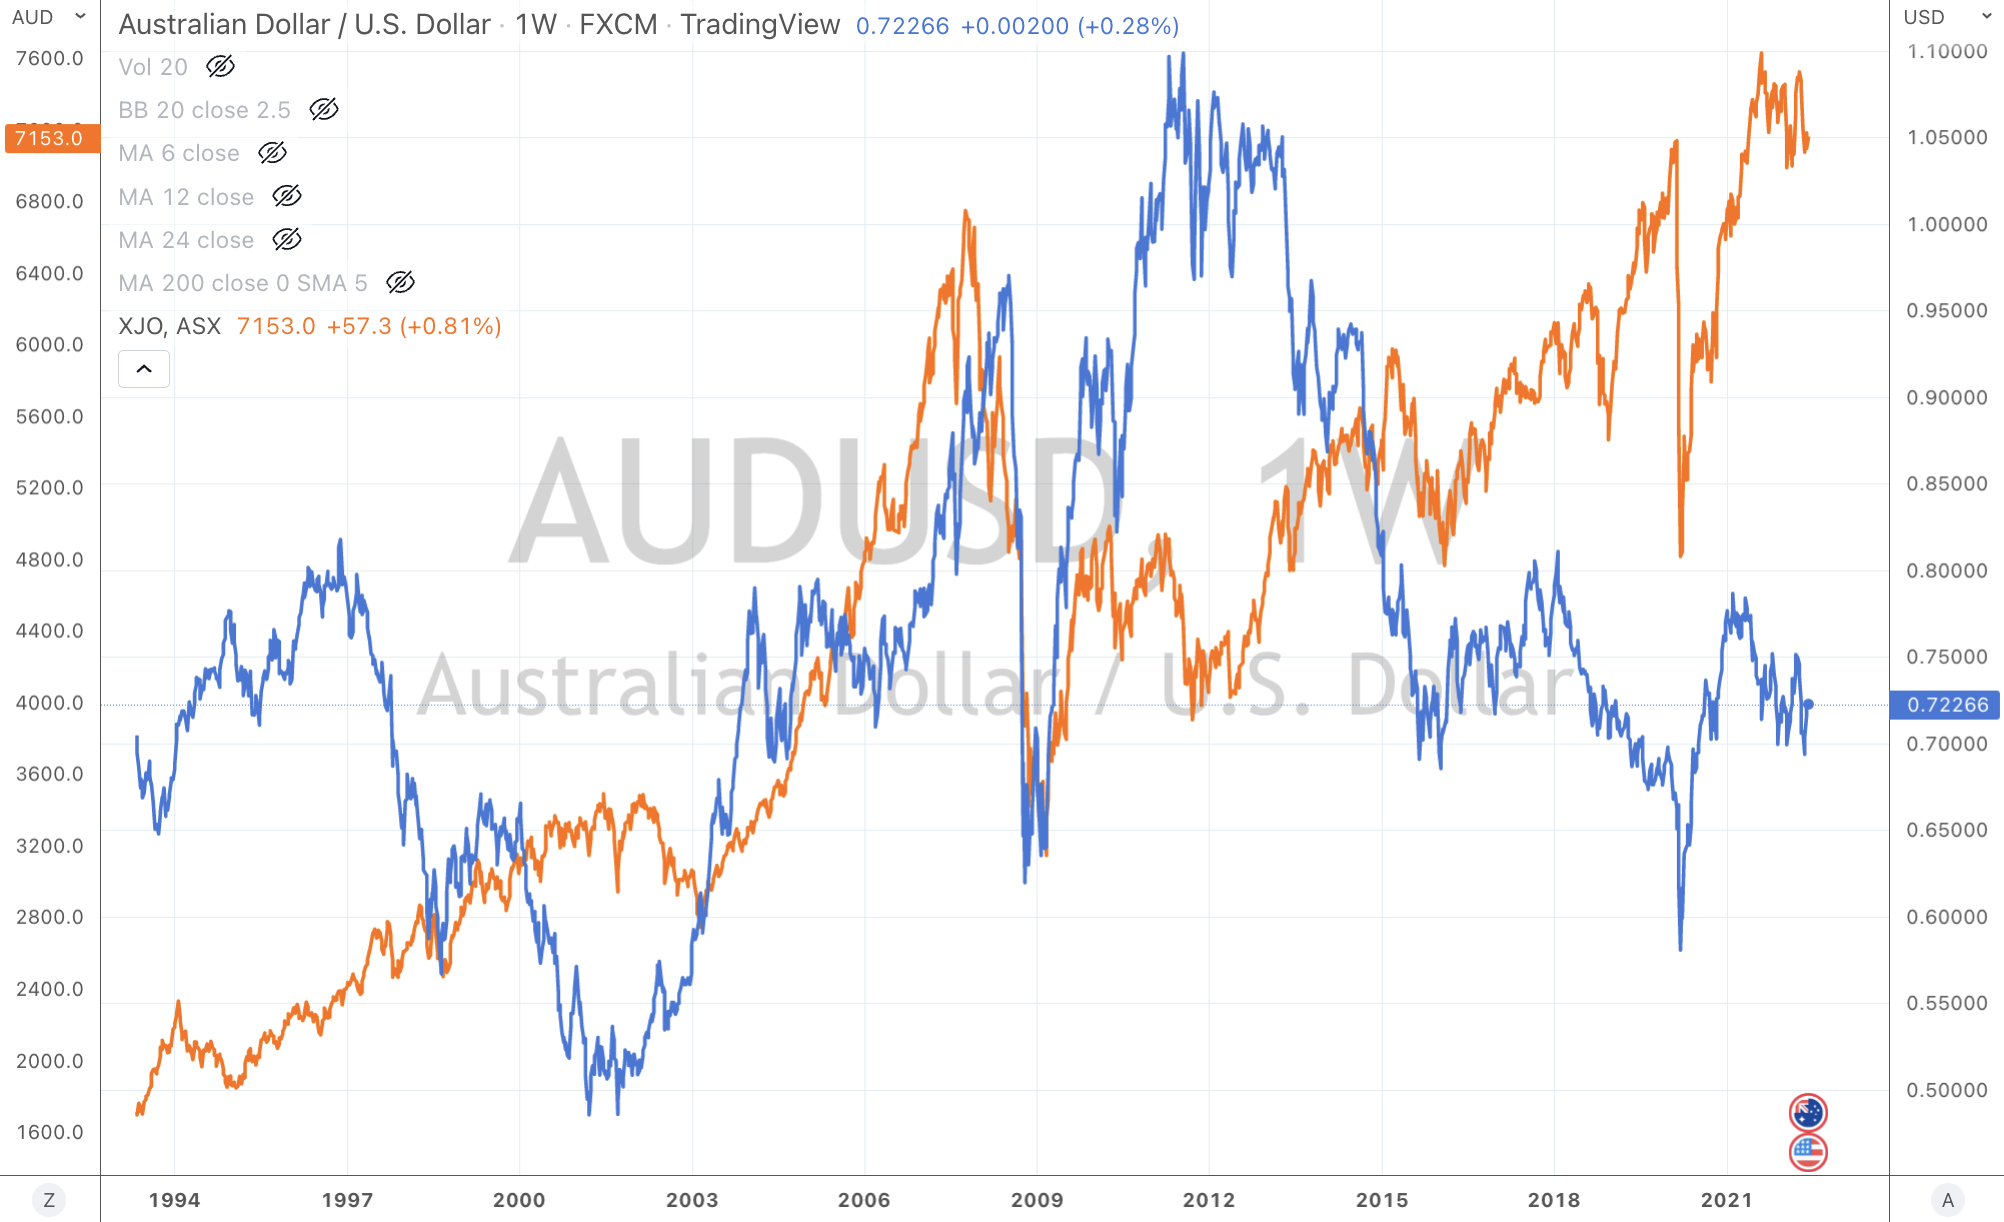
Other than a couple divergences (in 2001 and 2013), this 30 year chart shows that these two prices generally move in lockstep.

Some people also call this an analog or correlation.

However, the content in this note carries a correlation to a note written earlier this week, where I state that the AUD may rise a little to close that divergence to commodity prices……

but the larger move should be seen with a decline in commodity prices.

If we see this evolve, the ASX 200 is vulnerable due to its large weighting to commodity and mining related companies.

This earlier note (below) about the Australian Dollar versus the Japanese Yen is also related.

https://robzdravevski.com/2022/06/01/aussie-yen-leads-the-spx-in-risk/

In the AUD/JPY case, we already have a very strong Aussie. The Yen is at a 20 year low and trading at extremes Oversold levels against many crosses.

The USD is inversely at Overbought levels.

So, the if the USD takes a break and declines a little, then the Yen rises against it.

In turn, the AUD stays supported by weaker USD, but stifled from any meaningful advance by a stronger Yen.

I see a ‘lid’ holding the AUD from rising significantly.

A rising Yen signifies a little equity risk is in the air and specifically, the sector which is the ‘frothiest’ are commodities.

Should we see commodities decline, inflation will take a breather and those companies producing ‘end-product’ will see cheaper ‘input’ prices.

So, not all is lost.

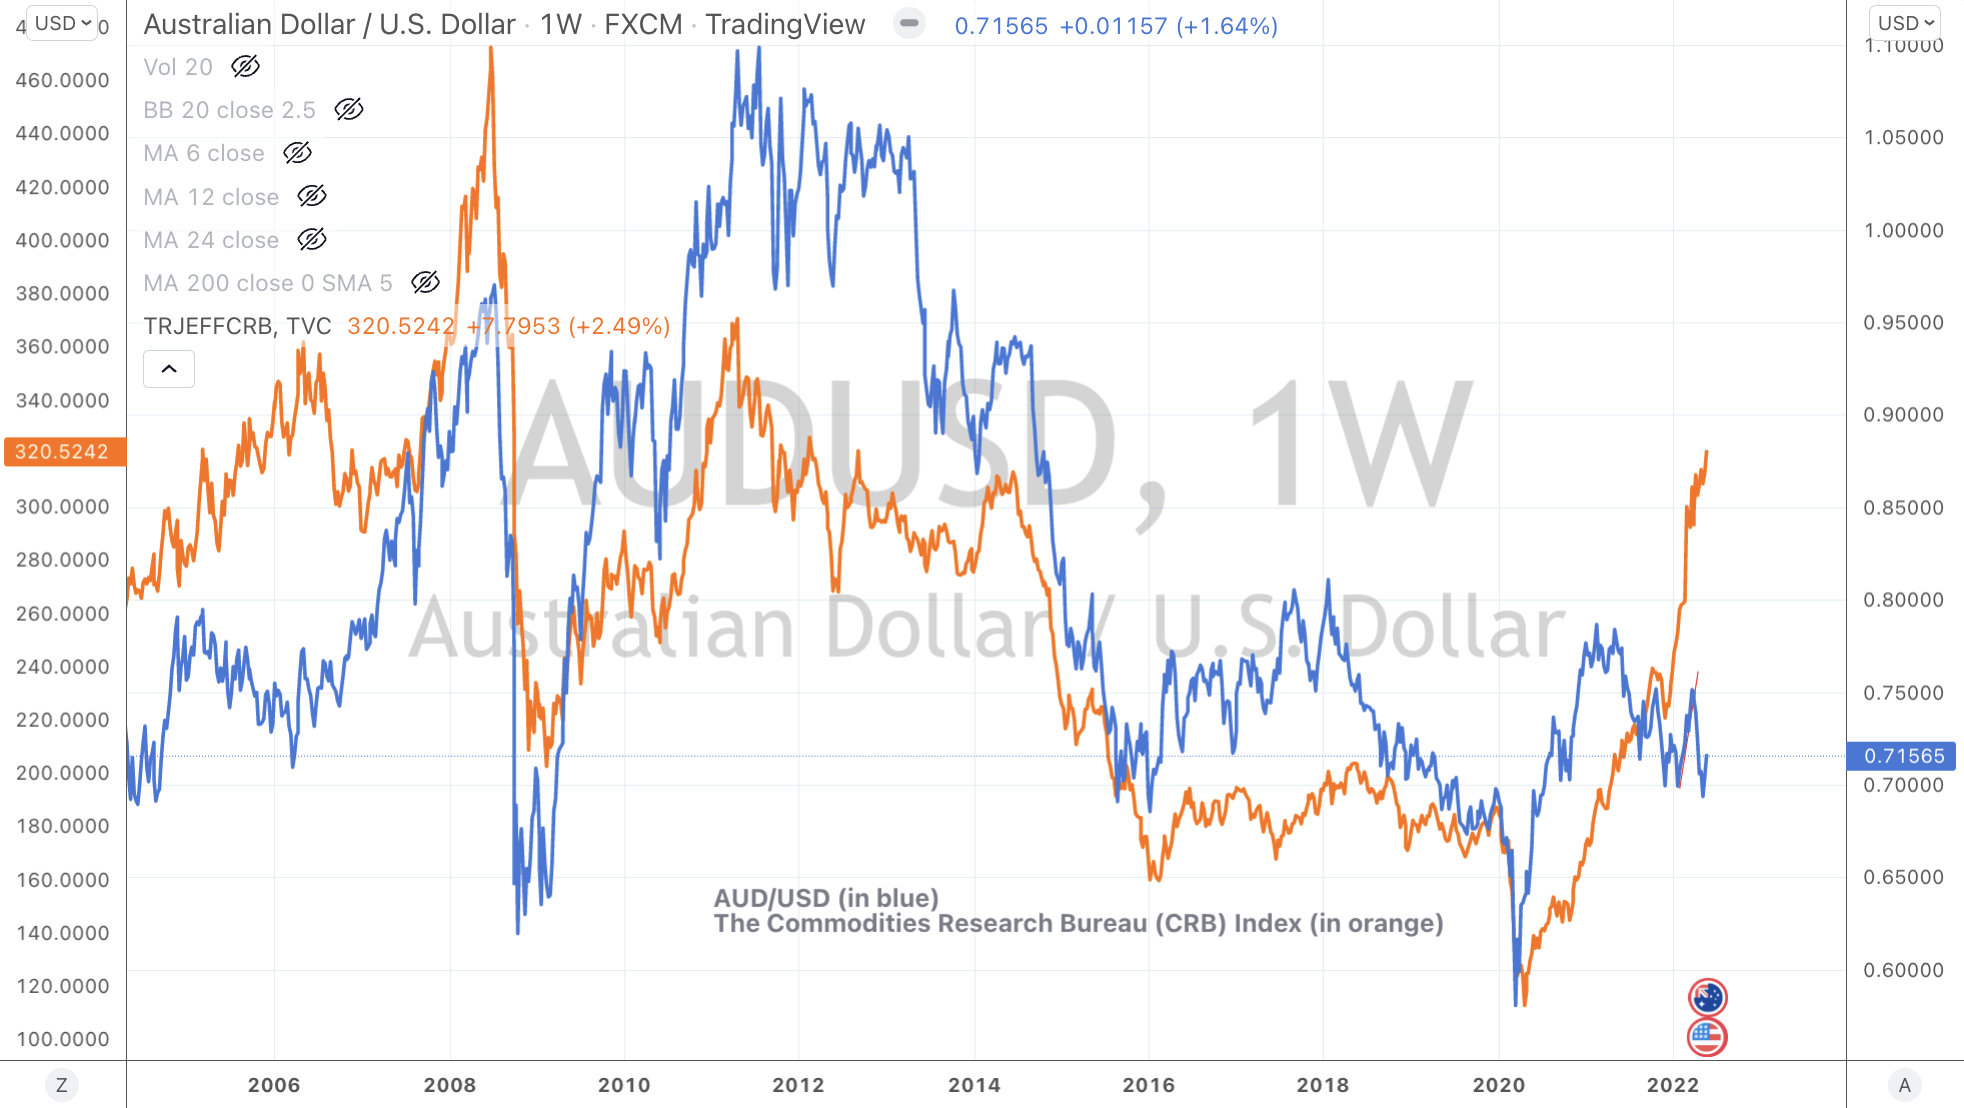
I’ll leave you with a chart showing the AUD/USD (the blue line) versus West Texas Intermediate (WTI) Crude Oil (in orange).

The AUD/USD would need to trade above 0.7670 before I entertain the possibility of a rally into the 80’s.

Otherwise, I’ll look for lower prices and mean reversion in a host of commodity prices before they decide their next move.

June 9, 2022

by Rob Zdravevski

rob@karriasset.com.au

AUD and Commodity prices aren’t in sync

Last week, I wrote about the relationship the S&P 500 has with the AUD/JPY currency cross.

The chart below shows the dance that the AUD/USD does with commodities prices.

To be specific, it’s with the CRB Index which tracks a basket of 19 commodities being, Aluminium, Cocoa, Coffee, Copper, Corn, Cotton, Crude Oil, Gold, Heating Oil, Lean Hogs, Live Cattle, Natural Gas, Nickel, Orange Juice, RBOB Gasoline, Silver, Soybeans, Sugar and Wheat.

Generally, when commodity prices rise, so does the Australian Dollar (especially against the U.S. Dollar)

It hasn’t been doing so lately.

What’s wrong?

Why the divergence?

Which index or price is the one to believe?

I think that overall, commodities prices will decline.

In the CRB’s case, perhaps by 25%, down to the 240 point region.

While the AUD/USD may converge up to a limit of 0.7640, but compared to its current level of 0.7180 it’s not a compelling bet. It’s more of something to watch should that price suit your strategic investment or corporate purposes.

June 7, 2022

by Rob Zdravevski

rob@karriasset.com.au

And now it’s the ‘mother’ of a peak in Natural Gas

On April 30, 2021, I wrote a note about the ‘mother’ of all breakouts.

The topic was about the price of Natural Gas.

At that time, Natural Gas was trading at $3.00.

The note (see link below) showed a pending trend reversal in a 20 year chart, not some little 3 week observation.

Then, the July 22, 2021 note was telling readers about taking some profits at $4.07

then on October 6, 2021, I wrote about selling the remainder of the position at $6.25

In the first chart below, I have placed annotations which follow the timeline of each of these posts.

Following the October 6, 2021 call of selling the balance of the position, the price of Natural Gas nearly halved within 3 months, falling to $3.54.

Whether it was the markets way of correcting a parabolic move or sorting out the ‘unnatural’ owners and late-comers, the price decline didn’t satisfy and reach my re-entry points and so…….I didn’t re-enter the trade.

Today, the Henry Hub Natural Gas price is $9.50

From the New Year low of $3.54 (this timing coincided with the peak in the S&P 500), Natural Gas performed a second surge to the current price of $9.50.

There is no crying over spilt milk here !

All within 12 months, the Natural Gas price doubled, then halved, then tripled….

Hardly normal stuff.

But I will now call the opposite of my April 30, 2021 note,

with my various indicators coupled with fundamental observations, 

for whether Henry Hub Natural Gas trades at $9.50 or $10.50, heed the extreme in this pendulum.

It’s the now looking like the ‘mother’ of all peaks.

The 20 year chart is below.

June 7, 2022

by Rob Zdravevski

rob@karriasset.com.au

SPX not at an extreme

I’m re-visiting my notes written in October 2021 and late December 2021, when the S&P 500 was reacquainting itself with historically high percentages it was trading above its 200 week moving average.

In the chart below, the S&P 500 isn’t touching those ‘extreme’s anymore.

This is a function of the mean ‘rolling higher’ and a healthy decline in the index.

Incidentally, since mid October 2021, that 200 week moving average has moved from 3,210 to its current reading of 3,500.

The S&P 500 is now ‘only’ 17% above that very long term mean, as seen in the chart below.

June 6, 2022

by Rob Zdravevski

rob@karriasset.com.au

Macro Extremes (week ending June 3, 2022)

The following assets (on a weekly timeframe) registered an Overbought or Oversold reading and/or have traded more than 2.5 standard deviations above or below its rolling mean.

Extremes “above” the Mean (at least 2.5 standard deviations)

None

Overbought (RSI > 70)

Australian 2, 3, 5 & 10 year government bond yields

Canadian, Swiss, German, Spanish, French, Greek, Italian, South Korean, New Zealand and Portuguese 10 year government bond yields

U.S. 2 & 5 year government bond year yields

U.S. Dollar (DXY) Index

Natural Gas

Gasoline

CRB Index

Bloomberg Commodity Index

WTI Crude Oil (September ’22 and December ’22 contracts)

USD/JPY

The Overbought Quinella – Both Overbought and Traded at > 2.5 standard deviations above the weekly mean)

None

Extremes “below” the Mean (at least 2.5 standard deviations)

None


Oversold (RSI < 30)

NZD/AUD

JPY/USD

TLT

The Oversold Quinella – Both Overbought and Traded at > 2.5 standard deviations above the weekly mean)

None

Notes & Ideas:

The big news for the week was the rise in global government bond yields. Following a couple down weeks, 10 year bond yields rose. Some examples include Spain moving from 2.09% to 2.47%, Germany’s yield increased from 0.98% to 1.26%, UK Gilts rose from 1.92% to 2.15% and the American 10’s climbed from 2.74% to 2.94%.

Many of these yields made new, recent highs…except for the U.S. Its high remains 3.20%.

While the Japanese 10’s tell us that things aren’t that bad as they idle around the 24 basis points mark.

Also notice there are only currency crosses in this weeks list. After weeks of telling you they are trading at extremes many are now making their way towards their weekly mean, or at the very least away from their ‘extremes’.

So much so, the U.S. Dollar (DXY) Index is no longer overbought.

I’m also reminding readers of the pertinency when assets and securities appear in each weeks list.

Most recent examples, include the Oversold lows seen in Chinese and Hong Kong stocks, the Oversold lows in U.S. indices such as S&P 500 and the Russell 2000 and South Korea’s Kospi’s which has risen 4.7% from its Oversold low of 2,550 on May 9th to its current 2,670 level.

These are not oversold any longer.

The CRB (commodities) Index remains overbought, for the 20th consecutive week.

The energy complex continued its strength, while subjectively its nearing stretched levels.

Copper rose for the week as did the Copper/Gold ratio. The latter hit and didn’t break resistance.

Lumber fell notably for the week and has halved since March. It closed the week at $623. The $500 – $560 range may prove an attractive entry point.

Cryptocurrencies were quiet, while one of the 6 or so darlings, Cardano rose 17%. I heard about Cardano from ‘retail’ investors when it was $3. I don’t hear about when it’s 56 cents.

In other news, grains were lower with Wheat leading the decline with a drop of 10%. As the ‘long’ soft’s is crowded and the probability of mean reversion is increasing, its a warning for farmers to lock in prices.

I’ll watch if Gold (in AUD) holds the A$2,500 level.

And perversely, the Shanghai Composite Index has risen 6.2% in 4 weeks, albeit in the face of Covid lockdowns, it’s a reminder of how markets factor in the news quicker than many expect.

The larger advancers over the past week comprised of; 

Rotterdam Coal 12.4%, WTI Crude 3.3%, Gasoil 12.8%, Copper 3.8%, Heating Oil 6.9%, JKM 6.1%, Nickel 8.5%, Platinum 7.8%, Gasoline 8.7%, Brent Crude 1.7%, Uranium 5.7%, Shanghai Composite 2.1%, AUD/JPY 3.6%, CSI300 2.2%, HSCEI 2.6%, Hang Seng 1.9%, Nikkei 3.7%, Copenhagen 2.5% and Taiwan’s TAEIX 1.8%.

The group of decliners included;

Australian Coal (18.4%), Aluminium (5.5%), China Coal (1.9%), Hot Rolled Coil Steel (3.4%), Lumber (10.3%), Natural Gas (2.3%), Palladium (2.9%), Rubber (2%), Dutch TTF Gas (9.3%), Corn (6.5%), Oats (1.9%), Rice (3.9%), Soybeans (2%), Wheat (10.2%), KBW Banking Index (1.7%), Italy’s MIB (1.9%), IBEX (2.3%) and the SOX fell 1.7%.  

June 5, 2022

by Rob Zdravevski

rob@karriasset.com.au  

Energy stocks – Heed the siren’s call

The oil and gas (energy) stocks are overcrowded.

As an illustration of only one measure which I use, the annotations on the chart below show the percentage that Hess Corp is trading above its 200 week moving average.

As you can see, the elastic band is looking a little stretched.

Go take a look at a bunch of stock prices of similar companies from Marathon, Occidental to Exxon and check if they are trading at similar extremes.

The call for ‘stronger and longer’ for energy stocks is fraught. This may be a good script for those who are ‘long’ at much lower prices, but if this ‘stay overweight energy’ news is reaching you now and with your ‘new money’ perhaps buying at these current prices…..

be aware of the siren’s call.

The contrarian was buying Brent Crude at $40, not $125.

Buying oil or energy related stocks at current prices, doesn’t provide you with an attractive risk/reward metric, let alone an adequate margin of safety.

In Hess’ case, what are looking at?

$30 up or $30 down…..this is hardly compelling, let alone tantalising.

June 3, 2022

by Rob Zdravevski

rob@karriasset.com.au

When government tries to frame the central bank

Don’t simply believe that central banks cause or can solve inflation.

The rhetoric, economic policy and legislation of government cause, create and add to rising prices.

Whether they allow energy exploration or development, subsidise housing with taxation free of capital gains, not encouraging longer term residential rental tenancies, not securing internal production supply of key commodities or food stuffs or placing tariffs on imports, government

Don’t be fooled by Joe Biden’s framing of remarks that he ‘respects an independent Fed’ etc etc…..should inflation not decline prior to the November 2022 mid-term elections, he is trying to set them up as the ‘fall guy’, when in turn he could have (as can Australian politicians) changed policies to help abate inflation.

Yet, it’s too late for Biden’s vote prospects to do that, so instead, they’ll work on a plan to blame the central bank for any short-comings.

In Germany, where you can lease a house for longer periods of time and where more than half the population rent, they are not seeing notable inflation in the cost of housing. (see graphic below)

It’s understandable that their price of energy is rising sharply, due to another policy error of relying too heavily on a key supplier.

Australia and the United States have energy resources.

Why are these locally sourced costs rising ?

It’s governmental economic policy to blame, not central bank monetary policy.

Graphic source: https://www.destatis.de/EN/Press/2022/05/PE22_221_611.html#:~:text=WIESBADEN%20%E2%80%93%20The%20inflation%20rate%20in,rate%20had%20been%20%2B7.4%25.

June 3, 2022

by Rob Zdravevski

rob@karriasset.com.au

Some price action notes on Wesfarmers (WES.AX)

The text in the chart below says….

$45.30 in Wesfarmers would signify
and coincide with the stock price;


1) touching 2.5 standard deviations below its weekly mean,

2) meeting its 200 week moving average and

3) registering a Weekly Oversold reading in the Relative Strength Index (RSI).

June 1, 2022

by Rob Zdravevski

rob@karriasset.com.au

Aussie/Yen leads the SPX in risk

The Aussie/yen is in blue,

The S&P 500 is the orange line,

the have a symbiotic relationship,

AUD/JPY leads the S&P 500 in directional moves,

as my ‘circles’ highlight.

June 1, 2022

by Rob Zdravevski

rob@karriasset.com.au

Macro Extremes (week ending May 27, 2022)

The following assets (on a weekly timeframe) registered an Overbought or Oversold reading and/or have traded more than 2.5 standard deviations above or below its rolling mean.

Extremes “above” the Mean (at least 2.5 standard deviations)

EUR/GBP

Overbought (RSI > 70)

Australian 2, 3, 5 & 10 year government bond yields

German, Spanish, French, Greek, Italian and Portuguese 10 year government bond yields

U.S. 2 government bond year yields

U.S. Dollar (DXY) Index

Natural Gas

Gasoline

CRB Index

Bloomberg Commodity Index

WTI Crude Oil (September ’22 and December ’22 contracts)

USD/JPY

The Overbought Quinella – Both Overbought and Traded at > 2.5 standard deviations above the weekly mean)

None

Extremes “below” the Mean (at least 2.5 standard deviations)

HKD/USD

CNH/USD

Dow Jones Transports

S&P 400 Mid Cap index

Nasdaq Transports

S&P 600 Small Caps


Oversold (RSI < 30)

JPY/USD

The Oversold Quinella – Both Overbought and Traded at > 2.5 standard deviations above the weekly mean)

None

Notes & Ideas:

The big news for the week was the stunning bounce in global equity indices especially in the United States. 

Musings in recent edition of ‘Macro Extremes’ about Oversold moments and a 7th consecutive weekly decline in some indices portended a change of direction.

Calling such a low was highlighted in my newsletter released earlier in the week 

https://mailchi.mp/karriasset/buy-signals-appearing

And in other posts such as;

https://robzdravevski.com/2022/05/21/a-different-way-looking-at-the-nasdaq/

https://robzdravevski.com/2022/05/20/a-rare-oversold-moment-for-the-sp-500/

https://robzdravevski.com/2022/05/12/mean-reversion-is-a-happening-thing/

Keep in mind that it doesn’t mean a change of trend, but merely a break of a streak.

Incidentally, there is little news in the financial media reporting that last week’s advance added a certain amount of trillions in market capitalisation, while we only hear of the trillions ‘wiped’ or ‘lost’…….and never about the trillions which are ‘found’.

In other news, the 5 and 10 year U.S. government bond yields are not Overbought. 

While the CRB (commodities) Index remains overbought, for the 19th consecutive week….the U.S. Dollar Index (DXY) ended 6 consecutive week of ‘overboughtness’.

The chart below shows the recent divergence of the AUD/USD and broader commodity prices.

Probability is increasing of a weaker US dollar as a means of simply retracing the recent bullish move, although there isn’t much talk about commodity prices easing, let alone reverting to any chosen mean.

The Baltic Dry Index (shipping costs) took a break and fell 20% following a 51% advance in the previous 6 weeks.

Bitcoin fell again (another 5%) and has declined 50% over the past 9 weeks. 

The larger advancers over the past week comprised of; 

Bloomberg Commodity Index 2.5%, China Coal 2.6%, WTI Crude 4.3%, Gasoil 9.4%,  Heating Oil 7.1%, JKM LNG 3.7%, Coffee 6.3%, Lumber 4.2%, LNG 3.1%, Tin 3.3%, Natural Gas 8%, Orange Juice 6.2%, Palladium 5.4%, Gasoline 2%, Silver 2%, CRB Index 2.5%, Dutch TTF Gas 4.2%, Brent Crude 5.9%, Oats 14.9%, AEX 2.8%, KBW Banking Index 9.2%, French CAC 3.7%, German DAX 3.4%, Dow Jones Industrials 6.3%, DJ Transports 7.1%, Italy’s MIB 2.3%, Spain’s IBEX 5.3%, Bovespa 3.2%, S&P MidCap 400 6.5%, Nasdaq 100 7.2%, Osloa 3.1%, Helsinki 3.9%, Stockholm 3.2%, Russell 2000 6.5%, Swiss SMI 3%, Philadelphia Semiconductor (SOX) Index 8.1%, S&P 500 6.6%, U.K.’s FTSE 2.7%, Canada’s TSX 2.7%, S&P SmallCap 600 6.7%, Nasdaq Biotech Index 2.8% and Australia’s ASX 200 rose 0.5%.

The group of decliners included;

Baltic Dry Index (19.8%), Australian Coal (2%), Aluminium (2.6%), Rotterdam Coal (13.5%), Hot Rolled Coiled Steel (13.7%), Nickel (2.6%), Cotton (2%), Urea (5.1%), Bitcoin (4.6%), Ethereum (13.5%), Cardano (15.1%), CSI 300 (1.9%).

May 29, 2022

by Rob Zdravevski

rob@karriasset.com.au