A consolidating ASX 200
September 25, 2020 Leave a comment
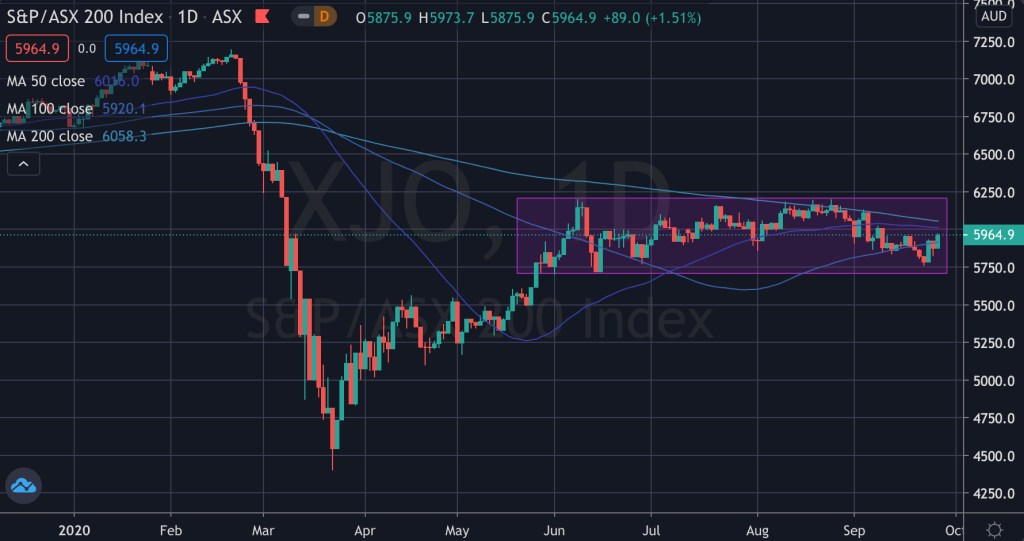
A reminder that the ASX 200 has traded in a “sideways parallel channel” since May 27, 2020.
That’s 4 months !
Trying to hear what's not being said
September 25, 2020 Leave a comment
A reminder that the ASX 200 has traded in a “sideways parallel channel” since May 27, 2020.
That’s 4 months !
September 25, 2020 Leave a comment
I don’t think equity indices will register oversold RSI readings in this current retracement.
Stocks, currencies and commodities have all had a nice mean reversion, some of the latter “went” oversold BUT “stuff” hasn’t crossed over nor match or have done the things they are supposed to, to tell me that we have deeper to fall.
Thus, I have been adding to positions, initiated some new holdings……it’s not all-in, but I have deployed some capital earlier this week….
today, it’s a bit “safer” than 3 days ago to buy some securities.
As always, do your research or seek advice.
September 25, 2020
by Rob Zdravevski
rob@karriasset.com.au
September 22, 2020 Leave a comment
Equity Index targets mentioned in last week’s newsletter have been reached.
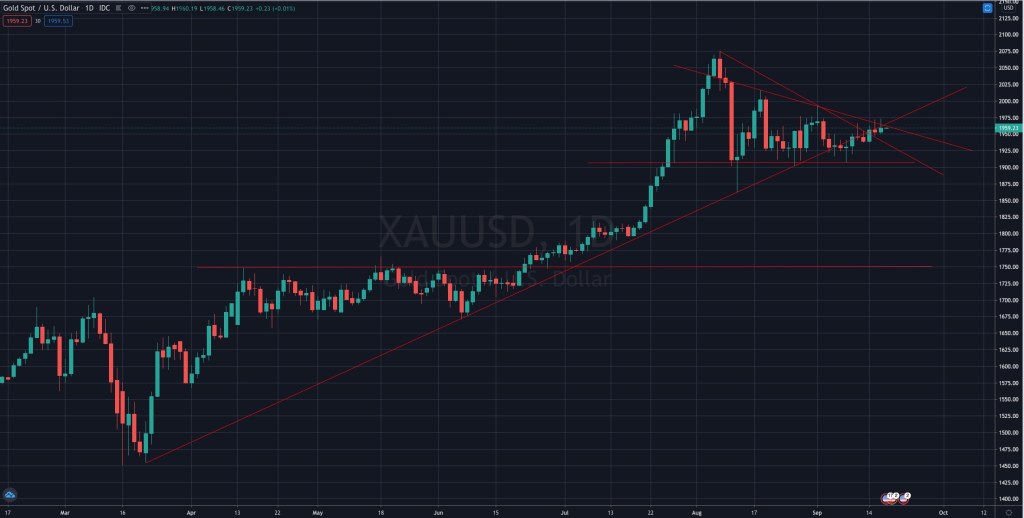
Gold still holding $1,902
Watching the currencies closely.
An obscure indicator for directional moves in equities is Bitcoin. Let’s see if it holds the $10,100 region.
https://mailchi.mp/karriasset/market-quips-september-18-2020
September 22, 2020
by Rob Zdravevski
rob@karriasset.com.au
September 22, 2020 Leave a comment
A little short-term macro correlation illustration
Below is a 5 minute chart of the AUDJPY versus the S&P 500 mini futures. <AUDJPY is in blue>
Beyond the correlation, note how the currency tends to lead the equity index.
I’ve placed a couple circles to show when a decline in the AUD against the Yen coincided with a fall in the S&P 500 futures.
September 22, 2020
by Rob Zdravevski
rob@karriasset.com.au

September 21, 2020 Leave a comment
It just seems like the age of the stockpicker and macro trader is upon us.
The challenge lays ahead for the passive ETF index hugger.
September 21, 2020
by Rob Zdravevski
rob@karriasset.com.au
September 18, 2020 Leave a comment
| Market Quips & Synopsis Some brief points about selected markets or assets and look for the links within for added musings. About current markets, I’ll open up by saying.. I notice there is dangerous trading going on, market capitalisations in some companies are extraordinary. For example, how does $1 billion market cap on revenues of $20,000 sound? ASX scuttlebutt says, “shorts” are trying to pressure companies into raising capital, some are seeing increased stock “promotion” activity and there are many people in the market “that don’t know what they’re doing or shouldn’t be there”. I see the AUD and XAU (Gold) in a holding pattern, (see the AUD chart below); they need to hold 0.7240 and $1,902 respectively, breaks above 0.7355 & $1,978 should see a new lurch higher Also watching AUDJPY closely, need to hold 76.00 to confirm “more risk-off”, A move above 0.7730 suggests “risk-on” and higher equity indices Another indictor to assess the steam in a S&P 500 decline is whether Japanese 10 Year Bonds (JGB”s) trade below 0.00%. The S&P 500 is down 6% from recent highs, Indicators are not clear in calling a new downward trend, however I think 3,272 is the target (a further 2.5% lower). The Nasdaq 100 has now fallen 11% since its September 2nd high. Looking for it to ease a further 2.4% to 10,814 before determining the strength of the decline. The decline wasn’t a surprise, as written by me on August 29 and September 3rd Global portfolios have a 3% short position in either (or both) the Nasdaq 100 or the SOX index My ASX 200 target is 5,803, which is 1.2% below the price as I write. I’m pleased with calling Oil down from $44 to $39.30. Brent held $39.30 for the past week, has since rallied 10% in past 4 days….quick rallies are not always a preferred scenario VIX remains relatively high at a reading of 26, the call option phenomenon has influenced this increase The De-Equitisation story combined with rising money supply & low interest rates leads to my thesis that higher equities is the dominant and over-arching long term theme. While we accept near-term rates will stay Lower for a while, I think the long end of interest rate curve will rise. AAII Survey exhibiting narrowest bull/bear spread since June 11, which is when S&P 500 had a 8.2% decline. Since March 5th, more retail investors have remained bearish (than bullish). This survey remains a reasonable contrarian indicator as markets bottommed on March 26th and never looked back. Oil Rig count showing no meaningful change of increase, see attached, number of rigs in operation has halved I remain long term bullish on the Oil price and continue to accumulate positions (proxies) to benefit from this opinion. Incidentally, I have a view there is a coming crisis in energy prices which will stoke inflation (albeit it may be 18 months away) In another edition, I’ll expand on various investing themes and I hope to soon publish my bullish thinking about Platinum on my Linkedin page. That’s all for now… warm regards, Rob |

September 17, 2020 Leave a comment
Short term views include;
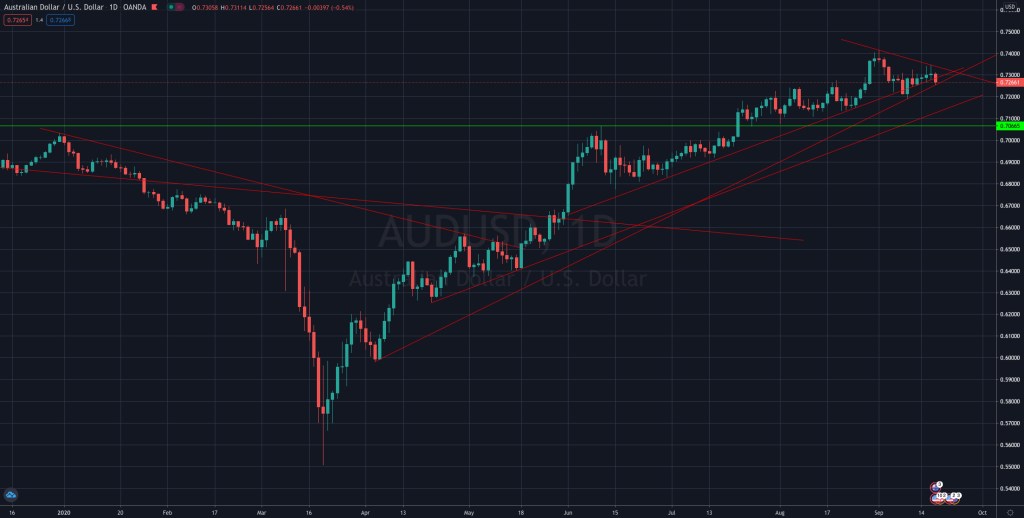
AUD/USD needs to hold 0.7240, otherwise it moves lower to 0.7140 or test 0.7067. (see chart below)
Coinciding, AUD/JPY needs to hold 76.05, this FX cross seems to leading risk-off sentiment in equities markets;
My ASX 200 target is 5,803;
S&P 500 direction not conclusive, thus…
Bias is to accumulate on weakness, although developing downtrends need to be monitored.
Gold short term downtrend, albeit not a strong trend,
needs to hold $1,902 support, other $1,825 region is next stop
(see chart below);
thus caution on Aussie gold stocks may increase;
Note, Brent rallied 6% in 2 days, as it held $39.30 (which remains important support);
Hope to summarise my Long Platinum view in coming days;
And I’m holding a 3% portfolio short index weight for global portfolios in U.S. listed SMH
September 17, 2020
by Rob Zdravevski
rob@karriasset.com.au
September 17, 2020 Leave a comment
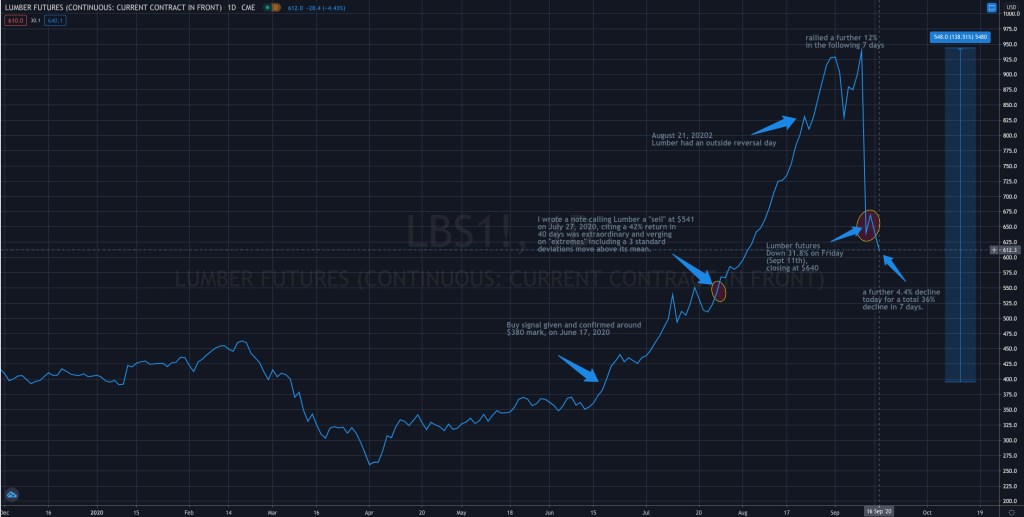
so the previous post shows the chart up until I issued a Sell advice on Lumber,
but the chart below shows the whole picture before and after….
My late July 2020 Sell advice followed a 42% rise in 40 days, which is exceptional for any asset let alone a physical commodity.
Lumber then rallied a further 74% over the next 6 weeks before falling 36% this past week.
A bull market coupled with euphoria, mania and mean reversion all within 3 months.
Hopefully, homebuilding costs in the United States reflect the sudden and lower prices?
September 17, 2020
by Rob Zdravevski
rob@karriasset.com.au
September 17, 2020 Leave a comment
I suggested Lumber (futures) were a “Buy” in mid-June.
A month later it was time to sell.
A good trade by all accounts.
Below is the chart, at that time…..
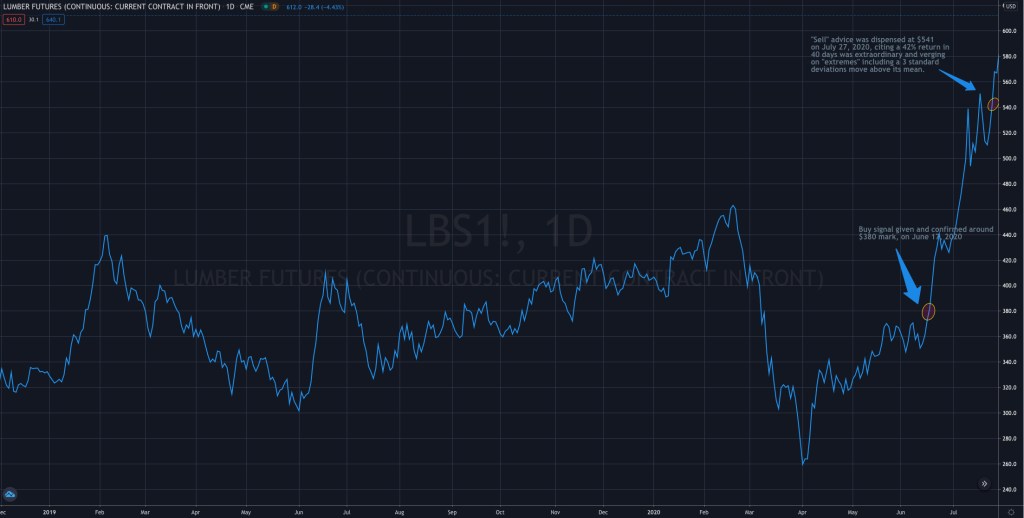
then, look at my next post to what happen afterwards
September 16, 2020 Leave a comment
“By the end of 1980, six out of the top ten companies by market capitalisation were energy related related as was one third of the S&P 500” – Goehring & Rozencwajg
40 years later that landscape is very different.
Today, the energy component of the S&P 500 is 2.8%. The lowest on record.
