Understanding Gold’s probability

The #Gold Bugs won’t like this view.

“When Gold registers a monthly overbought signal and is trading at > 40% above its 50 month moving average, the price consolidates and is followed by a concerted effort at mean convergence”

It’s a little different initiating a new ‘long’ at todays prices compared to being ‘long’, long ago.

Reports suggesting a ‘melt-up’ have validity because of momentum, but one should forfeit the right to complain if gravity takes hold.

March 5, 2025

Screenshot

more about Gold

For the past 3 weeks, my weekend ‘Macro Extremes’ newsletter has cited Gold was trading in ‘overbought’ territory.

This doesn’t mean to ‘short it’……instead it warns of being careful if initiating new long positions at those moments.

But gold bugs and journalists were carrying on about new highs and the prospects of higher prices……

I spend much time telling clients “No’ rather than ‘Yes’.

And so, good gold mining companies such as Barrick Gold are now trading 20% below than their recent highs.

Others have slumped 30% in a short time.

Remember, it’s not about shorting the stock…

rather, I’m interested in buying soon.

November 13, 2024

rob@karriasset.com.au

Screenshot

Now, I like Newmont

Yesterday, Newmont Mining’s (NEM:US) quarterly result was not well received by the stockmarket.

Its shares fell 13%.

I’ve been waiting for cheaper prices in Newmont Mining and has mentioned this is various writings, with the most recent post link attached.

A day later, NEM stock bounced 3.5%.

Its recent closing price is $46.14

Only 3 month ago, Newmont’s stock price was $86.

That was April 18th, 2022

Its market capitalisation was $66 billion.

On April 20th, 2022, I wrote this note, calling for Newmont’s stock price to ease.

An extract from that note was, “…….it’s plausible that Newmont uses its well priced equity to make some acquisitions or raise some capital itself.”

Today, it’s market cap is $35.4 billion

Now I’m wishing to buy the stock at $42.80. 

Furthermore, we’ve seen 35% of the total shares outstanding (502 million) turnover since that April high.

While 300 million shares or 21% of its share issuance have traded in the past 9 weeks, which 8 of those weeks posted negative returns.

When coupled with the indicators on the chart below, I’d say we are looking a picture of exhaustion and cumulative amount of volume capitulation.

July 27, 2022

by Rob Zdravevski

rob@karriasset.com.au

Newmont price to ease

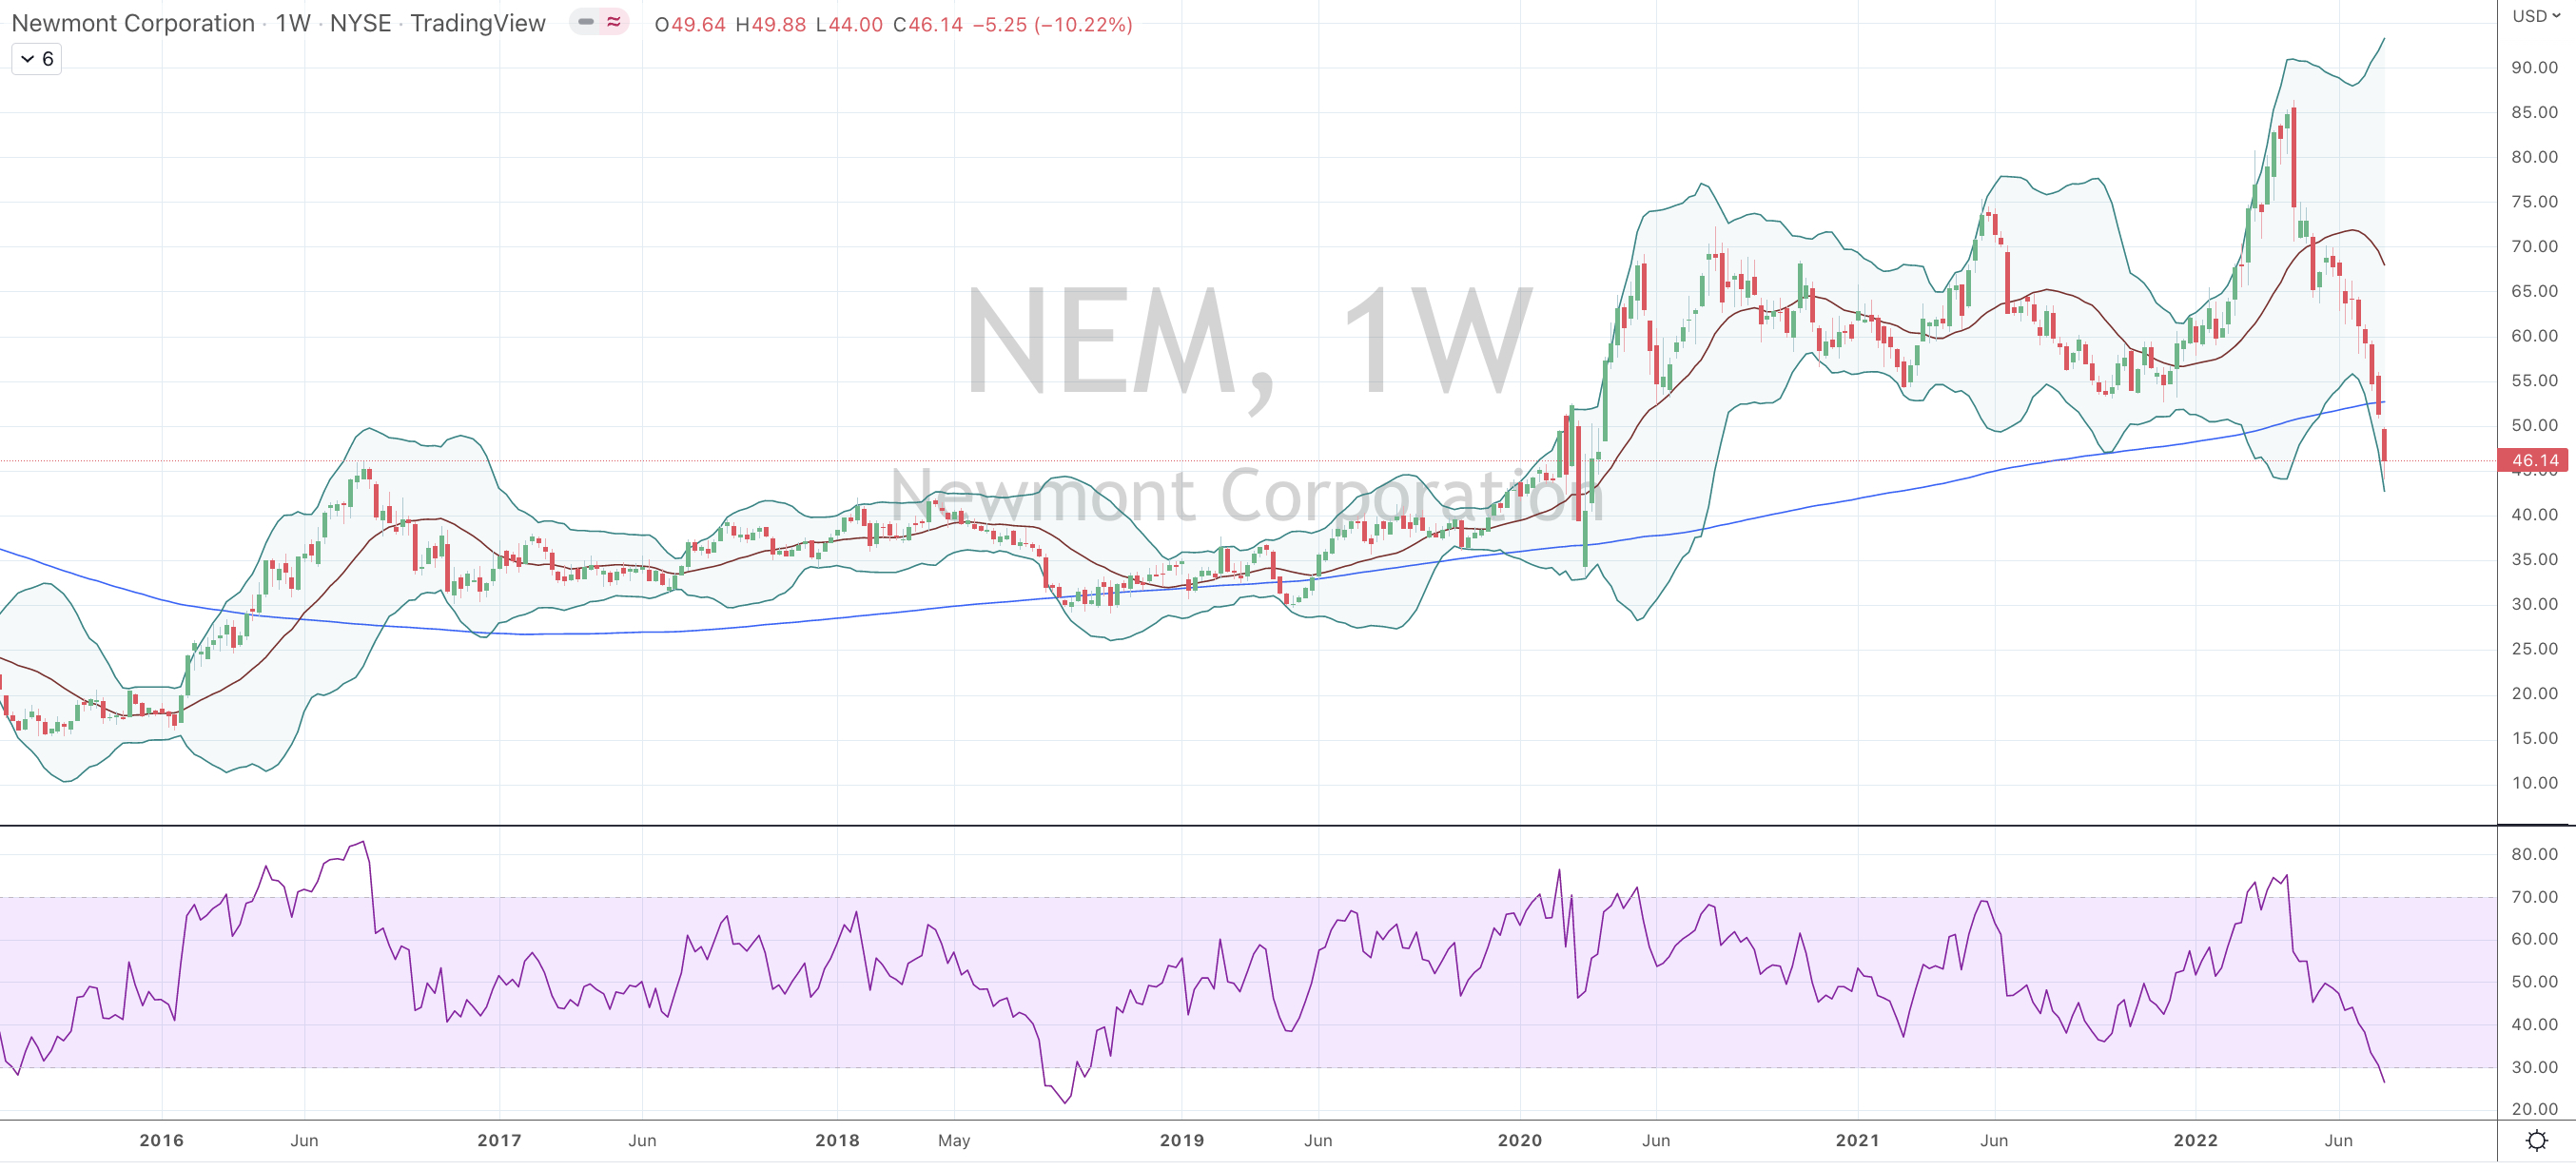
In a continuation of my Alcoa post earlier today, Newmont Mining’s stock price is now dancing at ‘extremes’ not seen for some time.

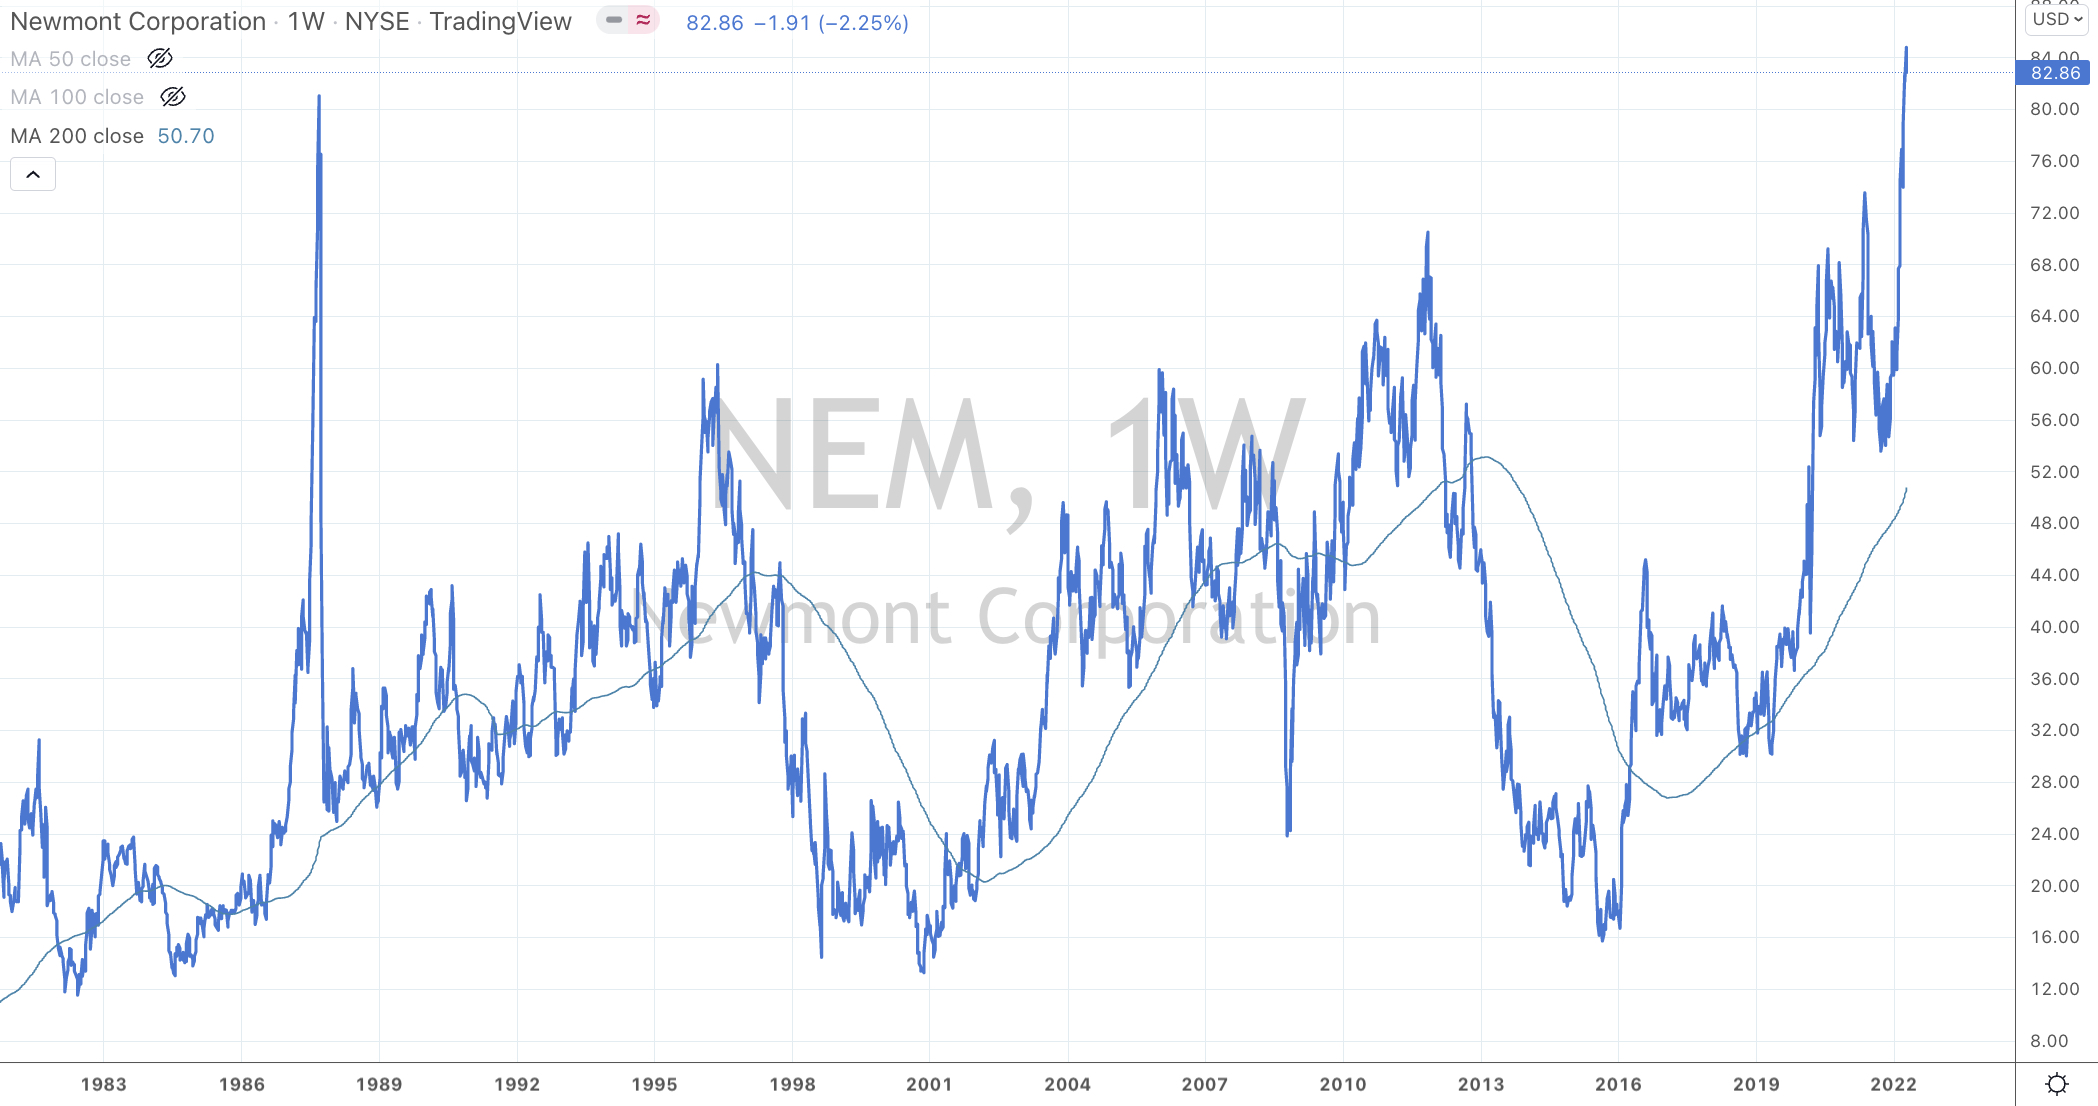
The first chart below is an illustration of the various times that Newmont’s stock price has traded at high levels of percentage above its 200 weekly moving average.

Other than the shocks of the respective 1981 interest rate hikes and the 1987 stockmarket crash, Newmont Mining’s stock price doesn’t necessarily spend time up in this stratosphere.

My case is not a one-way street.

Note the highlighted ellipse in the chart surrounding 2003 and 2005.

Newmont trades at 101% above its 200 WMA in the last part of 2003, then attempts a mean reversion to then rise back to the same stock price, YET the percentage reading is ‘only’ 57%.

This is because the 200 WMA ‘rolls up’ quickly to catch up with the parabolic move seen through 2003.

The 200 WMA will move higher, while NEM stock price declines.

This is the convergence that I mention in the previous Alcoa post.

So, I’l look for Newmont’s stock to work its way back to the $64-$68 mark in the coming 9-13 months.

The second chart compares Newmont to the Gold price (in USD).

Similar to Alcoa, it’s plausible that Newmont uses its well priced equity to make some acquisitions or raise some capital itself.

April 20, 2022

by Rob Zdravevski

rob@karriasset.com.au