The fat part of the trade in SAP shares has been seen.
My probabilities and the risk/reward ratio suggest so.
Although the stock price is making new higher high’s, a trifecta of weekly ‘extremes’ combined with the stock price completing a 7 week winning streak, it’s time to take the money and run.
8 consecutively rising weeks are rarely seen.
Furthermore, its valuations make it challenging to add to the position, let alone continue holding it.
I’ll wait for EUR 92.50 before being interested again.
This is much like my similar thoughts about Microsoft’s stock price as I wrote 2 weeks ago.
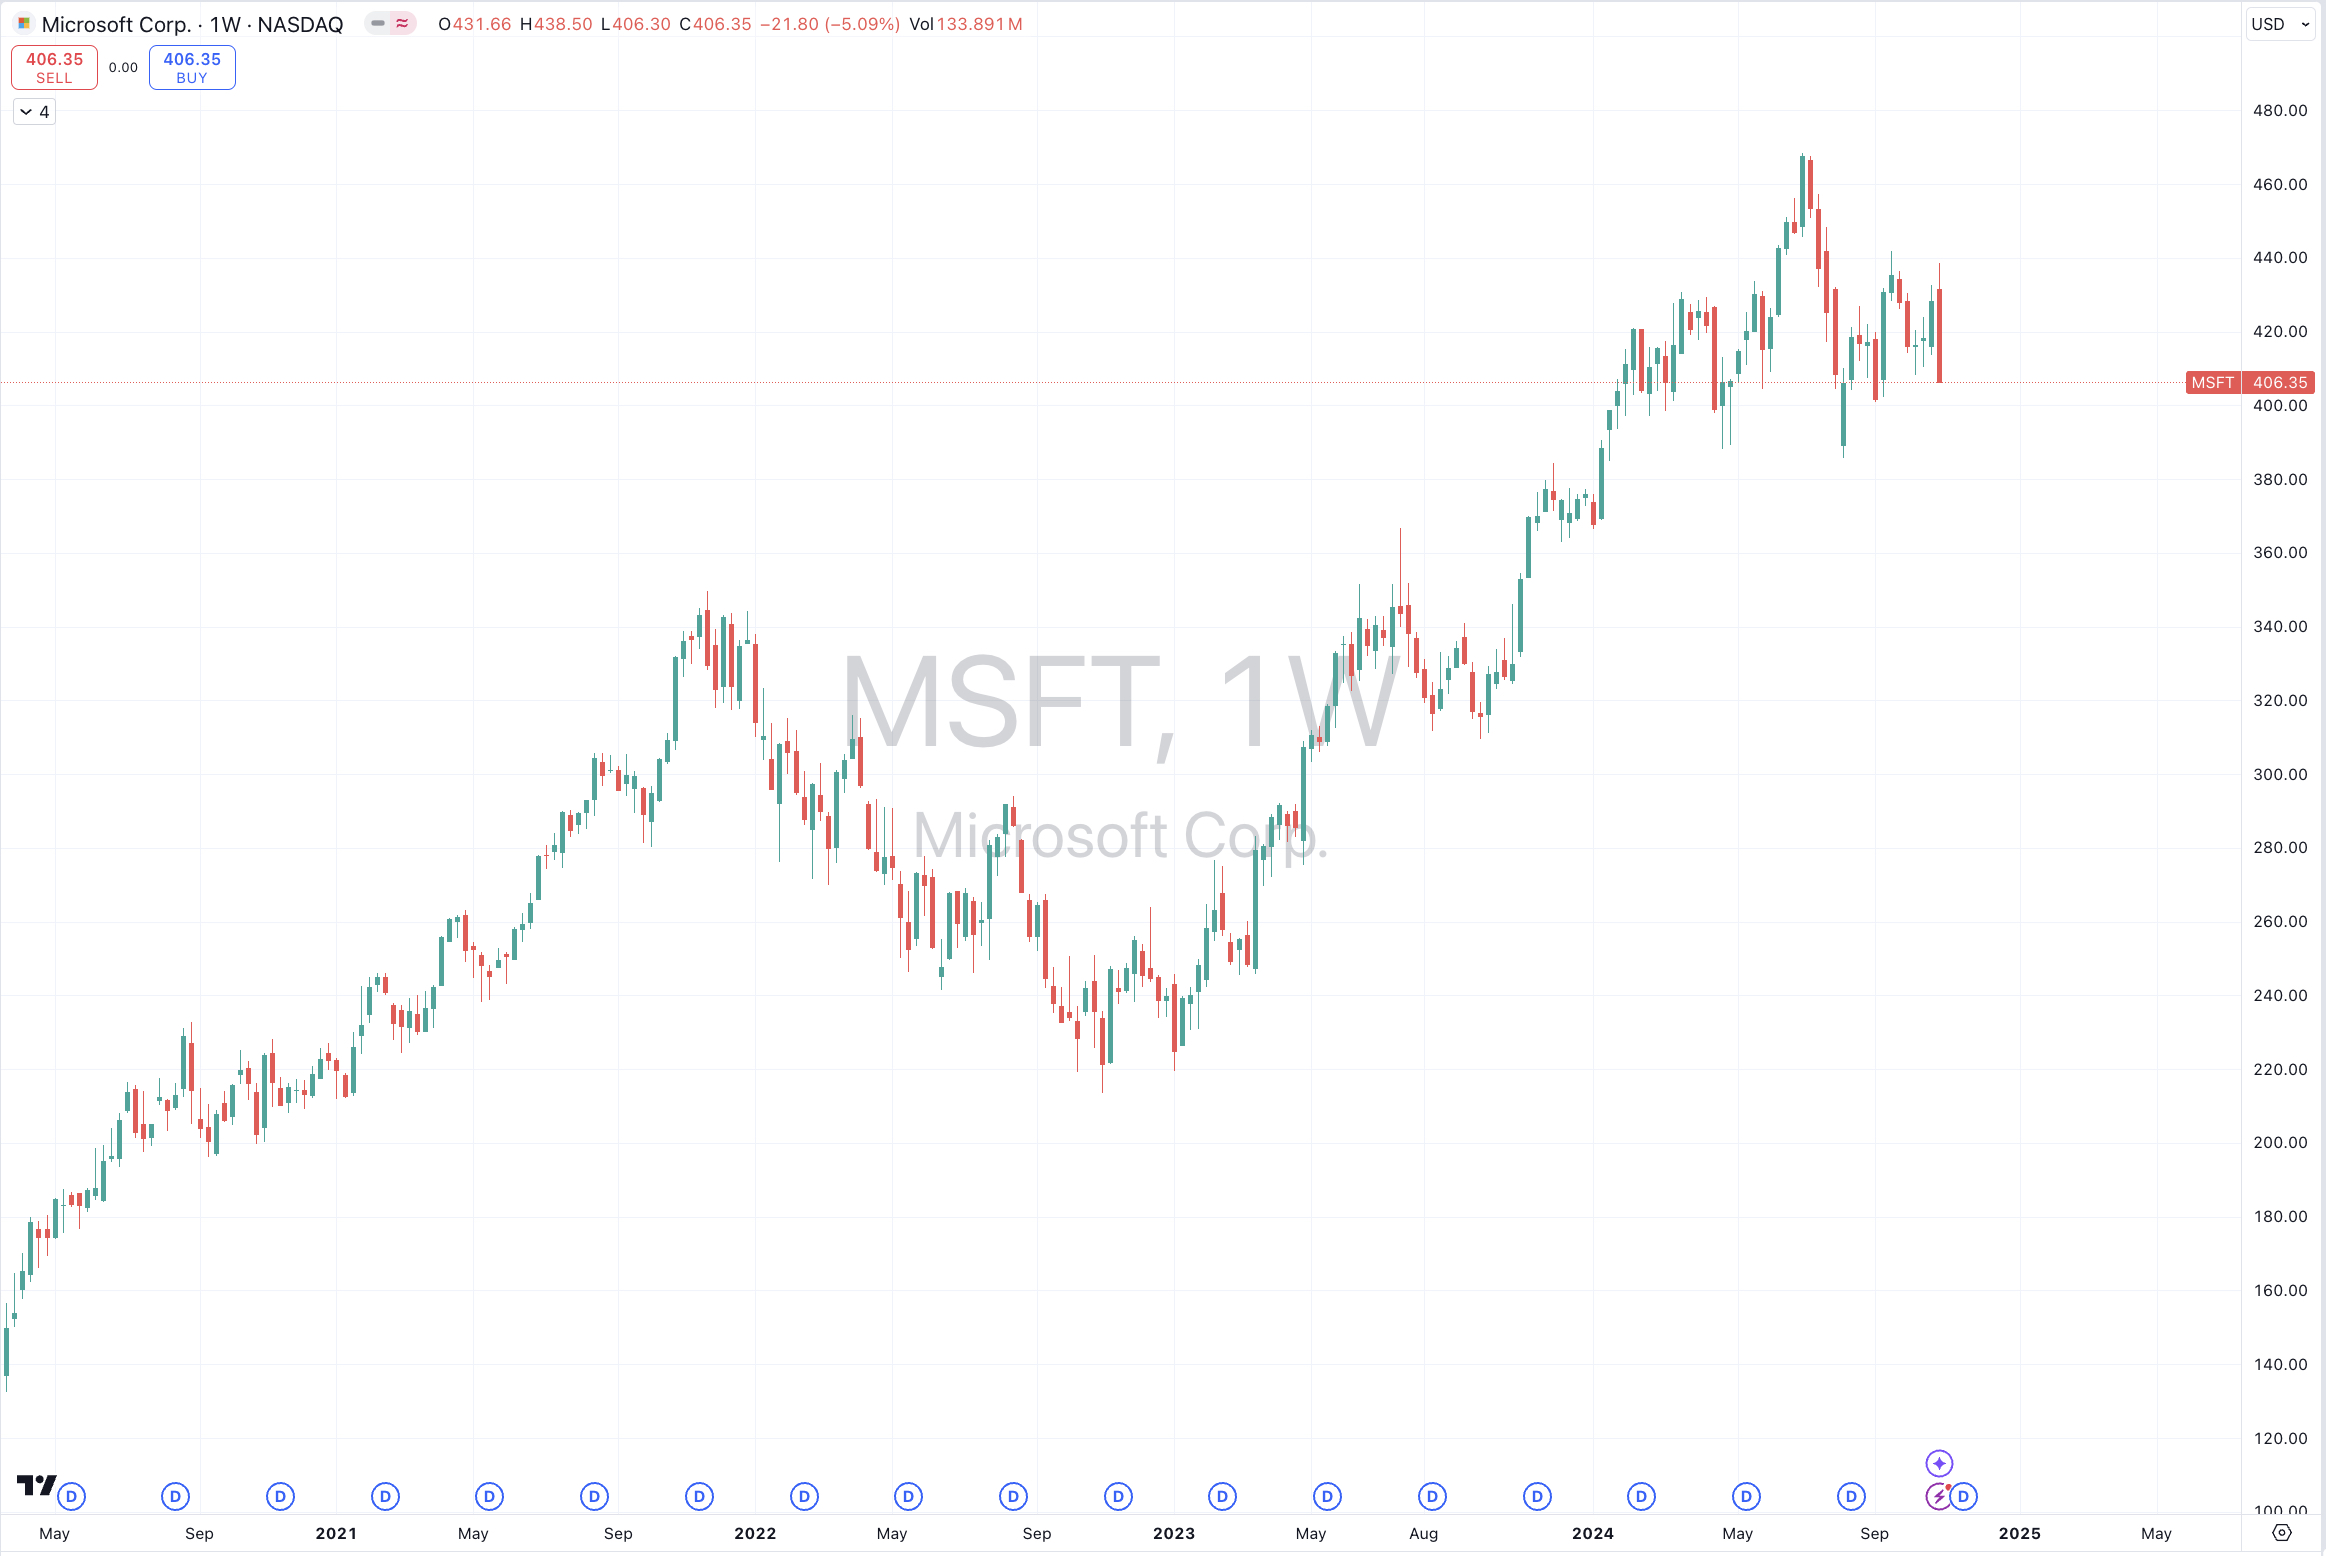
When the price of Microsoft (MSFT:US) shares are trading at a certain percentage above their 200 week moving average, whilst also registering a weekly overbought reading along with being 2.5 standard deviations above its rolling weekly mean.
The big mean reversion back to the 200 week moving average has been underway.
While somewhat ‘smaller’ growth stocks did it much earlier and sharply, I have been highlighting the FAANNGM stocks as the ones to watch due to their hugh weighting and skew in the S&P 500 and Nasdaq indices.
The FAANNGM acronym accounts for the companies Facebook, Amazon, Apple, Netflix, Nvidia, Google and Microsoft.
I also included Tesla in some of my commentary due to its $1.4 trillion market capitalisation also adding to this concentration at the top.
This week, Google (Alphabet) traded back down to its 200 week moving average.
Microsoft is nearly there.
Amazon and Nvidia did it several weeks ago.
Netflix and Facebook (Meta) plunged through that level many months ago.
But Apple and Tesla haven’t done so.
While there isn’t a rule that suggests they need to fall all the way to their mean but the stretched levels which they were trading at told me to either sell or not chase them higher…..because gravity does exist.
Incidentally, the Nasdaq 100, the Philadelphia Semiconductor and S&P 500 indices also reverted back to its 200 week moving average (WMA) over the past month, as have the Small-Cap, Mid-Caps, Banking, Transportation indices.
We have seen all the ‘rubbish’ or over priced and zealous technology stocks tank first, followed by many other sectors including the industrials, then notable indices caught up with the decline and the last to follow are the originally identified culprits, being the FAANNGM stocks.
Pundits are all waiting for some indication of a market capitulation.
Could that occur when Apple and Tesla reach their 200 week moving average?
That may only matter if you are owning or trading Apple or Tesla.
Many indices are at higher prices today than when they touched their 200 WMA back in June or September 2022.
This story had a lead up which I began writing about in 2021.
3 days before the S&P 500 peak, I wrote this note which highlighted the extreme percentages that the indices and in particular the FAANNGM stocks were trading at.
In the next newsletter, I illustrated the damage already being done (at that time) amongst the lesser technology starlets and warned of that spreading to the bigger boys.
This article from January 2022 discussed how recently stratospheric FAANNGM stocks where looking weak and about to break below important support lines.
This article written days later in February 2022, reiterates the story about the 200 week moving average being something to watch in the pending reversion to the mean.
I’m reminding myself to be ready to buy great franchises at valuation multiples that you seldom see.
Microsoft may be one of those.
If the price trades down to the $216 mark, the price action makes me comfortable that the stock has noticeably mean reverted to its 200 week moving average and has traded to 2.5 standard deviations below its weekly mean and registered a weekly oversold reading.
At $216, MSFT would be trading on a forward P/E ratio of 18.
One doesn’t see MSFT trade at 18 times earnings too often.
If Apple’s market cap (currently $2 trillion) doubles from here, it’ll be larger than the German economy. * (and Amazon and Microsoft aren’t too far behind)
Today, Apple’s value is already larger than economies of Italy, Brazil, Canada, Russia, Spain or South Korea.
It’s already nearly double that of Australia’s GDP.
Many speak about “big tech” being overvalued and perhaps so, but a more pertinent reason to consider before buying shares in such behemoths at today’s prices is the LAW OF LARGE NUMBERS.
And a couple years ago, I thought Exxon Mobil was a Goliath at $350 billion market cap…..
Investors may find more interesting investment ideas in the Mid Cap market. FYI, the average market cap of a stock in the S&P 400 Mid Cap Index is about US$4.7 billion.
* Germany’s annual GDP is $3.7 trillion.
p.s. we know that GDP isn’t an equal measure to market capitalisation, but it made me raise an eyebrow.