The circles in the chart below suggest moments when to accumulate shares in Wells Fargo & Co. #WFC.US
These are the moments when the stock price has traded below its 200 week moving average and also 2.5 standard deviations below its rolling weekly mean.
This study is only focused on the buying moment and not the selling moments.
Owning #WellsFargo stock hasn’t been synonymous with a ‘set and forget’ strategy. This is the case with many #banking stocks around the world.
Indeed, there are times when you should ponder selling the stock.
For example, today’s Wells Fargo stock price is still the same price it was 10 years ago.
And it hasn’t been an extraordinary compounder over the last 20 years either with an approx. annual return of 4.6%.
Indeed, there are times when to sell Australian bank shares.
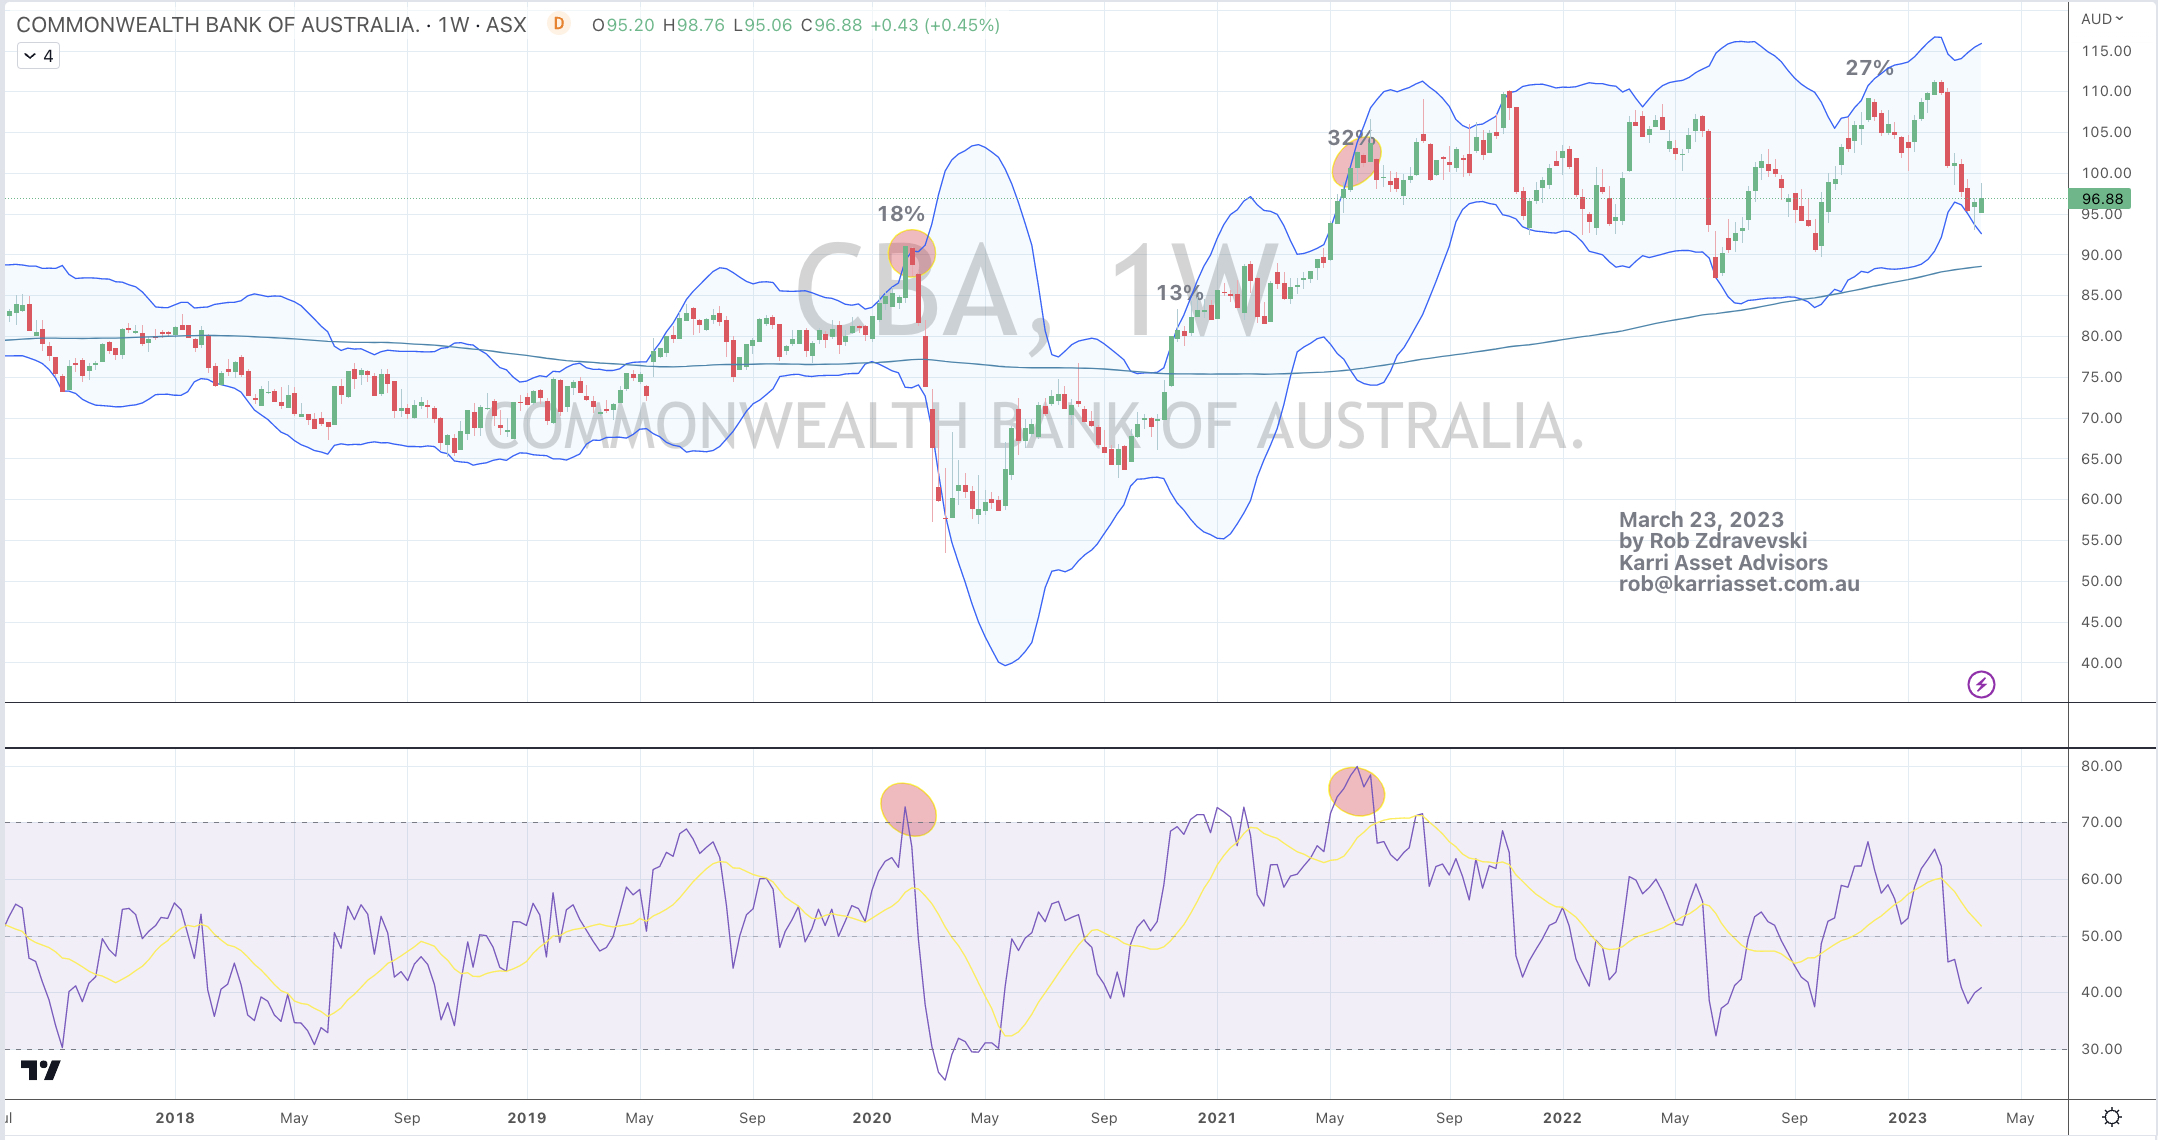
This study below shows moments when the stock price in Commonwealth Bank of Australia (CBA) was stretched.
Ignoring such signals means investors are leaving money ‘at risk’ when probability suggests valuations are full or lower prices beckon.
Irrespective that Australian banks have always traded at a premium to their global peers, resting on the mantra that ‘you can’t go wrong owning the banks’ is false.
And finding solace, that ‘at least I’m receiving my dividends’ is not addressing the risk being taken for such a return.
CBA”s stock price is now trading at the same price as March 2015 (that’s 8 years ago) while Westpac is trading at the same price as 2008, 2010 and 2012.
Another price chart I am watching is that of Westpac Bank (WBC.AX).
I often post technical charting comments on Linkedin but my equity investing work always starts with identifying themes or trends and then moves onto fundamental mathematical analysis (balance sheets, income statements etc)…….
I use technical analysis to help with my price entry and exit as numbers and price charts make wonderful patterns which also assists with probability.
I am fundamentally bullish on banking stocks, however I have lightened some bank holdings as they recently reached historically overbought prices and fully valued valuations.
In Westpac’s case, it was a prudent thing to do. After all, the stock rose 57% from $16.50 (my buy price) to $26 within 10 months.
The high was $27.12.
It’s currently $25.60.
The share price capitalised what I thought was more than 2 years worth of earnings. So at that price (in June 2021) I asked myself do I want to pay this price (buy the stock) which is already factoring in 2024’s earnings?
From here, I think Westpac’s price trades below $24.50 (breaking that lower trend line) and makes a visit to $22.30.
Buying it 13% cheaper would be nice.
p.s. that line floating through chart is the 100 week moving average.
I’ll review this picture in late July/early August.
After 5 years, I have now become bullish on Australian banks.
For example, Westpac Bank’s 2021 forecasts have it trading below 1x book value, on a P/E of 11 and the dividend yield should be 5%, not including the franking credits.
Furthermore, I think its net interest margins will increase (as longer dates interest rates rise) and all of their bad news and fines are no longer “new news”, Westpac’s stock price also has traded at monumentally oversold readings…….not on a daily nor weekly basis, but on a Monthly reading.
See the chart below and you’ll see it’s only happened twice in 27 years.