Sandfire’s stock price has risen 38% from its mid July 2022 low.
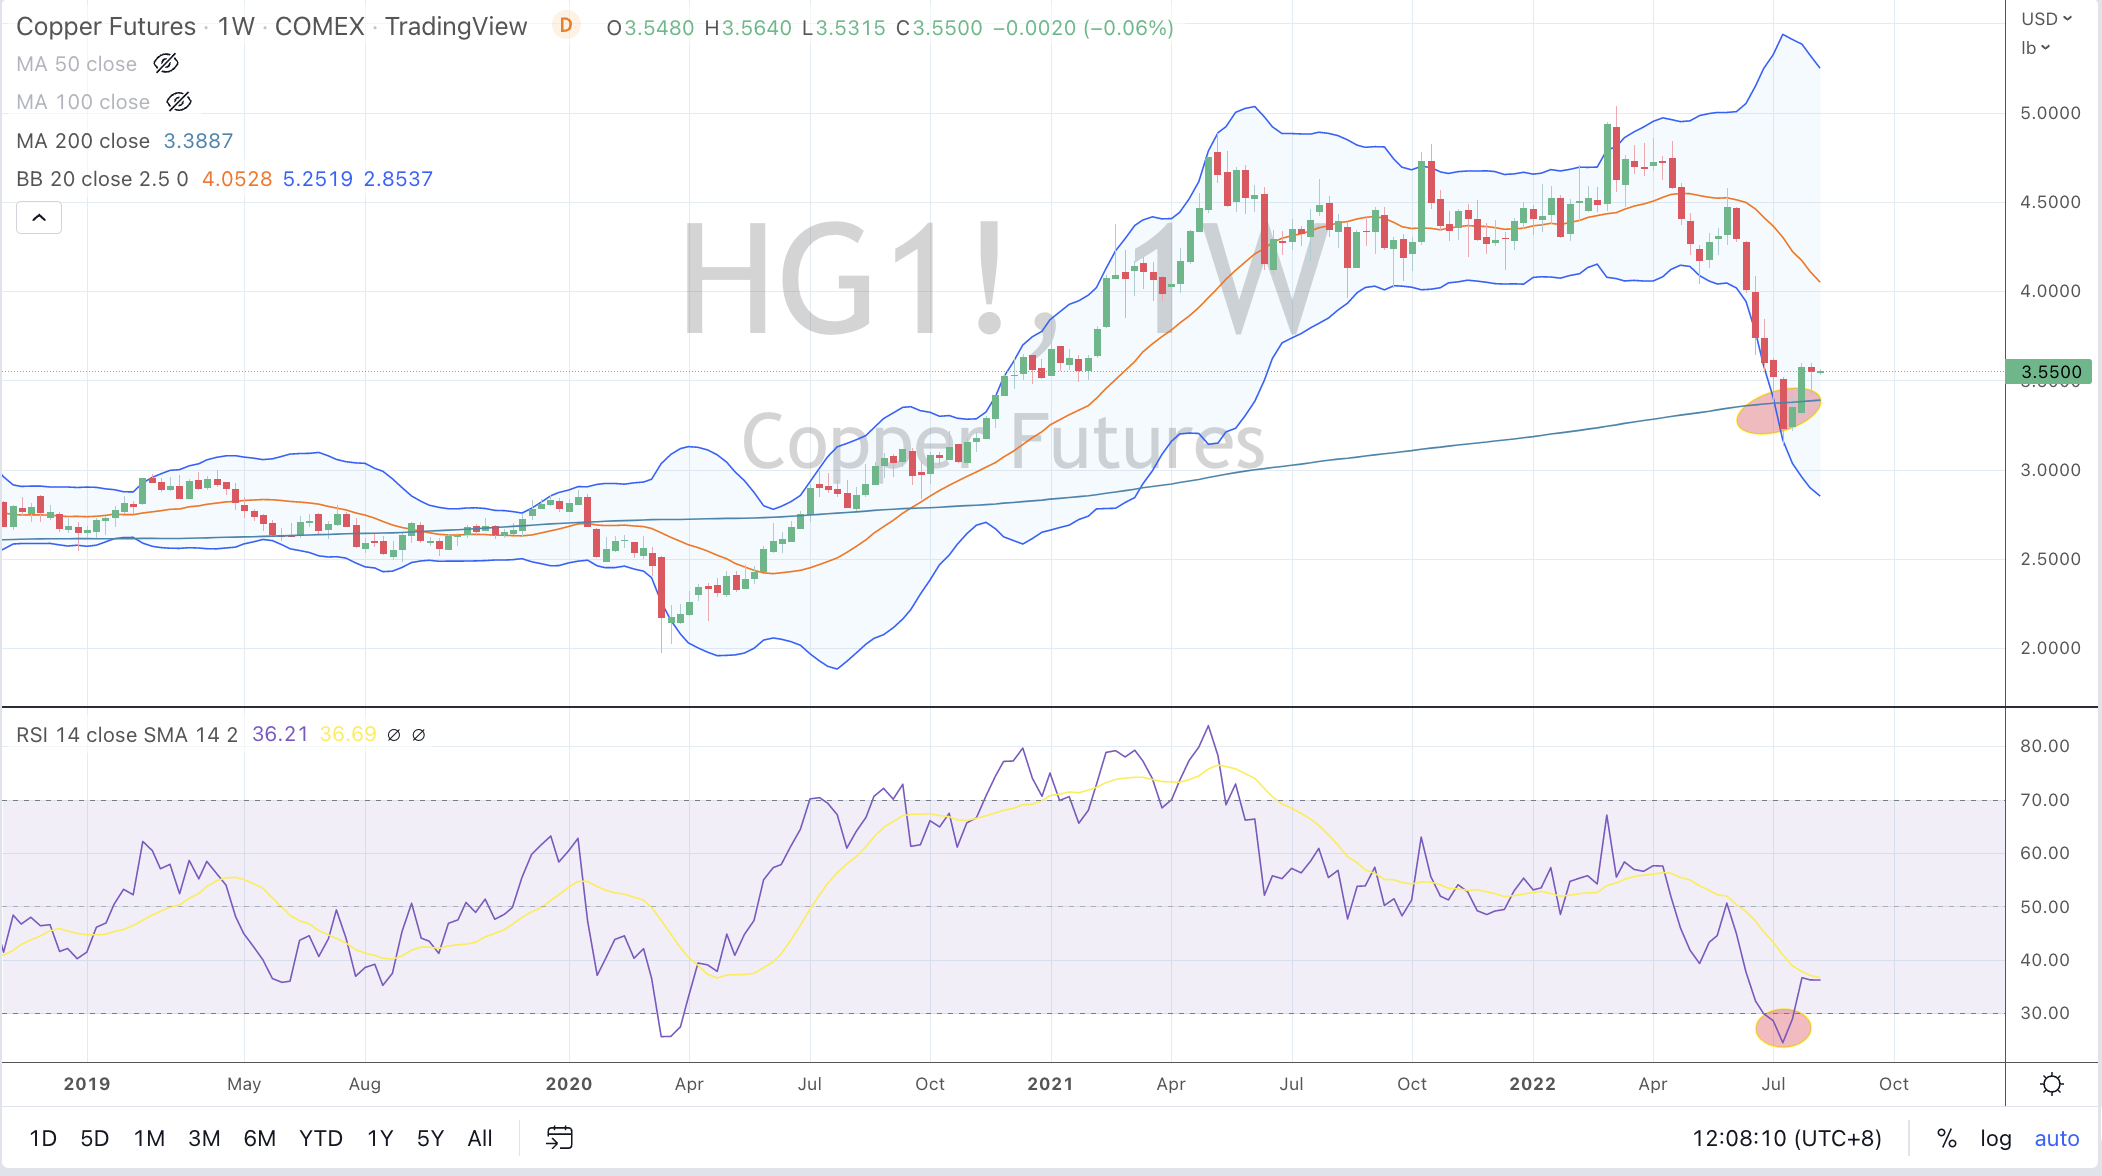
The price of Copper has climbed 40% since then.
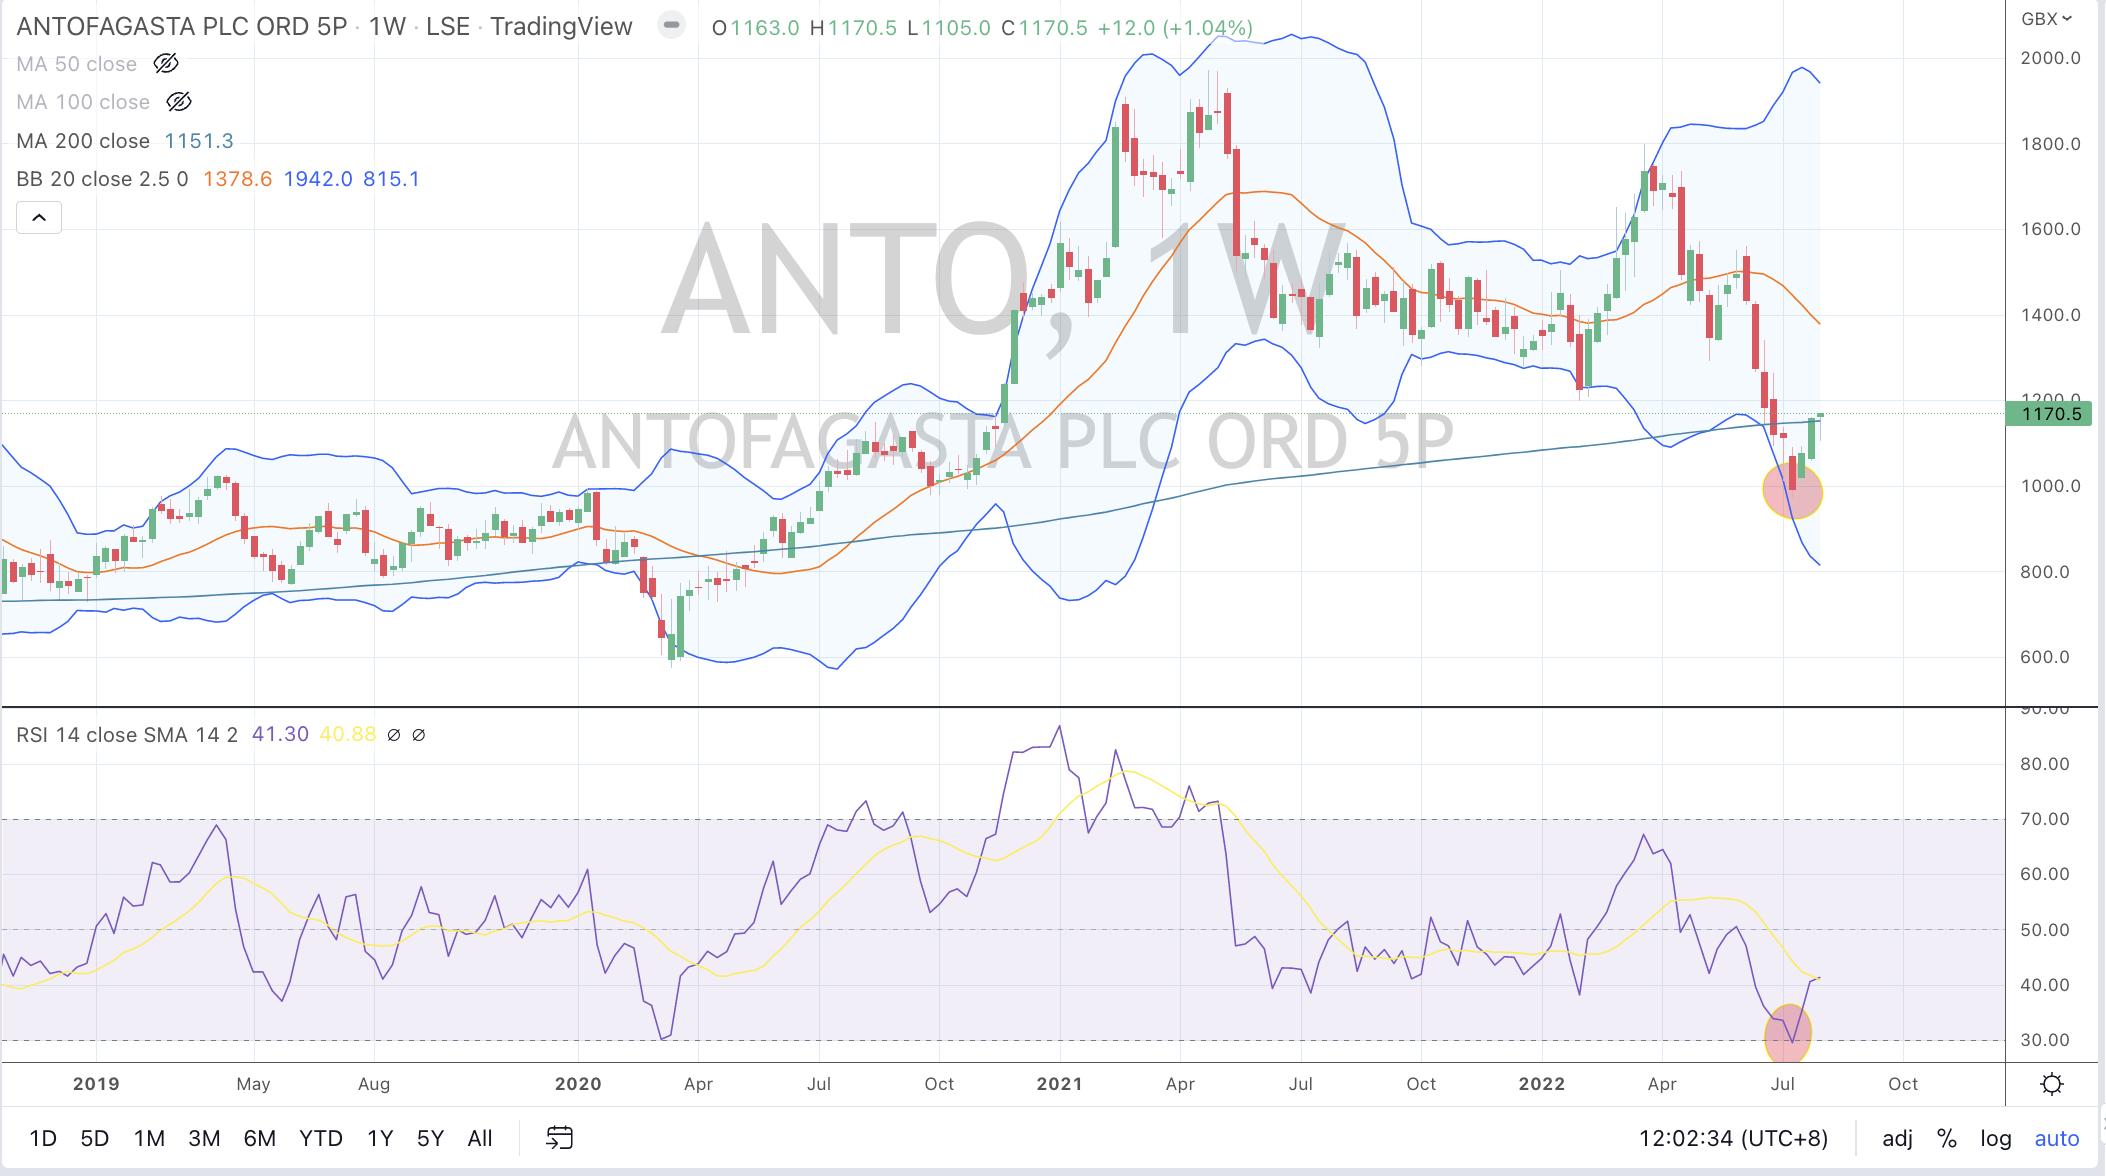
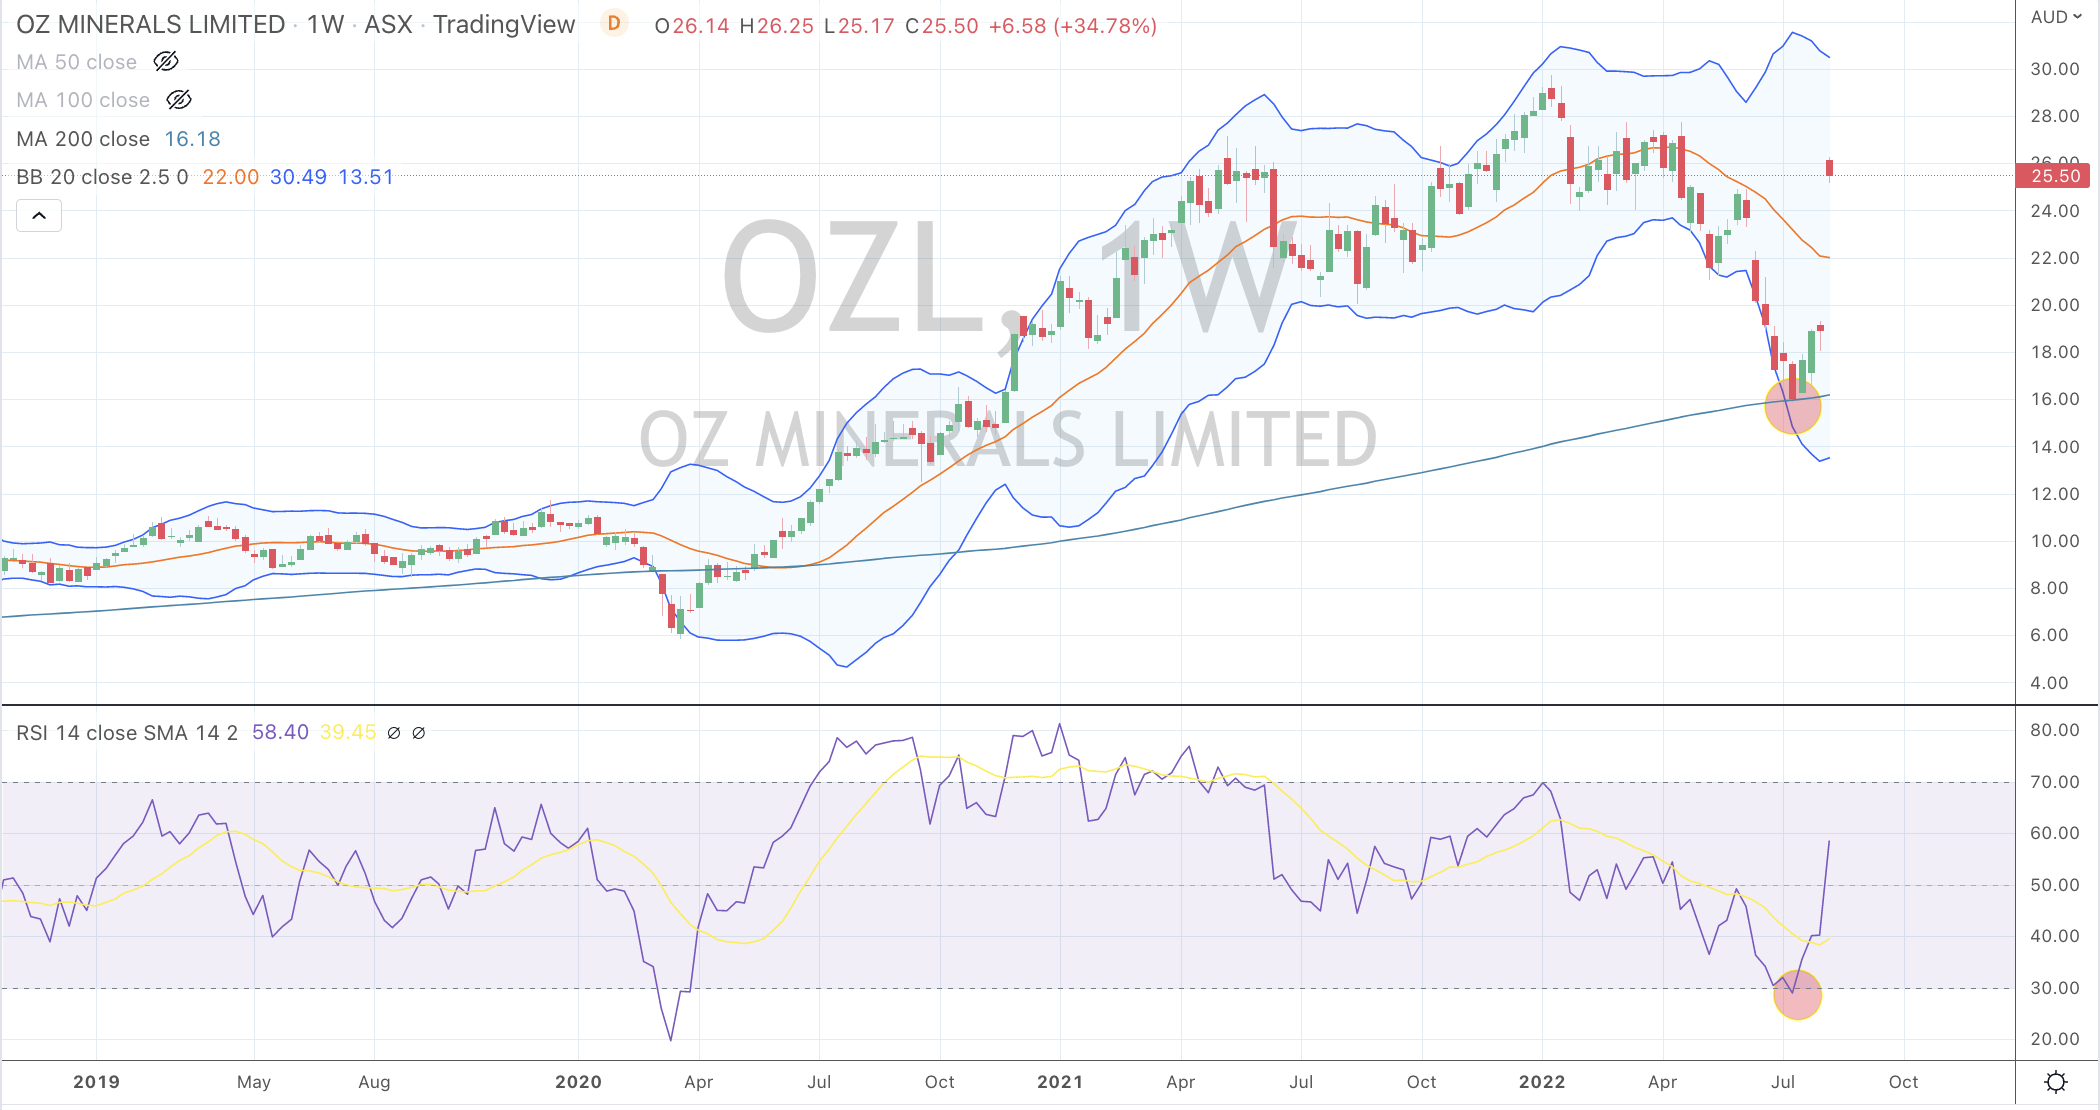
In fact, the price of Chilean copper miner, Antofagasta (listed in London), Sandfire Resources, OZ Minerals and the price of Copper all exhibited my trifecta of a mean reversion to its 200 week moving average, trading to 2.5 standard deviations and registering a weekly Oversold RSI reading.
The following assets (on a weekly timeframe) registered an Overbought or Oversold reading and/or have traded more than 2.5 standard deviations above or below its rolling mean.
Extremes “above” the Mean (at least 2.5 standard deviations)
None
Overbought (RSI > 70)
Dutch TTF Gas
The Overbought Quinella – Both Overbought and Traded at > 2.5 standard deviations above the weekly mean)
None
Extremes “below” the Mean (at least 2.5 standard deviations)
Japanese 10 year government bond yields
Oversold (RSI < 30)
U.S. 10 year minus U.S. 5 year government bond yield
Hot Rolled Coiled Steel
Tin
Oats
The Oversold Quinella – Both Overbought and Traded at > 2.5 standard deviations above the weekly mean)
The U.S. 10 year minus 2 year government bond yield spread.
Notes & Ideas:
This big news over the past week was continued weakness in energy prices and shipping rates. We also experienced the mildest and quietest week in global equities for more than 2 months. It certainly felt that way too.
It was a week to not chase the momentum higher, not initiate any meaningful positions and to trim and sell those assets that have given you a fortuitous return or allowed you to a second chance to recoup some capital.
There was plenty of warning about the pending decline in energy prices.
I was cognisant of Oil’s ‘high’ price as expressed in these posts.
Now that Gasoil and Crude prices have fallen 30% from their recent highs, Crude Oil specifically near an interim low and due for a ‘bounce’.
I’ll look for WTI Crude and Brent to trade down to $85.50 and $92.00 respectively.
Incidentally, Gasoil (diesel) has fallen from $1400 to $990 (a metric ton) over the past 7 weeks. Over the same time WTI Crude has declined from $123 to $89. It’s interest to ‘hear’ the silence in the financial media, as opposed to the noise heard when prices were barreling skywards only a few months earlier.
There is merit to identifying the ‘mean’ are and cancelling out the noise.
The U.S. yield curve remains inverted for the 5th week in a row and Oversold for 3 consecutive weeks.
Keep in mind that when the yield inverted 6 weeks ago, I had earlier written a note citing that such an occurrence is beneficial for the longer term accumulation of the S&P 500.
Over a similar timeframe, the KOSPI and ASX200 have risen 9.4%, the Russell 2000 has advanced 17% while the Nasdaq Biotechnology Index has soared 25.4%.
Today, I think the S&P 500 is closer to a ‘trading sell’ and while the longer term accumulation position remains my stance, tactically I think we’ll see lower prices again, a double dip testing recent lows and a safer opportunity to buy or add to positions.
The next 12 months should prove a notable moment to build an equities portfolio of world class businesses at much more reasonable and palatable valuations.
The larger advancers over the past week comprised of;
Australian Coking Coal 8.1%, Iron Ore 2.4%, JKM LNG 5.8%, Orange Juice 6.3%, Platinum 3.9%, Sugar 2.3%, Dutch TTF Gas 2.8%, Uranium 1.9%, Rice 2.7%, BOVESPA 3.2%, KOSPI 1.6%, Nasdaq 100 2%, Russell 2000 1.9%, SOX 2.9%, STI 2.2%, Istanbul 6.3%, Nasdaq Composite 3.3% and the Nasdaq Biotechnology Index soared 6.8%.
The group of decliners included;
Aluminium (2.7%), Rotterdam Coal (2.3%), Bloomberg Commodity Index (3.3%), Baltic Dry Index (17.7%), China Coal (5.7%), WTI Crude Oil (9.7%), Gasoil (10.5%), Heating Oil (11.3%), Hot Rolled Coil Steel (4.3%), Coffee (3.6%), Lumber (9.1%), LNG (6.6%), Natural Gas (2%), Gasoline (8.3%), Silver USD (2.2%), CRB Index (3.8%), Brent Crude (9%), Urea M/E (3.7%), Oats (8.4%), Soybeans (4.1%), Wheat (4%), MOEX (7.2%) and Copenhagen’s OMX 25 Index fell 2.2%.
If you are in the business of accumulating equities over a longer period of time, for the longer term…….
then the vertical lines show the significance when the Japanese 10 year government bond yield (JGB) is (on a weekly chart) simultaneously OVERSOLD and trading 2.5 standard deviations BELOW its rolling weekly mean……
because the S&P 500 also then registers a notable LOW.
There have been 9 such moments over the past 15 years when probability was on your side to initiate, nibble or add to your holdings.
This is the antithesis note to the immediate previous post.
In the chart below, the vertical lines show the significance when the Japanese 10 year bond yield is (on a weekly chart) simultaneously Overbought and trading 2.5 standard deviations above its rolling weekly mean.
The S&P 500 then reaches a meaningful, long term peak.
There have been 5 notable moments over the past 15 years.
The most recent peak coincided with my December 28, 2021 newsletter citing the same point.
I have been asking myself if the stocks in portfolios are ones that I’m ‘dating’ or ‘marrying’…..
and I remind myself to not confuse fortuitousness with any type of genius.
A 15%-20% return within 4-6 weeks is more than adequate.
Heck, it’s 2 years worth of return when comparing to a normalised, long term average and we are facing lower growth in the economy.
Over the past few days, I’ve been divesting selected positions which are exhibiting ’selling tendencies’.
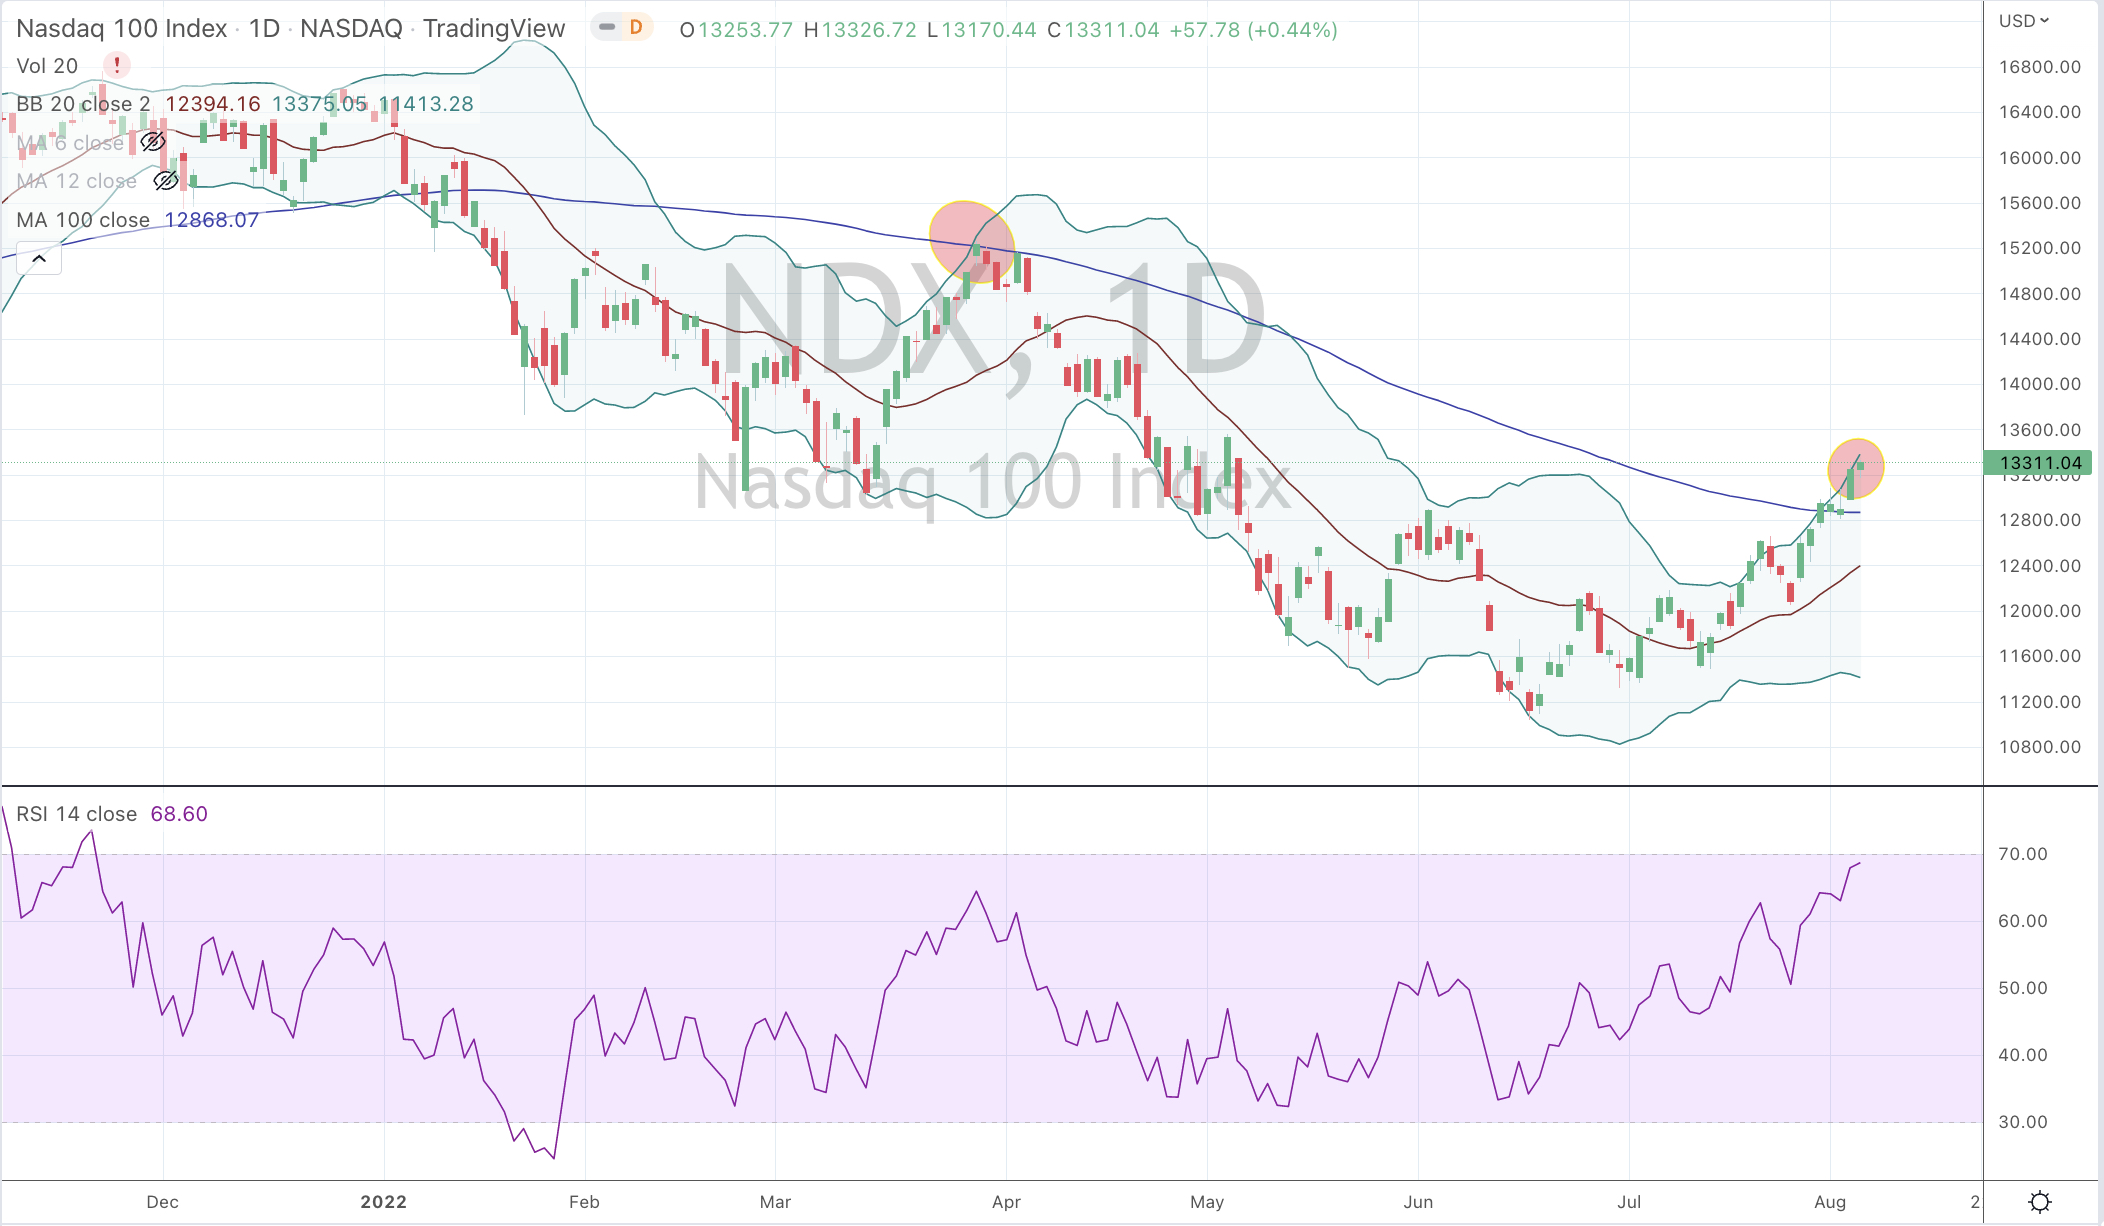
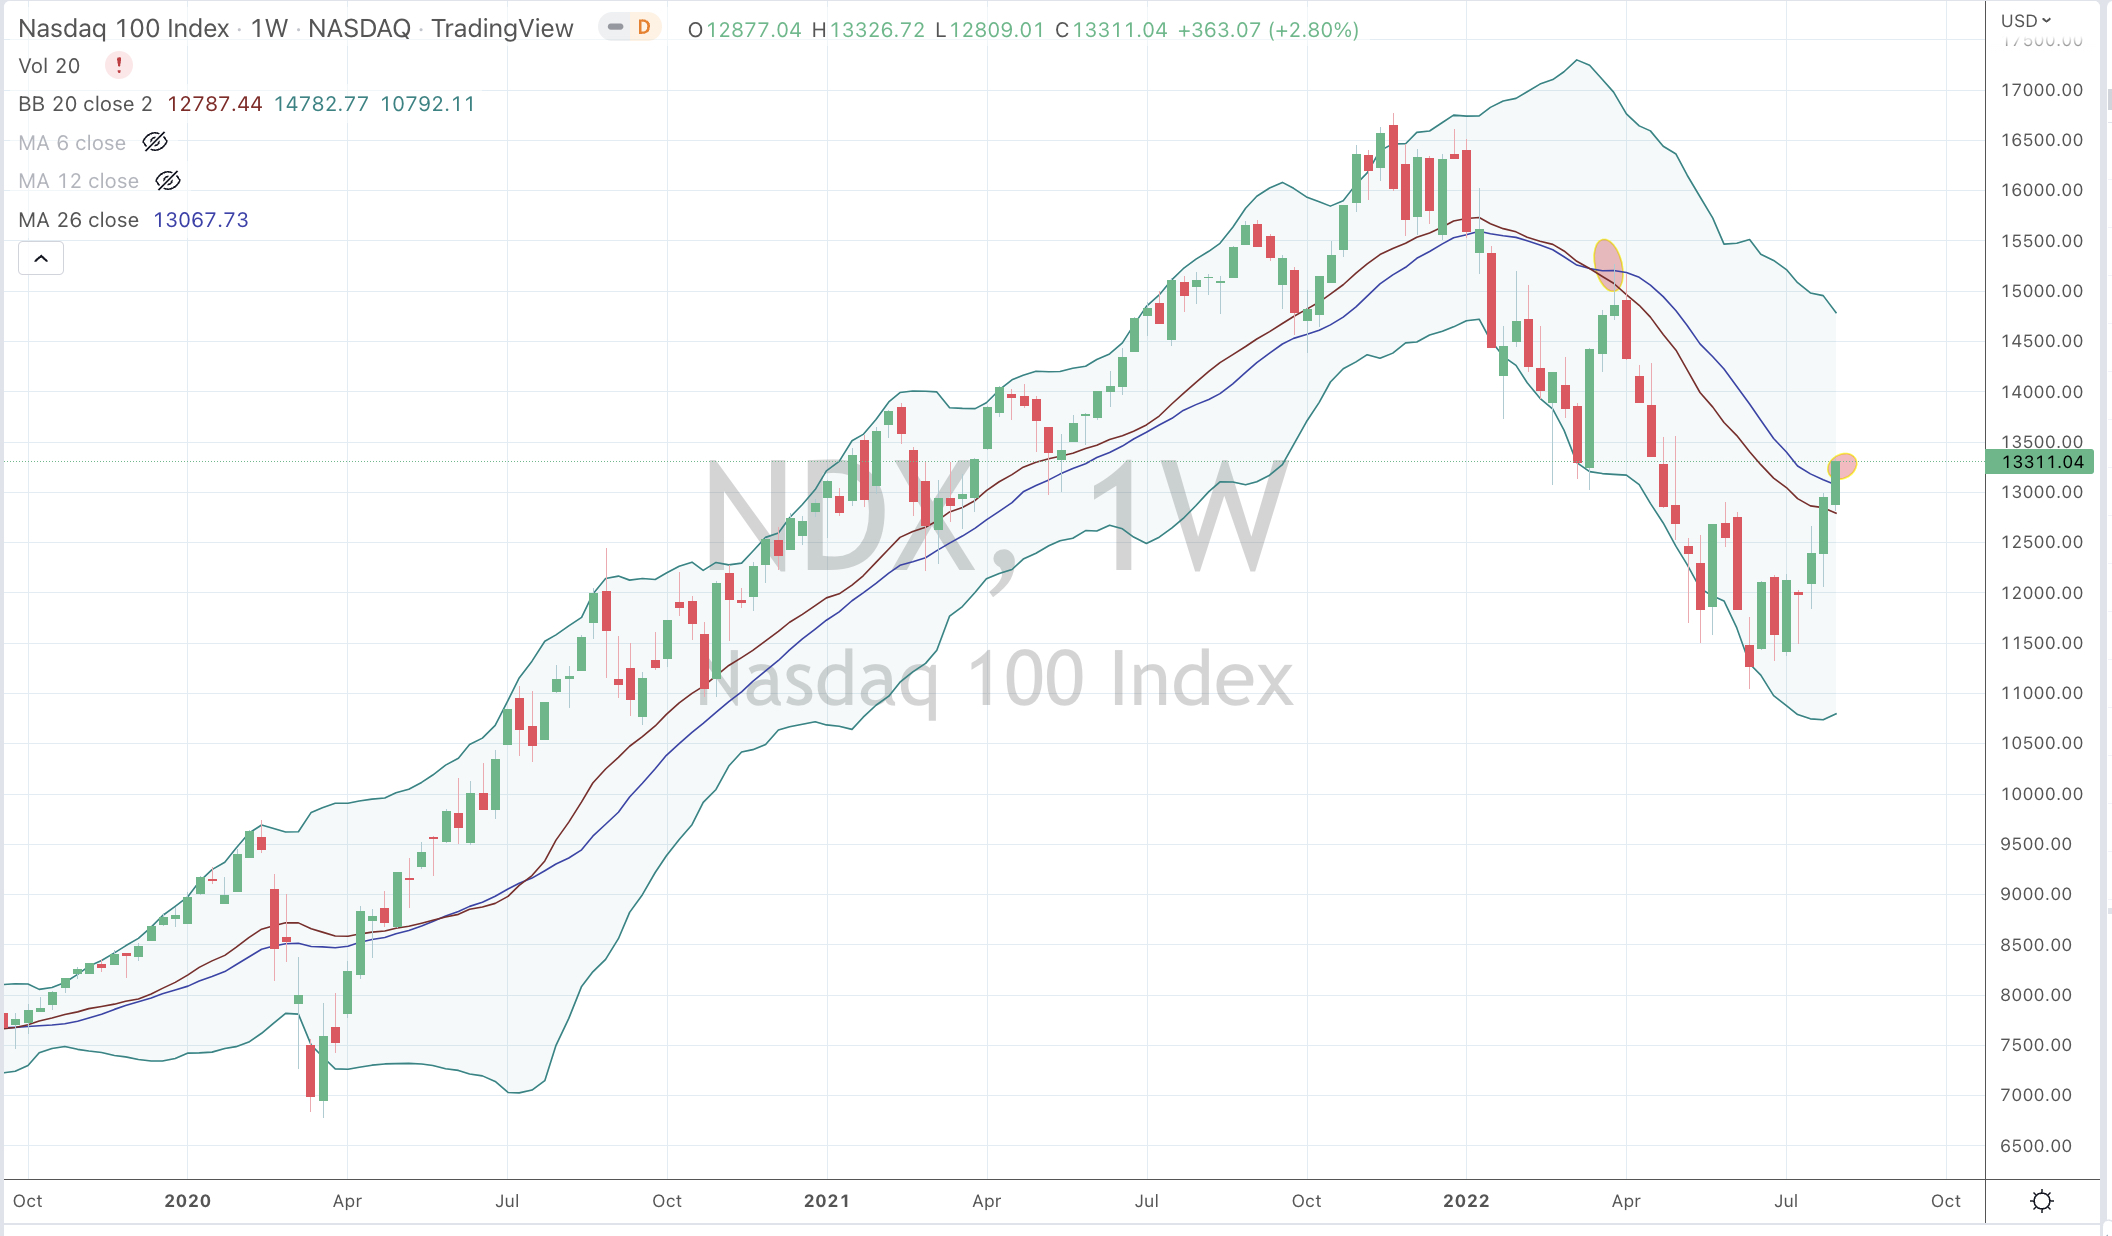
Such ’tendencies’ and a rising probability of a ’trading peak’ is shown in the Nasdaq 100 Index as seen in the 2 charts below.
The Daily chart shows the Nasdaq 100 trading up to 2.5 standard deviations above its daily mean and back to (above) its 100 day moving average. To compliment the case, it is within a whisker of being overbought on its daily RSI indicator.
The weekly chart shows the NDX rallying to its rolling weekly mean and coincidentally touching its 26 week moving average.
Beyond this, the ’set-up’ in my other indicators just don’t marry up to suggest an extension of the recent rally in certain securities or indices,
August 4, 2022 – Perth’s office vacancy rate has grown to 15.8 per cent in the past six months, up 0.8 per cent since January…6 months earlier, the news was that vacancy rates had fallen.
3 Feb 2022 — Perth’s CBD office vacancy rate has fallen to 15 per cent. Perth’s CBD office vacancy has fallen in the past six months but is the second …and previously we read;
5 Aug 2021 — Vacancy rates also improved across Perth office markets…
1 June 2021 — The real Perth CBD office vacancy rate is closer to 15% when the level of static vacancy and buildings which are about to be withdrawn from .. Does 15% or 15.8% really matter.
It’s a real shame that news stories don’t continue to elaborate that Perth has the nations highest proportion of C & D grade buildings which doesn’t help the numbers when reporting on “prime CBD properties”.
I’d like to see what the vacancy rates are for Class A & B buildings.
In July 2021, I wrote this note as Calgary saw office vacancy rates hit 24%.
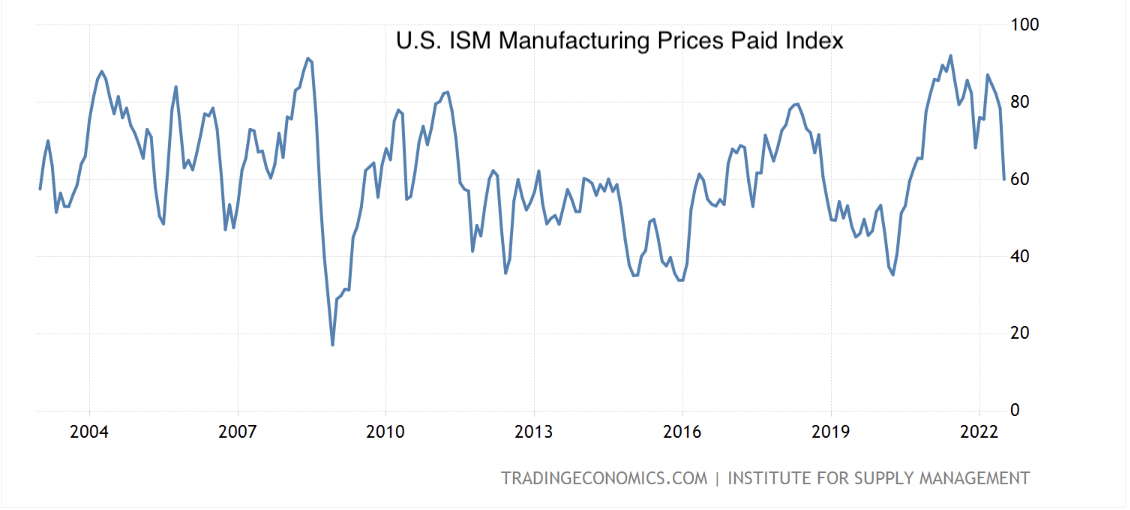
The ISM Manufacturing Price Paid Index is a leading indicator.
The overnight release of the July 2022 data shows the index falling 24% from the previous month.
It reflects a change in prices paid by industry representatives for the products or services they receive.
It’s a monthly survey of supply managers from 18 U.S. industries where respondents estimate prices paid in the production process: whether they have grown, fallen or have not changed.
In my recent posts, I’ve been highlighting the decline in commodity prices is/will lead to lower input prices,
“It’s also the start of an odd period where higher prices of finished goods (due to the higher price paid by buyers of raw/base/industrial commodities) may be left on the shelf.
Rising prices have been evident but we can’t assume that higher prices are automatically paid for.”
So there is your picture.
Prices rose to a point where buyers walk away and when they saw producers scrambling to secure materials, one can predict that inventories will rise.
Now that material prices have fallen by 30% or more, buyers can source product from those who have acquired (and worked) their materials at the current lower prices.
Additionally, those higher priced inventories will eventually need to be discounted in order to generate cashflow and reduce their stock which is tying up working capital.
And thus survey respondents are either buying product at cheaper prices than earlier in the year or can expect lower prices in the near future.