Commodity bullishness – illustrated
July 29, 2023 Leave a comment
Strategically, I am becoming bullish on commodities.
Tactically, it’ll be down to timing and selecting the specific investments to express this view.
Trying to hear what's not being said
July 29, 2023 Leave a comment
Strategically, I am becoming bullish on commodities.
Tactically, it’ll be down to timing and selecting the specific investments to express this view.
July 26, 2023 Leave a comment
Talk in financial media says Germany has a stubbornly sticky inflation problem.
I see it has already ticked lower, as represented by the blue line in the chart below.
Currently, its 6.38% and I think it can converge lower towards its 200 week moving average to somewhere around the 4.60% mark (+/- 30 basis points)
Commensurately, German 2 year bond yields (orange line) should fall to the 1.60% (+/- 20 basis points) area.
July 26, 2023
by Rob Zdravevski
rob@karriasset.com.au

July 26, 2023 Leave a comment
When the CHF/AUD is overbought (telling us that the Swissie is quite strong against the Aussie) then I prepare to add a little more exposure to the ASX 200.
Although, acknowledging that it’s an extension of a rally rather than a notable low.
July 26, 2023
by Rob Zdravevski
rob@karriasset.com.au

July 24, 2023 Leave a comment
The owners of the Washington Commanders NFL team achieved a 10% p.a. compounded return on their purchase price of $800 million in 1999. They are being sold for $6.05 billion.
A fancy house in Toorak, Melbourne was sold for $43 million. It was bought for $108,000 in 1968.
That is also a 10% p.a. compounded return.
Both marquee assets and let’s say scarce and tightly held.
Valuations aside, large numbers can create awe when reported in the media.
#compounding
July 24, 2023 Leave a comment
When the RSI on the VIX Index trades at a reading of 38 or below (note it has never registered a weekly oversold reading of below 30), the S&P 500 embarks on a rally against an economic backdrop of trying and testing conditions or headwinds.
This climb up a ‘wall of worry’ tends to exhaust itself when the RSI registers a
reading of 64 while the upward equity trend can last between 6 and 24 months.
An RSI above 64 and ultimately a reading above 70, is then when we see ‘absolute’ worry.
For now, I’ll be wary of my equity allocation and exposure as any further index advance isn’t evolving from a base of bargain hunting.
July 24, 2023
by Rob Zdravevski
rob@karriasset.com.au

July 23, 2023 Leave a comment
A weekly Macro, Cross Asset review of prices trading at extremes which may generate future investment ideas and opportunities.
The following assets (on a weekly timeframe) either registered an Overbought or Oversold reading and/or have traded more than 2.5 standard deviations above or below its rolling mean.
Extremes “above” the Mean (at least 2.5 standard deviations)
U.S. 10 year breakeven inflation rate
EUR/USD
DKK/USD
KRW/USD
Oats
Lumber
Dow Jones Transports
Nasdaq Transports
S&P MidCap 400
S&P SmallCap 600
Russell 2000
Nasdaq SmallCap 700
Overbought (RSI > 70)
Russian 10 year government bond yields
U.S. 3 month bill yields
EUR/JPY
GBP/JPY
COP/USD
Cocoa
Cattle
Nasdaq 100
Nasdaq Composite Index
India’s Nifty 50 and Sensex
And Russia’s MOEX equity index
The Overbought Quinella – Both Overbought and Traded at > 2.5 standard deviations above the weekly mean)
Turkiye’s BIST 100
Chile’s IPSA and IGPA equity indices
Extremes “below” the Mean (at least 2.5 standard deviations)
U.S. Dollar Index
Oversold (RSI < 30)
Brazilian and Chinese 10 year government and yield
Newcastle Coal
JPY/GBP
JPY/EUR
The Oversold Quinella – Both Oversold and Traded at < 2.5 standard deviations below the weekly mean)
None
Notes & Ideas:
Equities were mostly higher for the week, while a little more subdued across the baord. For instance, the amount of those posting an advance of 2% or greater was among the smallest in some weeks.
This shouldn’t be a shock, for 2% weekly variances is the exception rather than the norm.
This week saw the smaller U.S. indices creep into overbought territory, such as the small caps and the Russell 2000 which now join the Nasdaq 100 which has completed its 9th consecutive overbought week.
The S&P 500 is closing in to that area after rising 0.7% for the week.
Chinese and Hong Kong indices were the notable losers for the week, giving up half of last week’s gain.
The biggest winner was the U.S. Regional Bank Index, again, having now posted a 16% gain over the past 4 consecutive rising weeks.
Speaking of streaks, the KBW Bank index, the Nifty 50, Sensex and Chile’s IPSA have risen for their 4th straight week and Istanbul’s BIST 100 has notched up a 5 week winning streak.
Bond yields mostly fell.
Many yields have eased from their recent upper extremes to simply return to within their 2 standard deviation ranges.
While Australian bond yields aren’t overbought anymore, they still rose for the week, as did the yields in Kiwi and American debt.
Brazilian yields aren’t oversold anymore and the yields for U.K. Gilts have retreated from overbought territory.
And the Japanese 10’s performed the largest percentage decline, with JGB yields closing at 0.42% from last week’s close of 0.48%.
Commodities were generally higher with energy and agricultural leading the charge.
The Japan/Korean LNG Marker was a stand out, recovering nearly twice of last week’s 11% decline.
Coffee and Natural Gas had a bullish outside week.
Lumber had a bearish outside week.
Sugar has seen 3 consecutive rising weeks (rising 9% over that time) whist Crude Oil and Gold priced in Canadian Dollars extend their weekly winning streak to 4.
Amongst currencies, the USD firmed.
Bucking the trend, the DKK and KRW have touched overbought levels against the USD, making the cheapest Danish holiday for an American since February 2022.
The AUD and GBP were generally weaker against their various pairs.
Japanese Yen continues to exhibit weakness as it sees its 6th consecutive week in Oversold territory versus the GBP.
The Mexican Peso (MXN) isn’t overbought against the USD anymore.
The ZAR/USD has its highest close since April 3, 2023
Commensurately, the AUD warned against the ZAR.
And the NZD/AUD had an outside bearish week.
The larger advancers over the past week comprised of;
Rotterdam Coal 6.1%, Cocoa 1.9%, WTI Crude 2.1%, Gasoil 5.2%, Heating Oil 5.2%, JKM LNG 20.2%, Natural Gas 6.9%, Orange Juice 10.1%, Gasoline 5.8%, Sugar 2.6%, S&P GSCI 2.2%, CRB Index 2.1%, Dutch TTF 8.5%, Gold in AUD 1.9%, Corn 4%, Rice 2.6%, Soybeans 2.1%, Wheat 5.5%, KBW Bank Index 6.6%, DJ Industrials 2%, DJ Transports 2.6%, BOVESPA 2.1%, Oslo 2.5%, Copenhagen 1.7%, Nasdaq Transports 2%, FTSE 100 3.1%, Istanbul 3.9%, KRE Banks 7.5%, Chile 2.8% and S&P SmallCap 600 rose 1.6%.
The group of decliners included;
Aluminium (5.6%), Baltic Dry Index (10.3%), Copper (2.7%), Hot Rolled Coil Steel (4%), Lumber (5.9%), Tin (2.1%), Newcastle Coal (6.4%), Silver (1.5%), Shanghai (2.2%), CSI 300 (2%), HSCEI (2.2%), Hang Seng (1.7%) and Philadelphia Semiconductor fell 1.4%.
July 23, 2023
by Rob Zdravevski
rob@karriasset.com.au
July 22, 2023 Leave a comment
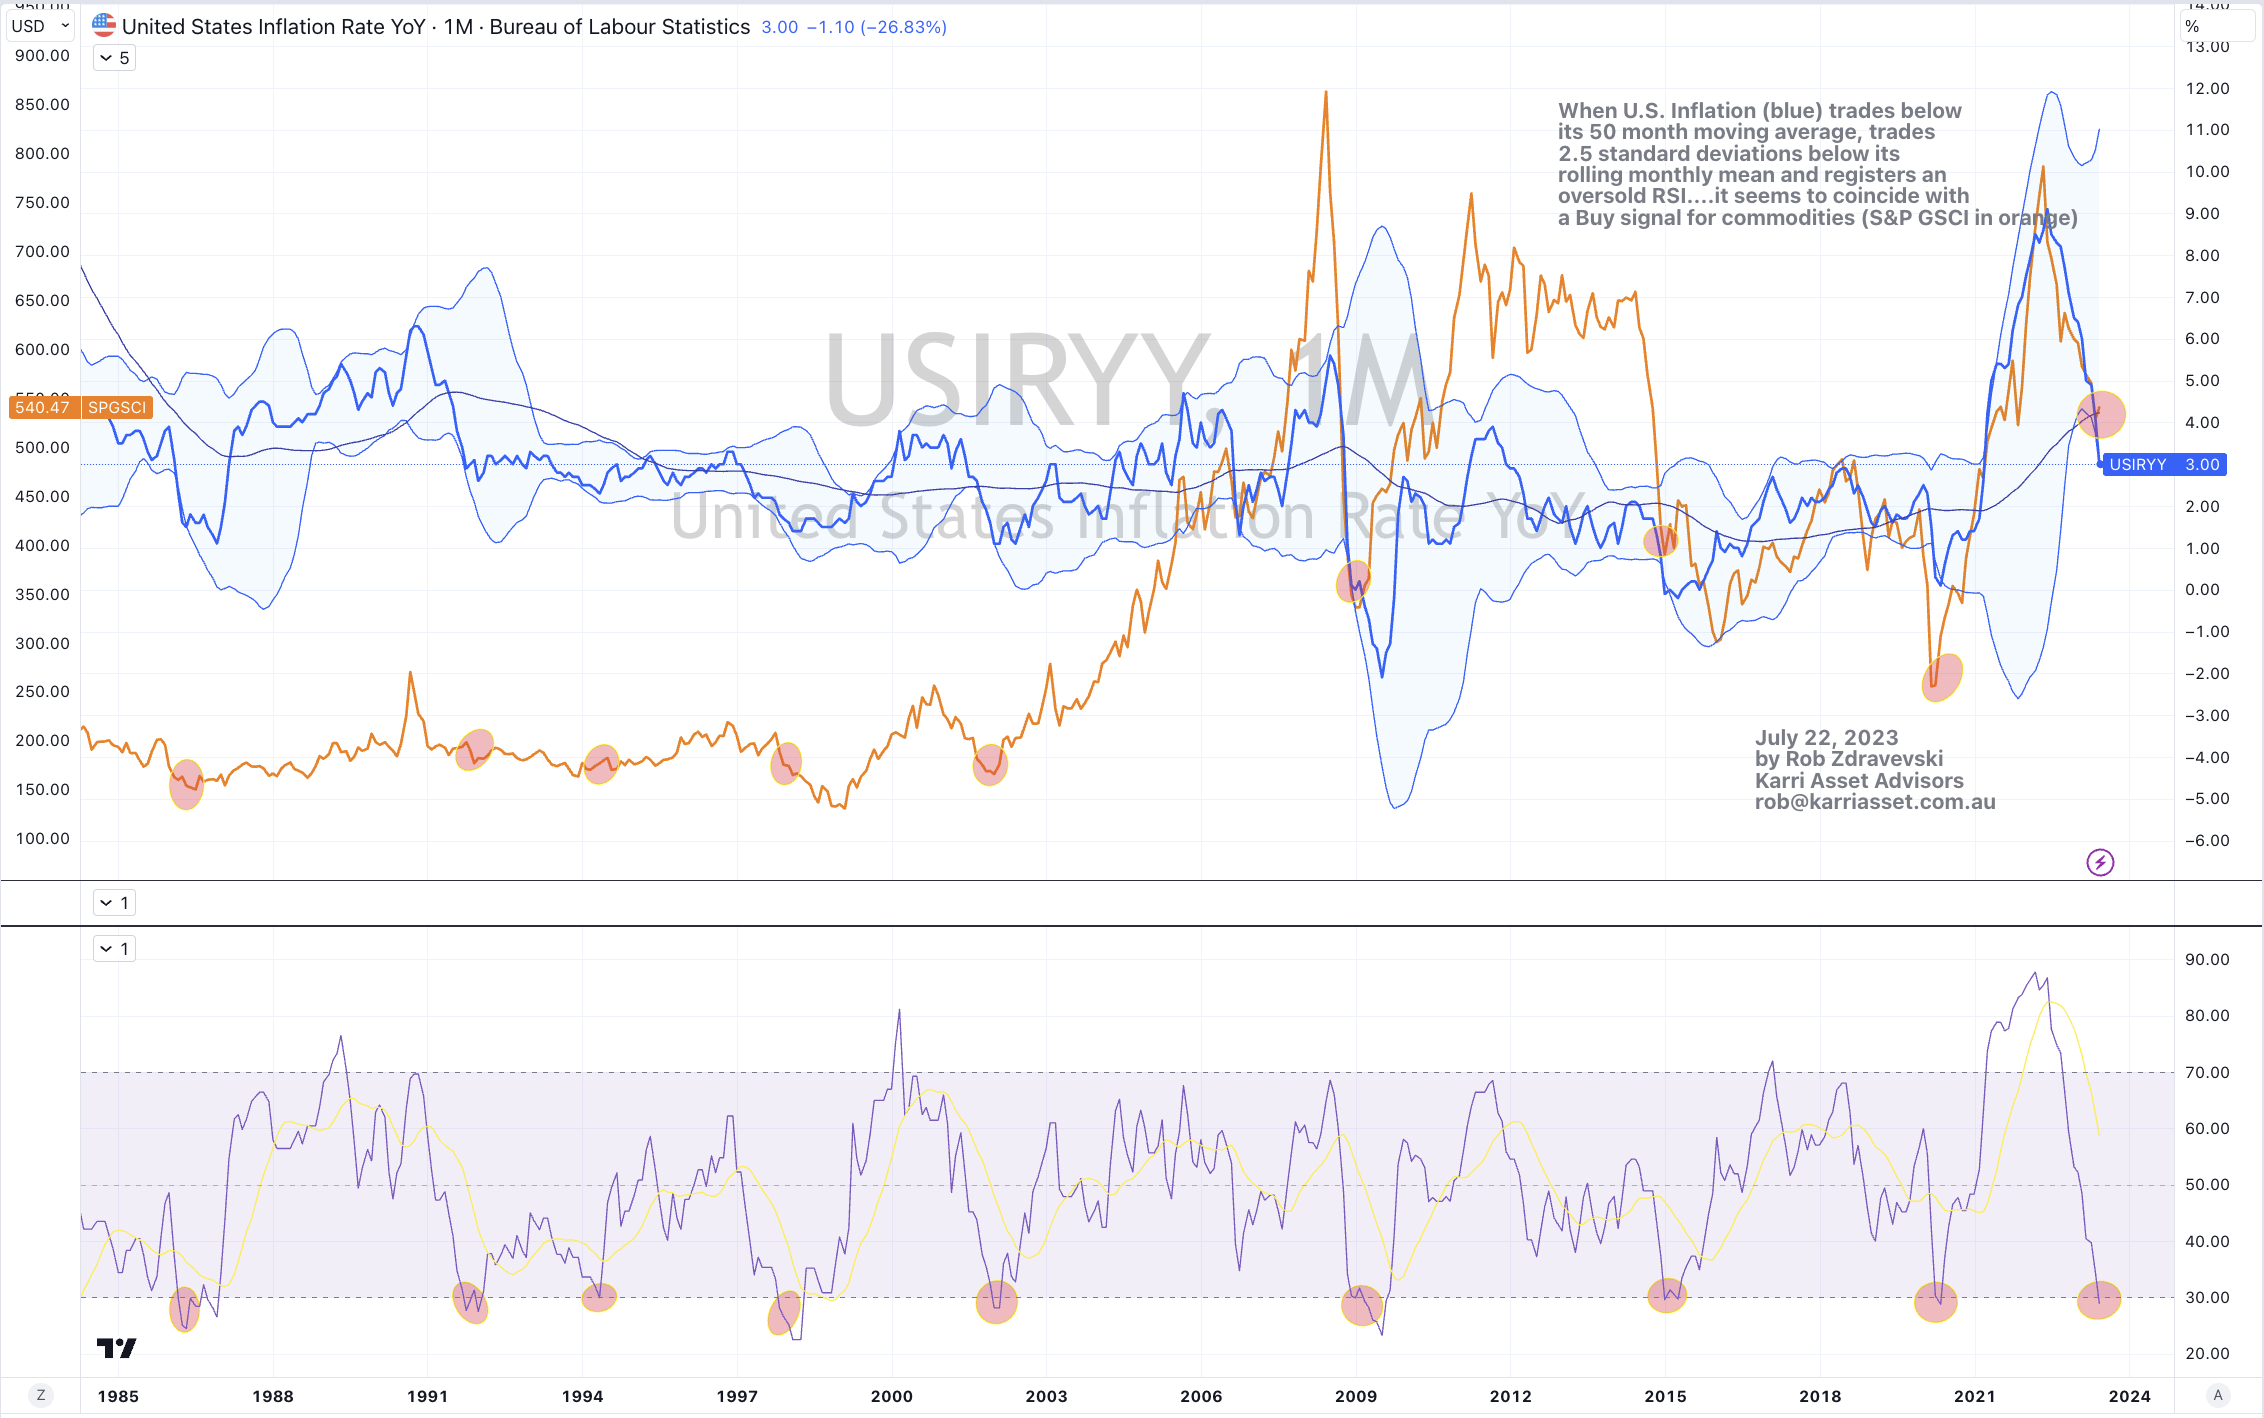
I am warming to #commodities.
Readers of my posts may note that I’ve been bearish commodities for about 15 months, which was soon after the Russian invasion of Ukraine.
I have a host of reasons for my commodity bullishness but the study below helps paint a correlated picture to support my broader thinking.
When the U.S. Inflation Rate (blue) ventures below its 50 month moving average, it trades 2.5 standard deviations below its rolling monthly mean and also registers an oversold RSI reading….it seems to coincide with a Buy signal for commodities, with the S&P Goldman Sachs Commodity Index represented in orange.
This chart reprises one posted 6 days ago.
July 22, 2023
by Rob Zdravevski
rob@karriasset.com.au
July 17, 2023 Leave a comment
When the Wilshire 5000 / S&P GSCI ratio pokes its head above its 200 week moving average and trades at 2.5 standard deviations above its rolling weekly mean while this ratio also registers a weekly overbought reading, it produces a signal that equities are expensive relative to commodities.
In turn, it produces a ‘relative’ buy signal in commodities, with the orange line representing the S&P GSCI Index in the chart below.
And just like the immediately preceding post….
Today, it is relative signal but not absolute.
I’ll look for absolute at a later time.
July 17, 2023
by Rob Zdravevski
Karri Asset Advisors
rob@karriasset.com.au

July 17, 2023 Leave a comment
I pre-empted this moment a couple weeks ago in this post.
Today, it is relative signal but not absolute.
I’ll look for absolute at a later time.
When U.S. Inflation (blue) trades below its 50 month moving average, trades 2.5 standard deviations below its rolling monthly mean and registers an oversold RSI….it seems to coincide with a Buy signal for commodities (S&P GSCI in orange).
I’ve circled the 8 occurrences over the past 35 years.
July 17, 2023
by Rob Zdravevski
rob@karriasset.com.au
July 16, 2023 Leave a comment
A weekly Macro, Cross Asset review of prices trading at extremes which may generate future investment ideas and opportunities.
The following assets (on a weekly timeframe) either registered an Overbought or Oversold reading and/or have traded more than 2.5 standard deviations above or below its rolling mean.
Extremes “above” the Mean (at least 2.5 standard deviations)
Canadian 10 year government bond yield
Lumber
Oats
Dow Jones Transports
Nasdaq Transports
S&P MidCap 400
NZD/USD
SGD/USD
KRW/USD
AUD/USD
AUD/INR
Overbought (RSI > 70)
Australia 2 & 3 year government bond yields
Russian 10 year government bond yields
U.S. 3 month bill yields
Cocoa
Cattle
GBP/JPY
MXN/USD
Nasdaq 100
Nasdaq Composite Index
India’s Nifty 50 and Sensex
And Russia’s MOEX equity index
The Overbought Quinella – Both Overbought and Traded at > 2.5 standard deviations above the weekly mean)
EUR/USD
GBP/USD
DKK/USD
Turkiye and Chile’s equity indices
Extremes “below” the Mean (at least 2.5 standard deviations)
U.S. Dollar Index
Oversold (RSI < 30)
Brazilian 10 year government and yield
Newcastle Coal
JPY/GBP
The Oversold Quinella – Both Oversold and Traded at < 2.5 standard deviations below the weekly mean)
None
Notes & Ideas:
Equities had a strong week, more than recovering the previous week’s decline.
We saw a bullish outside reversal week for the Nasdaq 100 and the ASX 200.
Chinese equities are attracting some of my attention.
Nasdaq 100 is overbought for the 8th straight week
The Nasdaq Composite returns to being overbought, as did the Istanbul and Santiago bourses.
The Nikkei 225 had a subdued week, rising the smallest margin of 0.01%.
While the Russell 2000 and the S&P 500 are nearing overbought levels and the KRE Regional Banks Index has risen 9% over the past 3 weeks.
Government bond yields fell with many easing from some multi-year highs.
While for others, this weeks decline meant that they are still short of yield highs seen several months ago, such as the U.S. 10 year bond which hasn’t traded traded above its October 2022 4.34% level.
The Australia 2 year government bond yields aren’t overbought.
But the Canadian 10 year were during the week when they were trading at 3.72% before closing at 3.37%.
And various curves and spreads moved out of oversold territory such as the Australian 10 year minus 2 year yield spread.
The U.S. 10 year yield minus U.S. 10 year inflation breakeven rate had an outsider bearish week, as did the British 2 year bond.
The intra-week swing in the latter saw it move from a high of 5.77% to a low of 5.04%. It closed at 5.19%.
And inversely, the Brazilian 10 year yields rose from their lowest yield levels since August 23, 2021.
Commodities were overwhelmingly positive.
Shipping Rates, Silver and Platinum were the best performers, while LNG Gas and Coal contracts were the heavy losers.
The latter are now in or nearing oversold land.
Lean Hogs are no longer at extended heights, while Cattle makes a return to overbought territory.
Oil continues a rise hitting a 3 week streak and WTI posting a 8% since then.
Over the same time, Middle Eastern Urea prices have climbed 16%.
Dutch TTF Gas has sunk 32% over the past 2 weeks, giving up much of the previous months rally.
And Palladium and Corn performed a bullish outside reversal week.
Currencies were active.
Weakness in the U.S. Dollar dominated trade for the week.
So much so, the U.S. Dollar Index (DXY) made a return to oversold territory for the first time since December 2020.
Inversely, the Australian Dollar saw strength and this week it’s at overbought extremes against the USD.
And a host of currency pairs returned to this week’s extremes list.
The larger advancers over the past week comprised of;
Baltic Dry Index 8%, Brent Crude 1.8%, WTI Crude 2.2%, Copper 3.8%, Lumber 7.5%, Cattle 1.9%, Palladium 2.2%, Platinum 7.1%, Gasoline 2%, Sugar 3.4%, Silver 8.1%, S&P GSCI 1.9%, CRB Index 2.4%, Urea U.S. Gulf 4.1%, Urea Middle East 2.3%, Silver in AUD 5.7%, Corn 3.6%, Soybeans 4.1%, CSI 300 1.9%, AEX 3.4%, KBW Banking Index 1.9%, CAC 3.7%, DAX 3.2%, DJ Industrials 2.3%, DJ Transports 1.7%, MIB 3.2%, HSCEI 5.8%, Hang Seng 5.7%, IBEX 2.1%, Nasdaq Composite 3.3%, KOSPI 4%, S&P MidCap 400 2.7%, Nasdaq Biotechs 3%, Nasdaq 100 3.5%, Copenhagen 1.7%, Russell 2000 3.6%, Swiss SMI 2.2%, SOX 4.8%, S&P 500 2.4%, Singapore’s STI 3.5%, TAIEX 3.7%, TSX 2.2%, FTSE 100 2.5%, ASX 200 3.7%, Istanbul 4.6%, KLSE 2.5%, Thailand’s SET 1.8%, KRE Regional Banks 4%, S&P SmallCap 600 3.1% and Chile’s IGPA rose 3%.
The group of decliners included;
Rotterdam Coal (10.5%), DXY (2.3%), Iron Ore (3.4%), Lean Hogs (5.9%), JKM LNG (11.6%), Newcastle Coal (4.8%), Dutch TTF Gas (24.5%) and Oats fell 3%.
July 16, 2023
by Rob Zdravevski
rob@karriasset.com.au
