A weekly Macro, Cross Asset review of prices trading at extremes which may generate future investment ideas and opportunities.
The following assets (on a weekly timeframe) either registered an Overbought or Oversold reading and/or have traded more than 2.5 standard deviations above or below its rolling mean.
Extremes “above” the Mean (at least 2.5 standard deviations
China 10 year government bond yields
SHY – 1-3 year Treasury ETF
Coffee
Silver
AUD/CAD
AUD/ZAR
IBEX
Overbought (RSI > 70)
Cocoa
Iron Ore
Uranium
Gold in USD
The Overbought Quinella – Both Overbought and Traded at > 2.5 standard deviations above the weekly mean)
Baltic Dry Index
U.S. Midwest Hot Rolled Coil Steel
Extremes “below” the Mean (at least 2.5 standard deviations)
German and U.S. 2 year government bond yields
German 5 year government bond yield
Swiss and Portuguese 10 year government bond yields
U.S. 20 year government bond yield
Cattle
Middle East Urea
Oversold (RSI < 30)
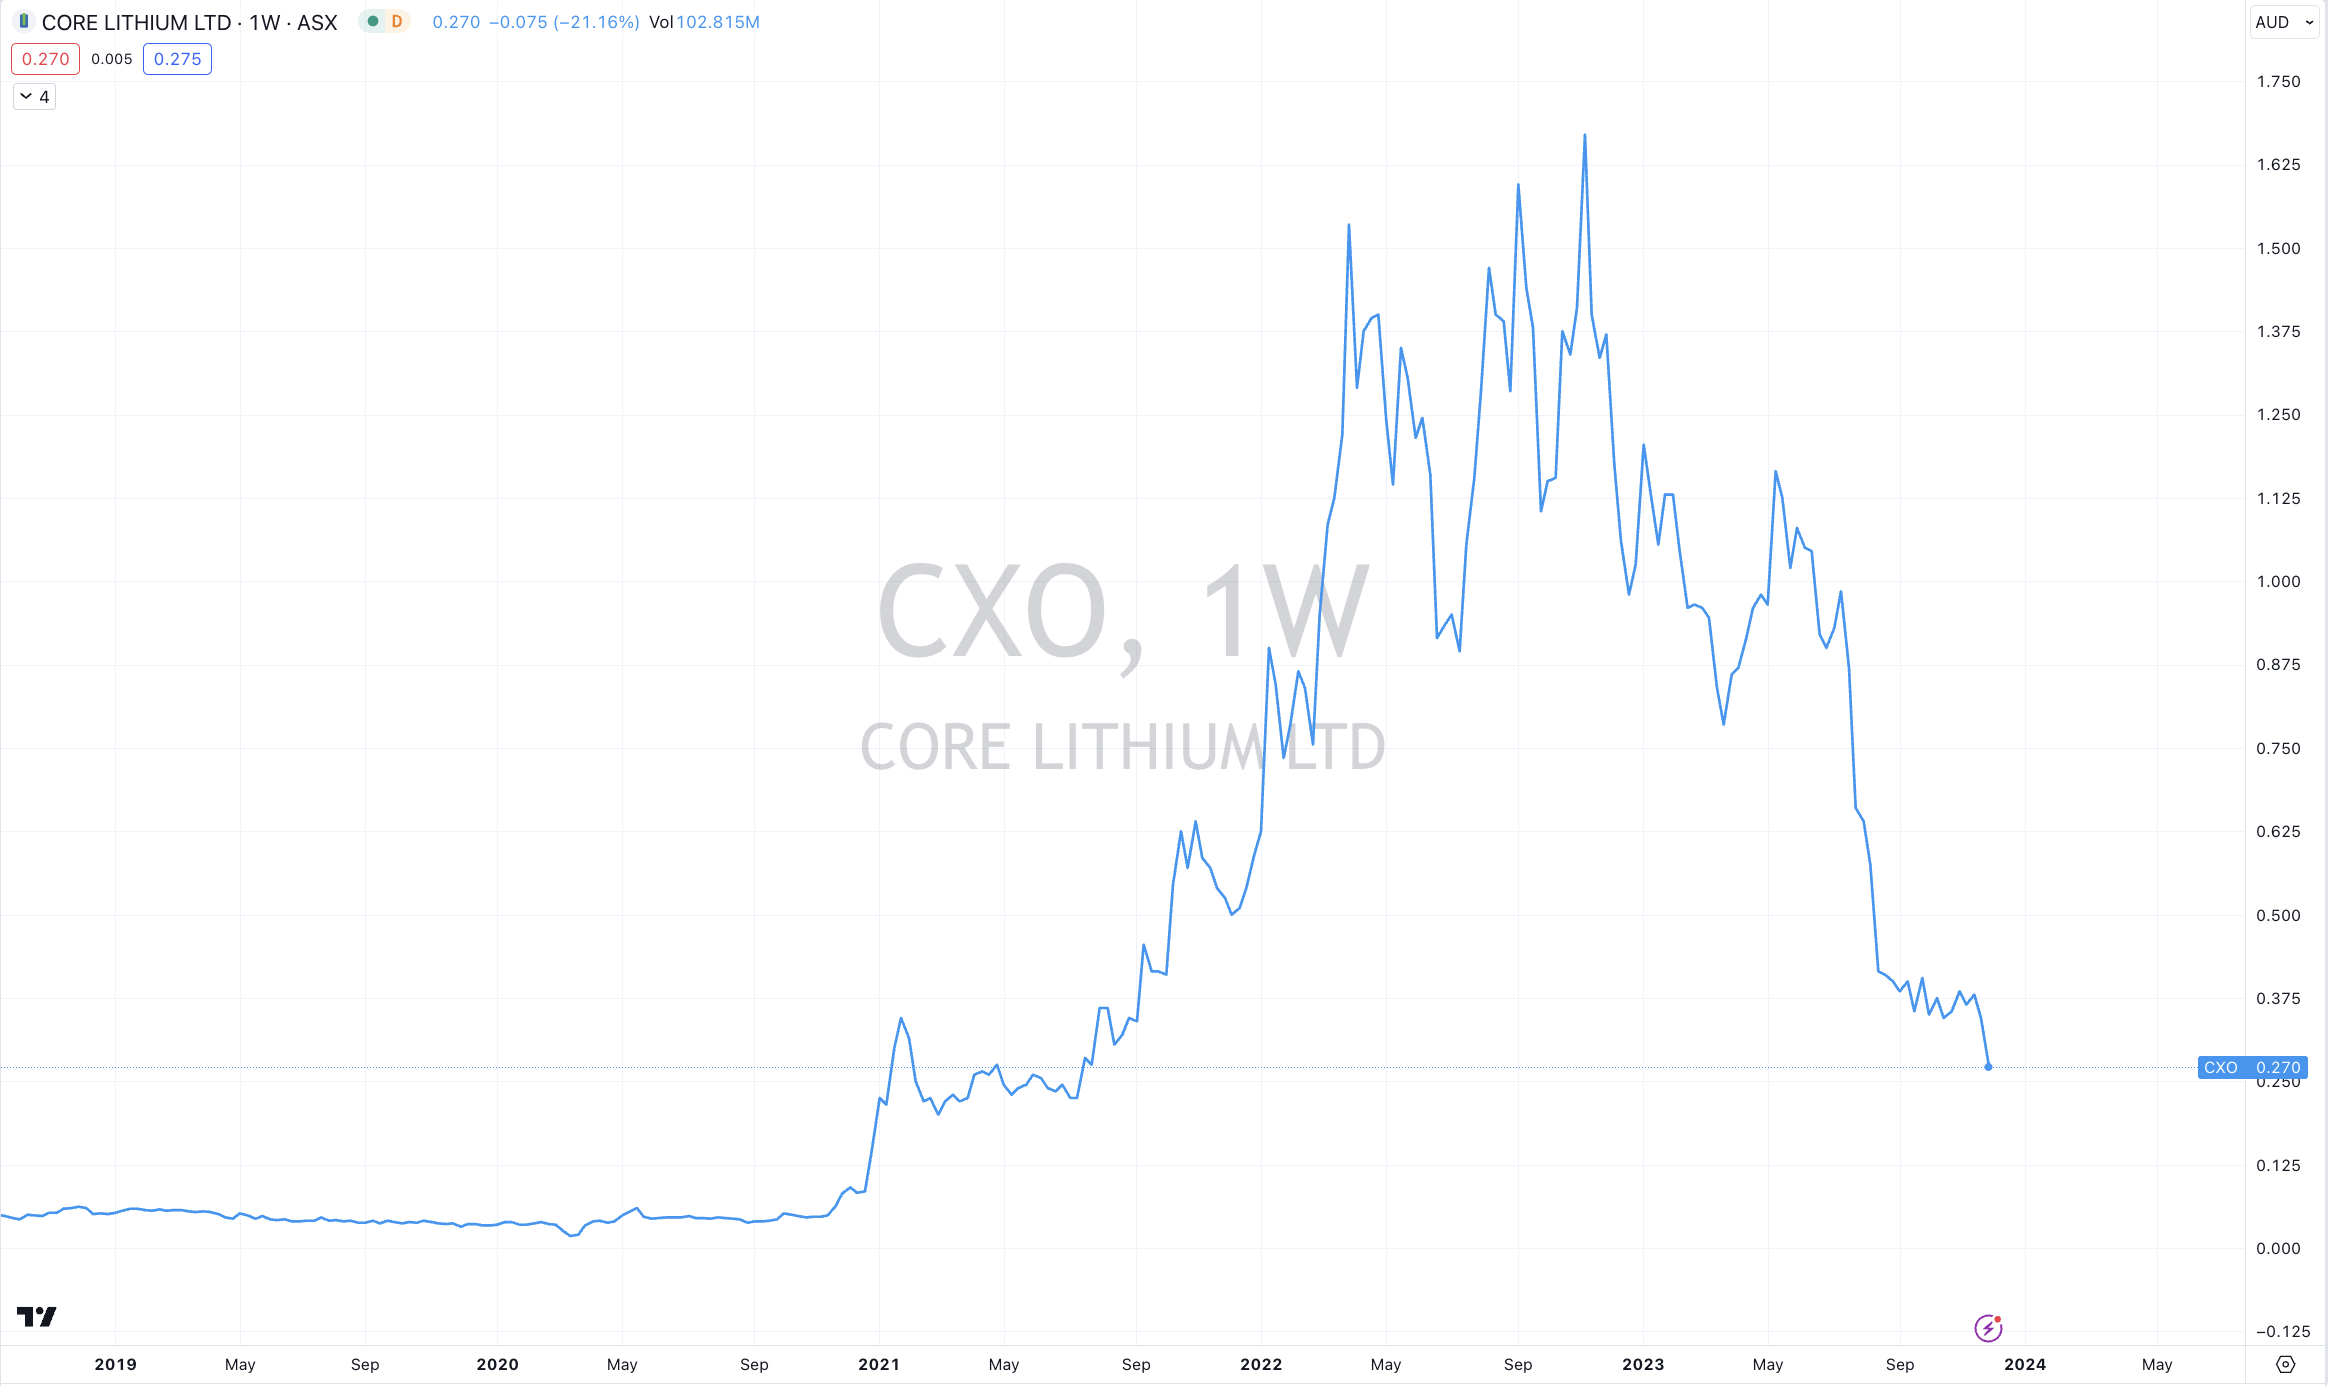
Lithium Hydroxide
The Oversold Quinella – Both Oversold and Traded at < 2.5 standard deviations below the weekly mean)
Chilean 2 year government bond yield
Notes & Ideas:
Government bond yields fell everywhere.
Yields remain notably below their recent and oft touted highs and ‘higher for longer’ virtues.
So much so, we are seeing new bond yield entrants in the oversold category in this week’s edition.
The U.S. 5 year bond posted an outside bearish week, closing the week at 4.13%, down from its recent 5% level.
The TLT (20+ year) ETF stock price has risen 11.6% over the past 6 weeks. That ETF appeared in the oversold extreme categories in the weeks prior.
To the contrary of the herd, the long end of the yield curve has performed the best, while the IEI (3-7 year) ETF has climbed 2.8% over the same time.
Other eye-openers include the BoA 5-7 year corporate bond yield is hovering at the same yield as August 7, 2023.
Turkish 10 year government bond yields fell so much that they ended their 11 week stay in overbought territory.
Equities were mainly higher for the week extending most gains from the preceding 2 weeks.
Advancing stocks slightly outnumbered declining ones during this period.
Spain’s IBEX is registering an overbought reading.
We saw small and mid caps catching up to major indices, which were subdued compared to the overall bullish sentiment.
For example, the Nasdaq Composite advanced 0.4%, the ASX 200 rose 0.5%, the S&P 500 climbed 0.8% while the SOX eased 0.3%.
The following indices have risen for 5 consecutive weeks; AEX, DAX, DJ Industrials, Nasdaq Composite and the 100, KOSPI, Sensex, Copenhagen, S&P 500 and the TAIEX.
Brazil’s BOVESPA and the IPC Mexico Index are in a 6 week winning streak. The former is a whisker from appearing in the overbought quinella in the next week or so.
U.S. Banks had a big week.
Chinese indices dominated the losers for the week.
And India’s SENSEX seems to be amongst the most extended of bourses, as it trades at 27% above its 200 week moving average.
Commodities were mixed with the winners outpacing the decliners this past week.
Precious metals were mainly stronger.
Iron Ore has made a new overbought appearance as it has out together a 7 week rising streak.
U.S. MidWest Hot Rolled Coil Steel rose 15% and completed a mean reversion (upward) towards its 200 week moving average, having soared 42% since spending the month of October 2023 being oversold.
While Cattle prices have clearly declined since their recent stint being overbought.
Rubber isn’t overbought anymore, joining Orange Juice which left that territory in the previous week.
WTI Crude, Brent Crude, Gasoline extend their losing streaks to 6.
Nickel isn’t oversold anymore, braking its 5 week losing streak, rising 6% and posted a bullish outside reversal week.
WTI Crude is at its lowest weekly closing price since early July 2023. So much for geopolitical risks affecting the Oil price??
Lumber broke its 5 week winning streak as is the Copper/Gold Ratio.
Natural Gas has slumped 22% over the past 4 weeks.
The Baltic Dry Index has soared 90% in the past 4 weeks and is in a 4 week winning streak. Incidentally, it has tripled in price over the past 4 months.
Uranium remains overbought for a 16th consecutive week.
Lithium Hydroxide prices are now oversold for 21 consecutive weeks.
Silver’s bullish outside week seen 3 weeks ago has resulted in 14% advance since then.
AUD priced Gold broke its 4 week losing streak, while USD Gold is a new overbought extreme.
Amongst currencies, the Australian Dollar was stronger again.
The Aussie was stronger, the Euro was weaker, the GBP was weaker as was the USD.
The AUD/USD closed at its highest levels since late July 2023.
The AUD/JPY is nearly overbought, while the AUD/ZAR soared 3.5%.
In the previous week, the EUR/JPY closed at its highest price since August 4th, 2008. This week, the Yen rose and so the EUR/JPY drifted out from being overbought.
The same goes for the GBP/JPY.
The EUR/USD had a bearish outside week,
And…..I’m reflecting on how the AUD/JPY is nearing overbought levels again, mimicking and confirming the ‘risk-on’ sentiment amongst equities.
The larger advancers over the past week comprised of;
Australian Coking Coal 4.4%, Baltic Dry Index 51.9%, Cocoa 2.7%, China Coking Coal 12.1%, Copper 3.8%, HRC 15.3%, Coffee 9.6%, Newcastle Coal 4%, Nickel 5.7%, Silver in USD 4.7%, Silver in AUD 3.3%, Gold in AUD 2.2%, Gold in CAD 2.6%, Gold in USD 3.5%, Corn 4.6%, Wheat 4.4%, KBW Banks 5.5%, DAX 2.3%, DJ Industrials 2.6%, DJ Transports 2.5%, IBEX 2%, BOVESPA 2.1%, Indonesia 1.8%, S&P SmallCap 600 2.8%, KRE Regional Banks 6.9%, S&P MidCap 400 2.5%, Nasdaq Biotechs 2.8%, Russell 2000 3.3%, Sensex 2.3%, Chile 1.9%, Nasdaq Transports 2% and Toronto’s TSX rose 1.7%.
The group of decliners included;
WTI Crude (2%), Cotton (1.9%), Gasoil (3.3%), Heating Oil (6.1%), Lumber (4.7%), JKM LNG (4.9%), Lithium (13.6%), Tin (5.7%), Orange Juice (4.1%), Palladium (6%), Sugar (7%), Dutch TTF Gas (6.8%), Urea U.S. Gulf (4.4%), Urea Middle East (12.2%), Rice (2.2%), CSI 300 (1.6%), China A50 (2.5%), HSCEI (4.6%), MOEX (2.4%) and the Hang Seng fell 4.2%.
December 3, 2023
by Rob Zdravevski
rob@karriasset.com.au