A weekly Macro, Cross Asset review of prices trading at extremes which may generate future investment ideas and opportunities.
The following assets (on a weekly timeframe) either registered an Overbought or Oversold reading and/or have traded more than 2.5 standard deviations above or below its rolling mean.
Extremes “above” the Mean (at least 2.5 standard deviations)
Australian, Brazilian, Swiss, German, Spanish, Greek, South Korean, French, Portuguese, Swedish and Turkish 10 year government bond yields
German 5 year government bond yield
U.S. 5 year bond minus 3 month bill yield spread
U.S. 10 year bond minus 2 year yield spread
U.S. 10 year bond minus 5 year yield spread
Baltic Dry Index
Gold Volatility Index
Natural Gas
Overbought (RSI > 70)
Japanese 10 year government bond yield
U.S. 5-7 year corporate bond yields
U.S. 3 month bill yields
Australian 10 year bond minus 2 year yield spread
Australian 10 year bond minus 5 year yield spread
Orange Juice
Uranium
USD/CLP
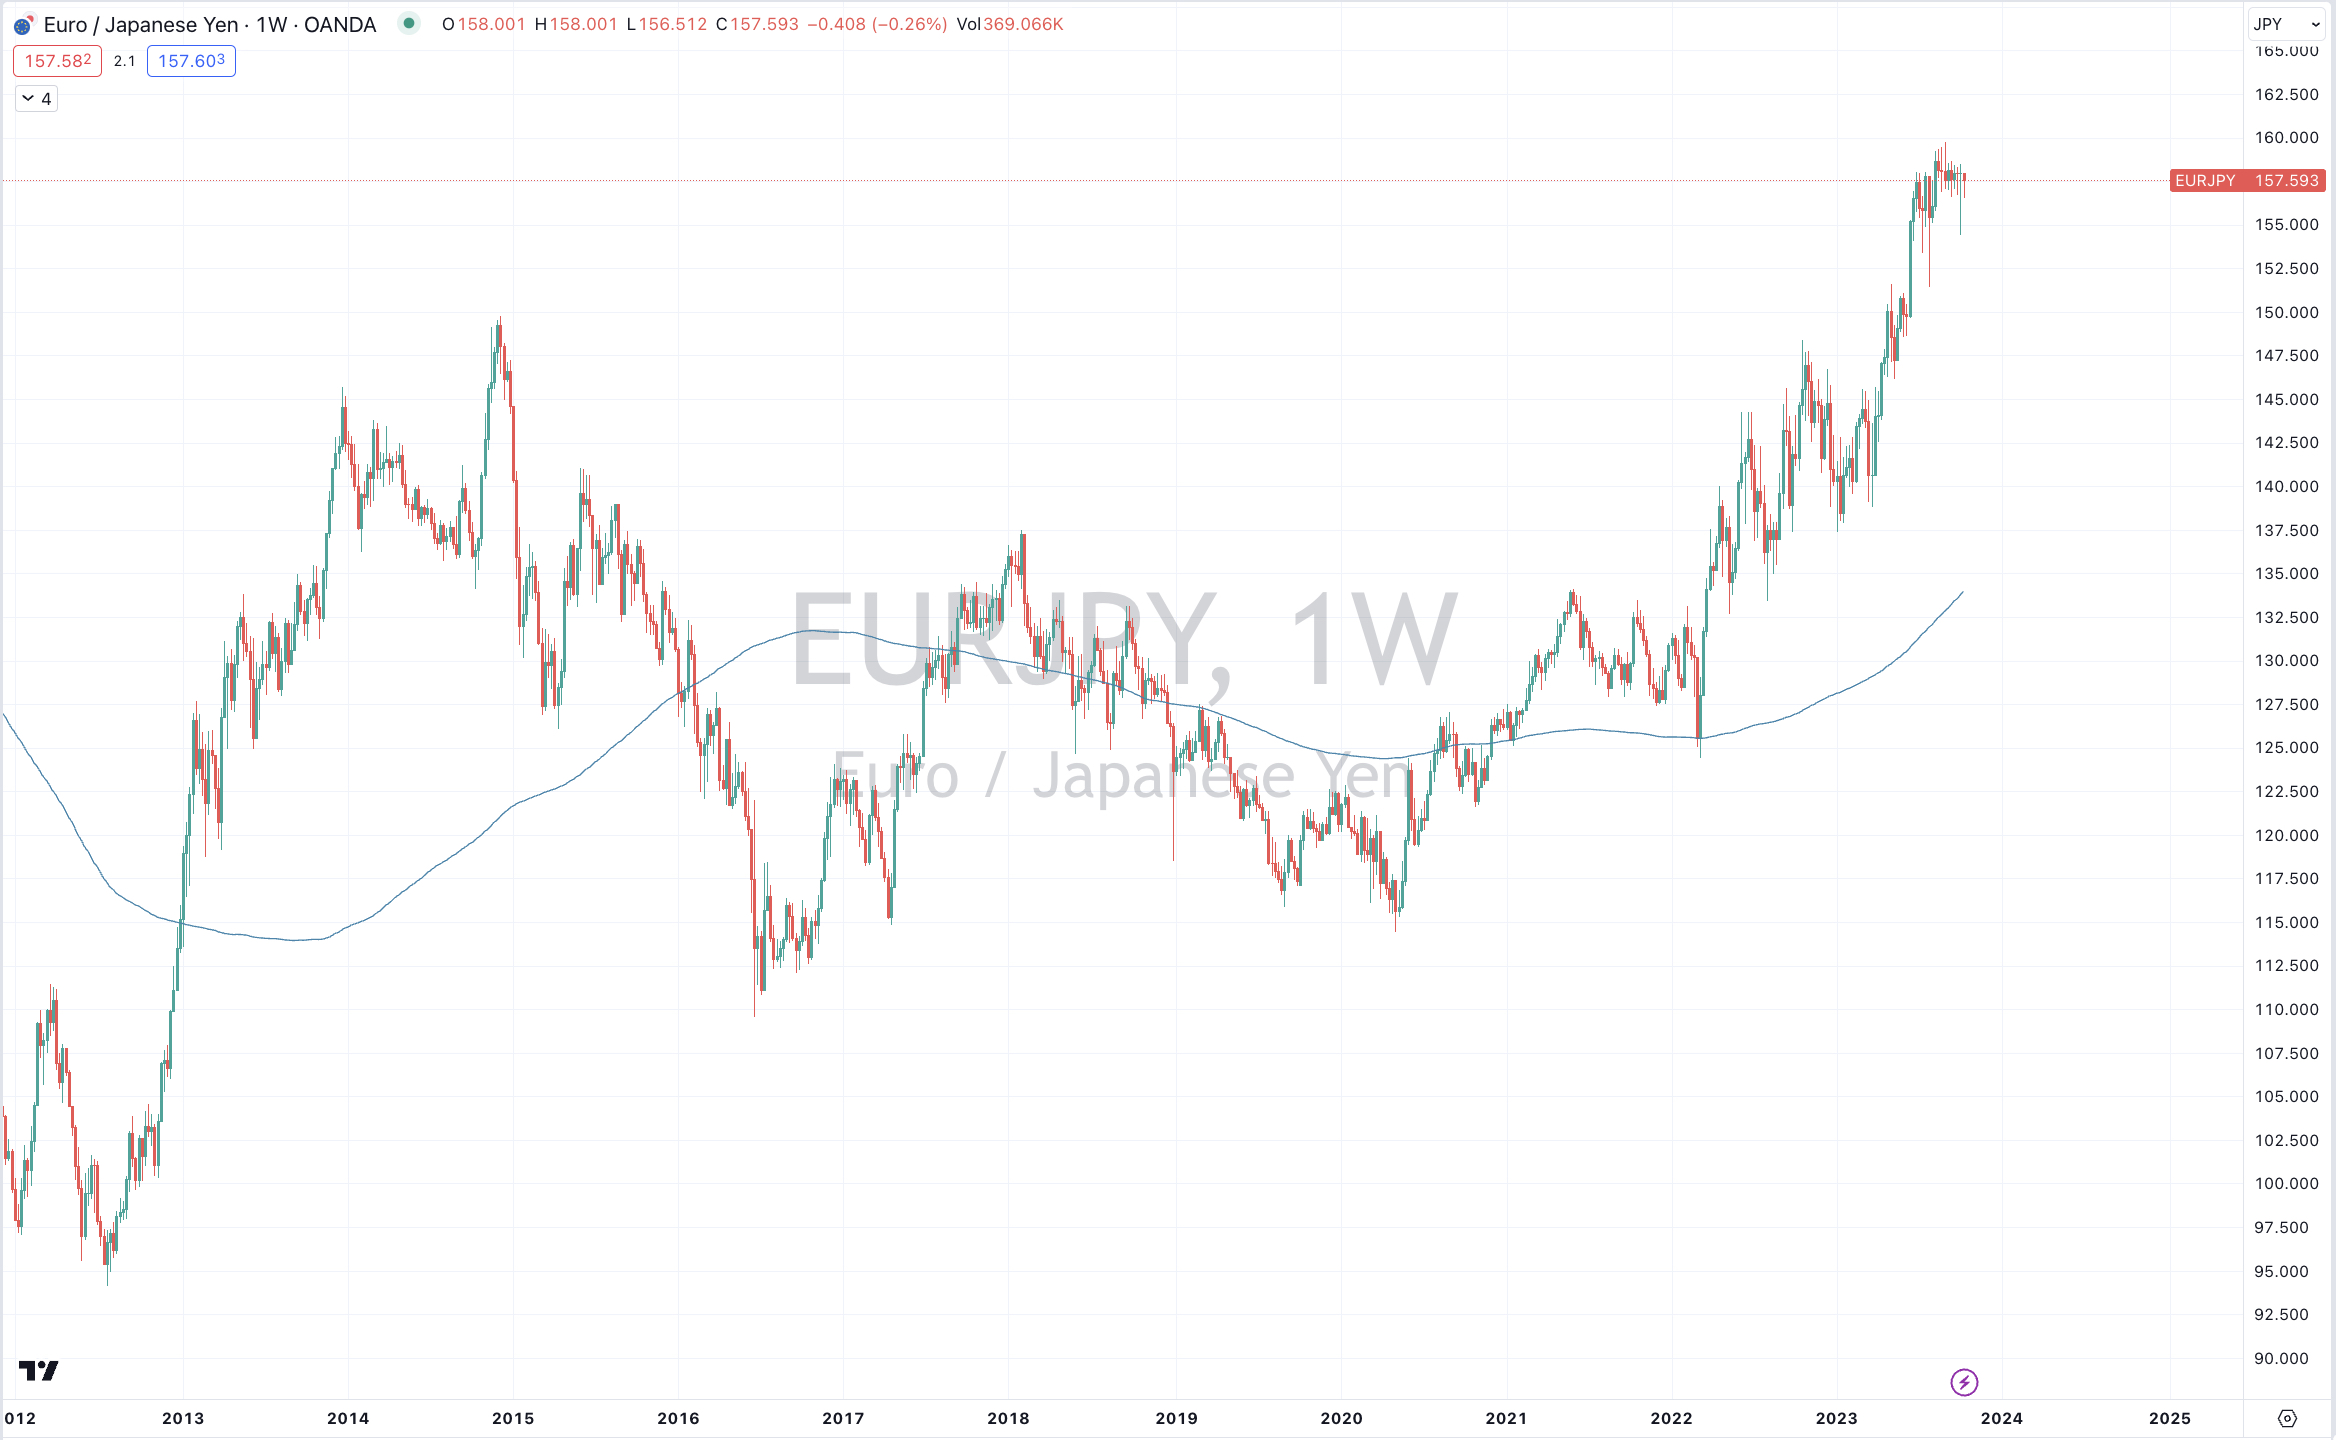
USD/JPY
And Turkiye’s BIST 100
The Overbought Quinella – Both Overbought and Traded at > 2.5 standard deviations above the weekly mean)
Canadian, Italian, Chilean and New Zealand 10 year government bond yields
U.S. 5, 7, 10, 20 and 30 year government bond yields
TBT & TBX
U.S. 5 year bond yield minus 5 year inflation break-even rate
U.S. 10 year bond yield minus 10 year inflation break-even rate
U.S. 10 yer bond yield minus German 10 year bond yield
Australian Coking Coal
China Coking Coal
Extremes “below” the Mean (at least 2.5 standard deviations)
IEF & IEI
Copper
Gasoline
Silver (in AUD & USD)
Gold (in CAD)
Soybeans
BRL/USD
MXN/USD
CAC
DAX
HSCEI
IBEX
S&P Small Cap 600
KOSPI
FTSE 250
Nikkei 225
ASX Small Caps
ASX 200 Industrials
ASX 200
TSX
S&P Small Cap 600 Value
Nasdaq Biotechnology Index
Copenhagen
Russell 2000
And Thailand’s SET Index
Oversold (RSI < 30)
U.S. Mid West Hot Rolled Coil Steel
Lithium Hydroxide
JPY/USD
CLP/USD
The Oversold Quinella – Both Oversold and Traded at < 2.5 standard deviations below the weekly mean)
TLT & IEF
Nickel
THB/USD
IDR/USD
Notes & Ideas:
Government bond yields rose again except for the German 2’s and 5’s and the same for the British 2’s.
This week’s list has seen a few more names join the overbought extremes with many nearing an appearance closing in on wi
However, while highs over recent times are now being made, the past several weeks sees many global government bond yields yet to break the previous major cycle highs of 2007 and 2011.
Note those U.S. yields which appear in the ‘quinella’ section of this week’s list.
Most Equity indices continued more of their recent weakness with the past week gathering a little steam in the decline from last week’s ‘pause’.
This week’s list of extremes features the most equity indices in some months visiting the oversold end of the pendulum.
The recent exception has been the larger U.S. indices have generally held up for the 2nd consecutive week. For example the S&P 500 rose 0.5% and the Nasdaq Composite rose 1.6%.
Much more damage is being seen in the smaller cap indices. The Russell 200 has fallen 13% over the past 10 weeks. This past week’s decline of 2% was less worse due to Friday’s 1.2% rise.
Copenhagen’s index mean reverted.
Thailand’s SET has fallen for 5 consecutive weeks.
The Nikkei 25 is 10% below that lauded peak a couple months ago
And more acutely, the KOSPI has now fallen 7.5% in the past 3 weeks.
Most Commodities declined during the week.
Energy and Precious Metals weighed on the performance of the commodity indices.
Natural Gas, Shipping Rates and Agricultural were amongst the few were prices rose.
Gasoil isn’t overbought anymore for a 12% decline this past week, while Gold in USD mean reverted.
The Baltic Dry Index and Orange Juice have risen for 5 consecutive weeks, with the former soaring 64% and is now overbought.
Amongst the weekly losing streaks, Soybeans and Gold (as priced in CAD) are at 5, Nickel and Gasoline have reached 4 (the latter also completed a mean reversion and has declined 18% in the past 3 weeks), Brent Crude is in its 3rd week
Silver in USD has fallen 8.5% in 2 weeks.
Natural Gas has soared 25% in the past 2 weeks, while Silver (in USD) has fallen 8.5% over the same time.
Nickel recorded a quinella of oversold extremes.
Uranium fell 5% but remains overbought for an 8th consecutive week.
Orange Juice closed at another new all-time high.
U.S. Mid West Hot Rolled Coiled Steel has been oversold for 6 weeks.
Soybeans have declined for 6 consecutive weeks, while Lithium Hydroxide declining streak extends to 13 consecutive weeks.
And Australian Coking Coal maintains a 13 week winning streak intact and is registering an overbought quinella, while having risen 52% over the past couple months.
Amongst currencies, the Australian Dollar was weaker against all except versus the IDR, THB and ZAR.
The latter pairing (AUD/ZAR) is in a 6 week winning streak.
The Euro was mixed. It’s small weekly gain against the USD saw an end to its 11 week losing streak.
The British Pound firmer for the week.
The big loser was the Colombian Peso versus the USD and it appears in this weeks list as such.
The AUD is in a 6 week consecutive week advance versus the Thai Baht.
The CAD/EUR broke its 6 week winning streak.
The DXY fell 0.1% for the week, ending its 11 weeks winning streak and that is the case specifically for USD/DKK.
The GBP/USD broke its 6 week losing streak.
The Malaysian Ringgit versus USD is in its 6th consecutive week of decline.
And the BRL/USD mean reverted.
The larger advancers over the past week comprised of;
Australian Coking Coal 9.2%, Baltic Dry Index 13.4%, Lean Hogs 2.3%, Natural Gas 14%, Orange Juice 7.9%, Corn 3.2%, Wheat 4.9% and the BIST 100 rose 1.6%.
The group of decliners included;
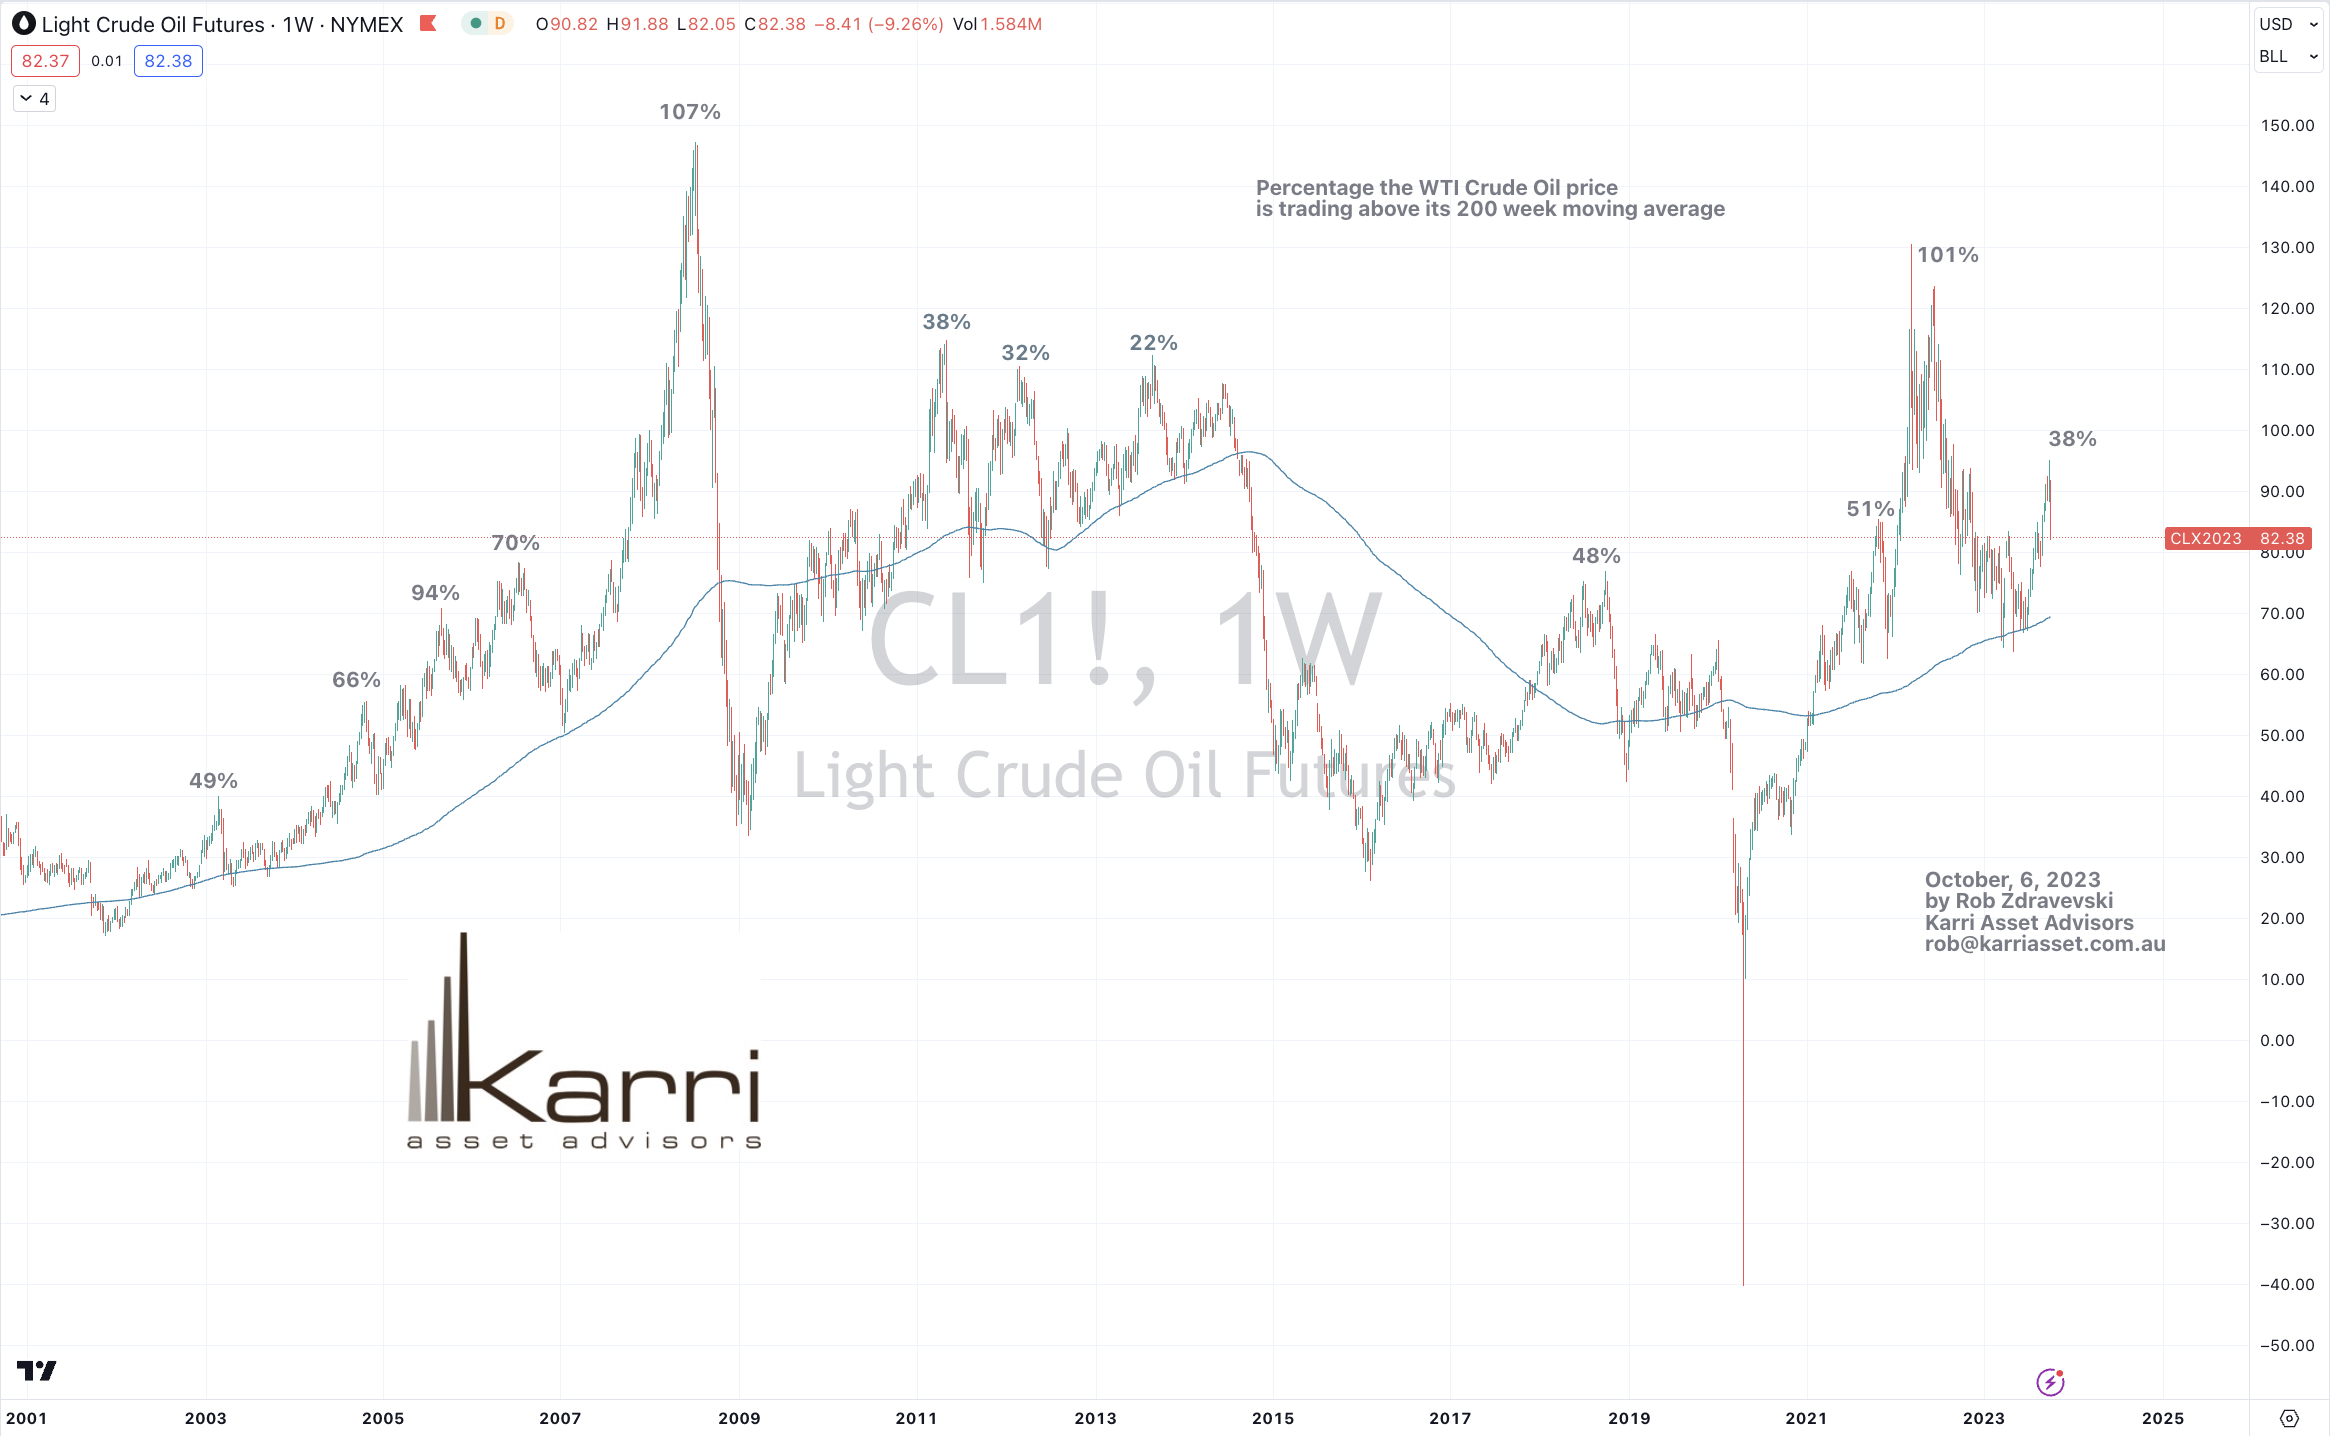
Aluminium (4.8%), Rotterdam Coal (4.1%), Bloomberg Commodity Index (2.2%), WTI Crude (8%), Gasoil (12.1%), Copper (2.7%), Heating Oil (11.6%), Lumber (2.1%), LNG JKM (3.8%), Lithium Hydroxide (5.8%), Tin (7.1%), Newcastle Coal (11.5%), Nickel (2%), Palladium (7.4%), Platinum (3.8%), Gasoline (8.6%), S&P GSCI (5.6%), CRB Index (2.7%), Dutch TTF Gas (8.7%), Brent Crude (8.4%), Urea Middle East (2.3%), Uranium (4.9%), Silver in AUD (1.9%), Silver in USD (2.7%), Oats (2%), KBW Bank Index (2.8%), MIB (1.5%), HSCEI (2.8%), Hang Seng (1.8%), IBEX (2%), BOVESPA (2.1%), S&P Small Cap 600 (2.3%), KOSPI (2.3%), FTSE 250 (3%), S&P MidCap 400 (1.8%), Mexico (2.4%), Nikkei (2.7%), Oslo (3.1%), Helsinki (1.9%), Russell 2000 (2%), SET (2.2%), S&P Small Cap 600 Value Index (3%), Chile (3%), TSX (1.5%), FTSE 100 (1.5%), ASX 200 (1.3%), ASX 200 Industrials (1.9%) and the ASX Small Caps fell 2.7%.
October 8, 2023
by Rob Zdravevski
rob@karriasset.com.au