A weekly Macro, Cross Asset review of prices trading at extremes which may generate future investment ideas and opportunities.
The following assets (on a weekly timeframe) either registered an Overbought or Oversold reading and/or have traded more than 2.5 standard deviations above or below its rolling mean.
Extremes “above” the Mean (at least 2.5 standard deviations
IEI
SHY – 1-3 year Treasury ETF
Coffee
AUD/EUR
AUD/INR
AUD/SGD
CNH/USD
NZD/USD
KBW U.S. Bank Index
KRE U.S. Regional bank Index
Stockholm
ASX Materials Index
Overbought (RSI > 70)
Cocoa
Uranium
Nasdaq 100
The Overbought Quinella – Both Overbought and Traded at > 2.5 standard deviations above the weekly mean)
Brazil’s BOVESPA
Mexico’s IPC Index
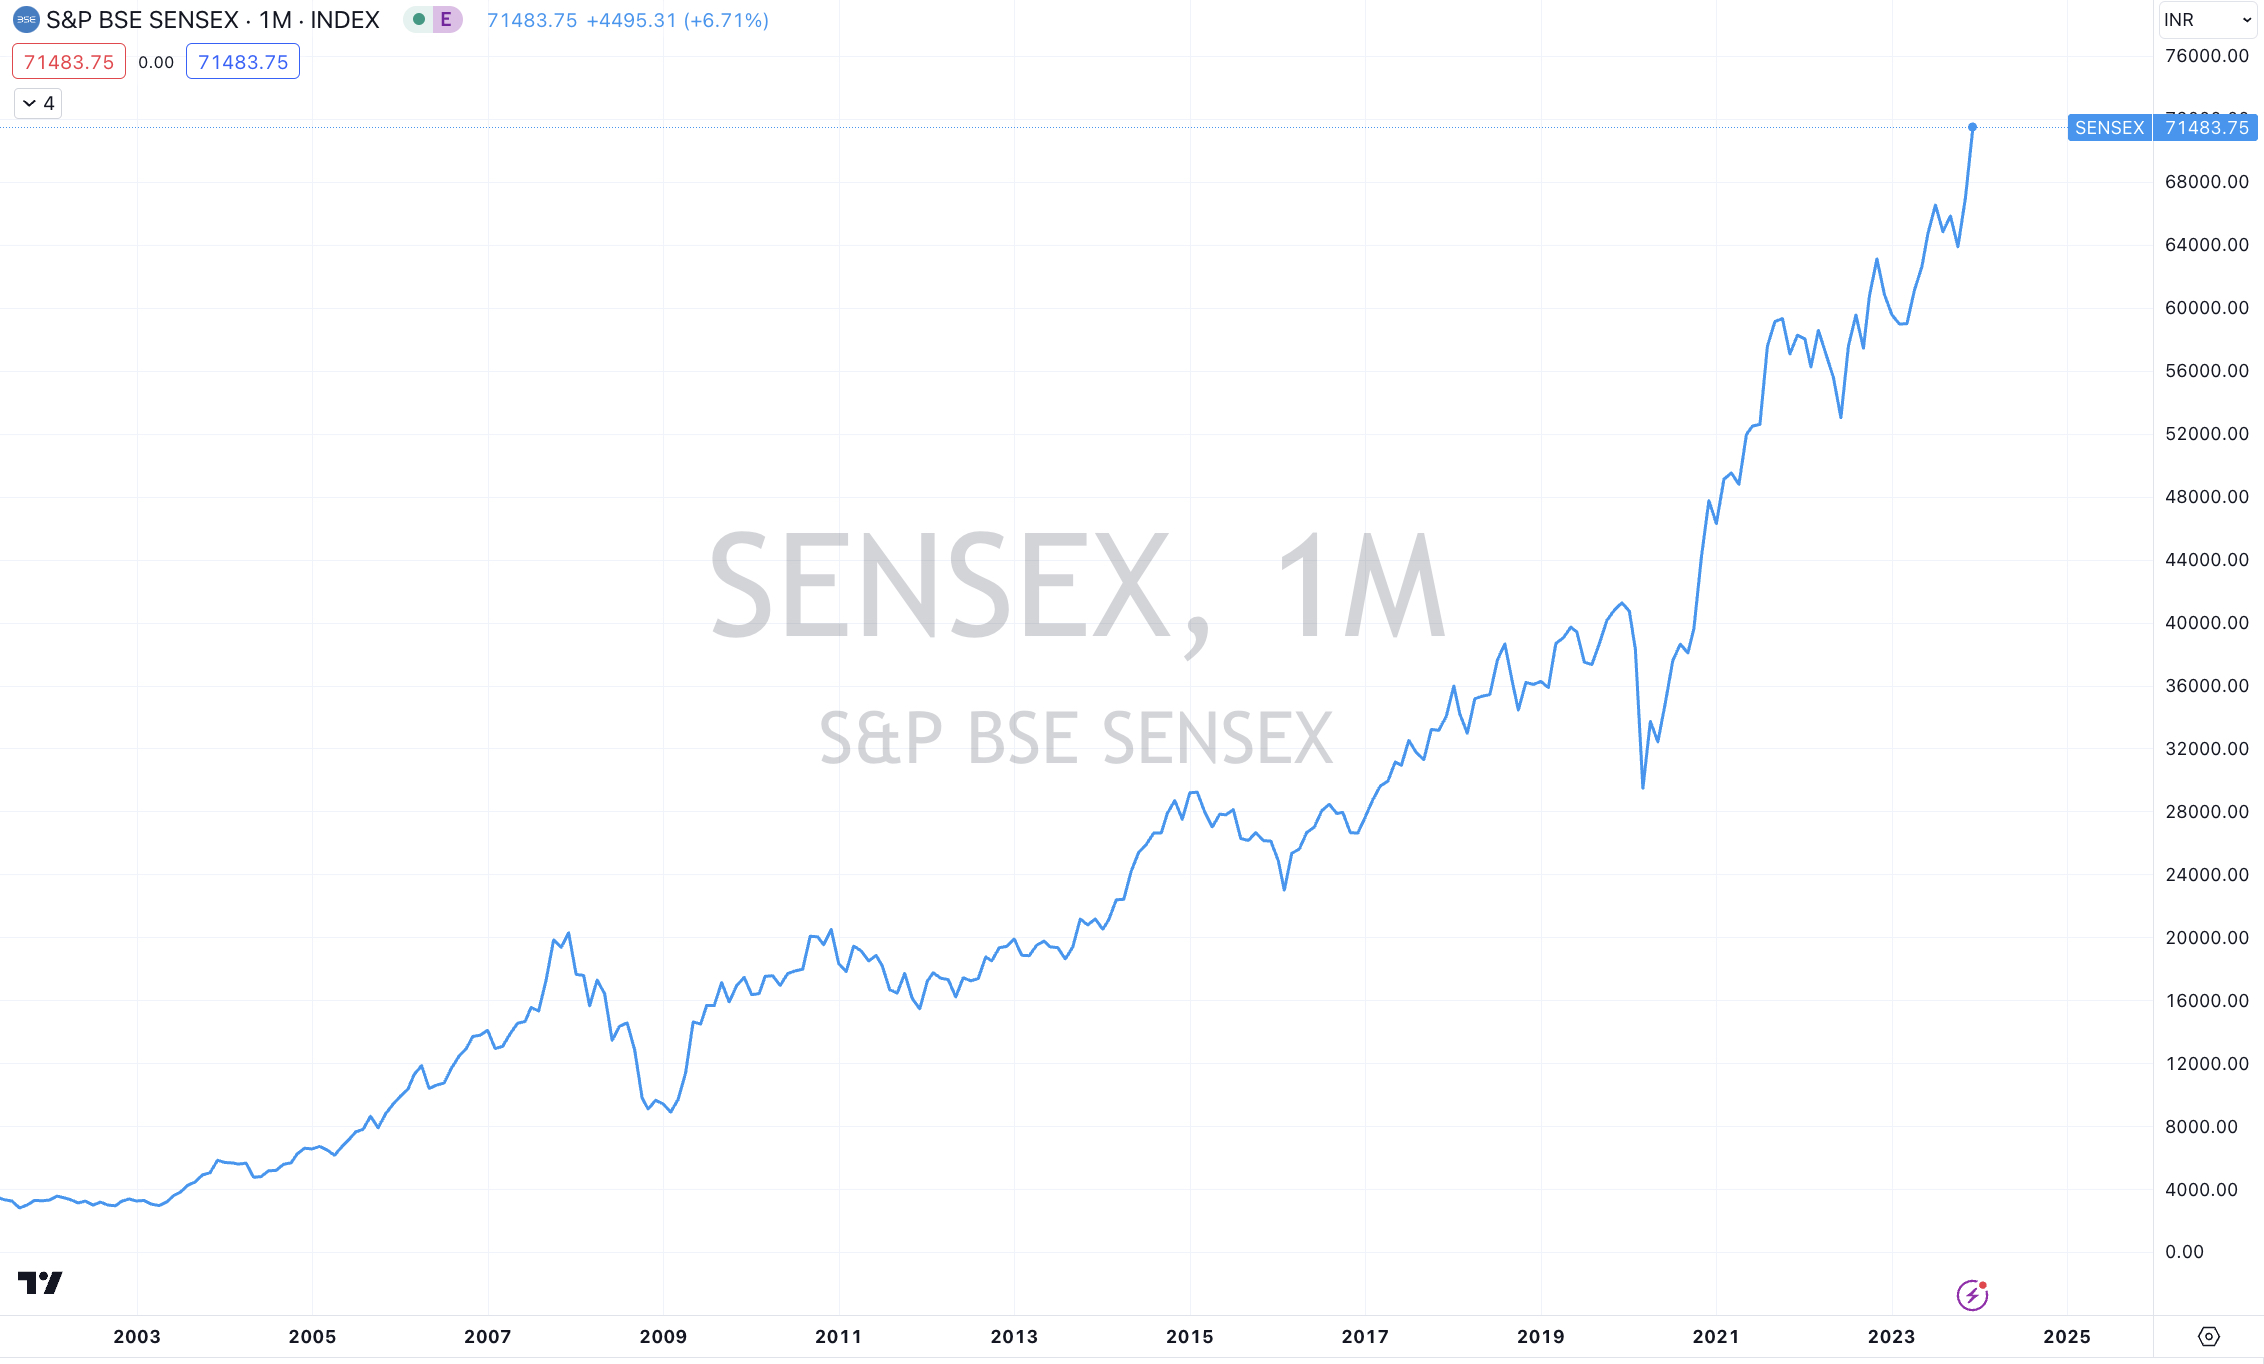
India’s NIFTY and SENSEX equity indices
And the Philadelphia Semiconductor Index (SOX)
Extremes “below” the Mean (at least 2.5 standard deviations)
BoA 5-7 year corporate bond yields
German, U.S. and British 2 year government bond yields
British 3 year government bond yield
German, British and U.S. 5 year government bond yield
Canadian, Swiss, German, Spanish, French, South Korean, British, Portuguese and Swedish 10 year government bond yields
U.S. 5 year bond yield minus the 5 year break-even inflation yield rate
U.S. 5 year minus 3 month yield spread
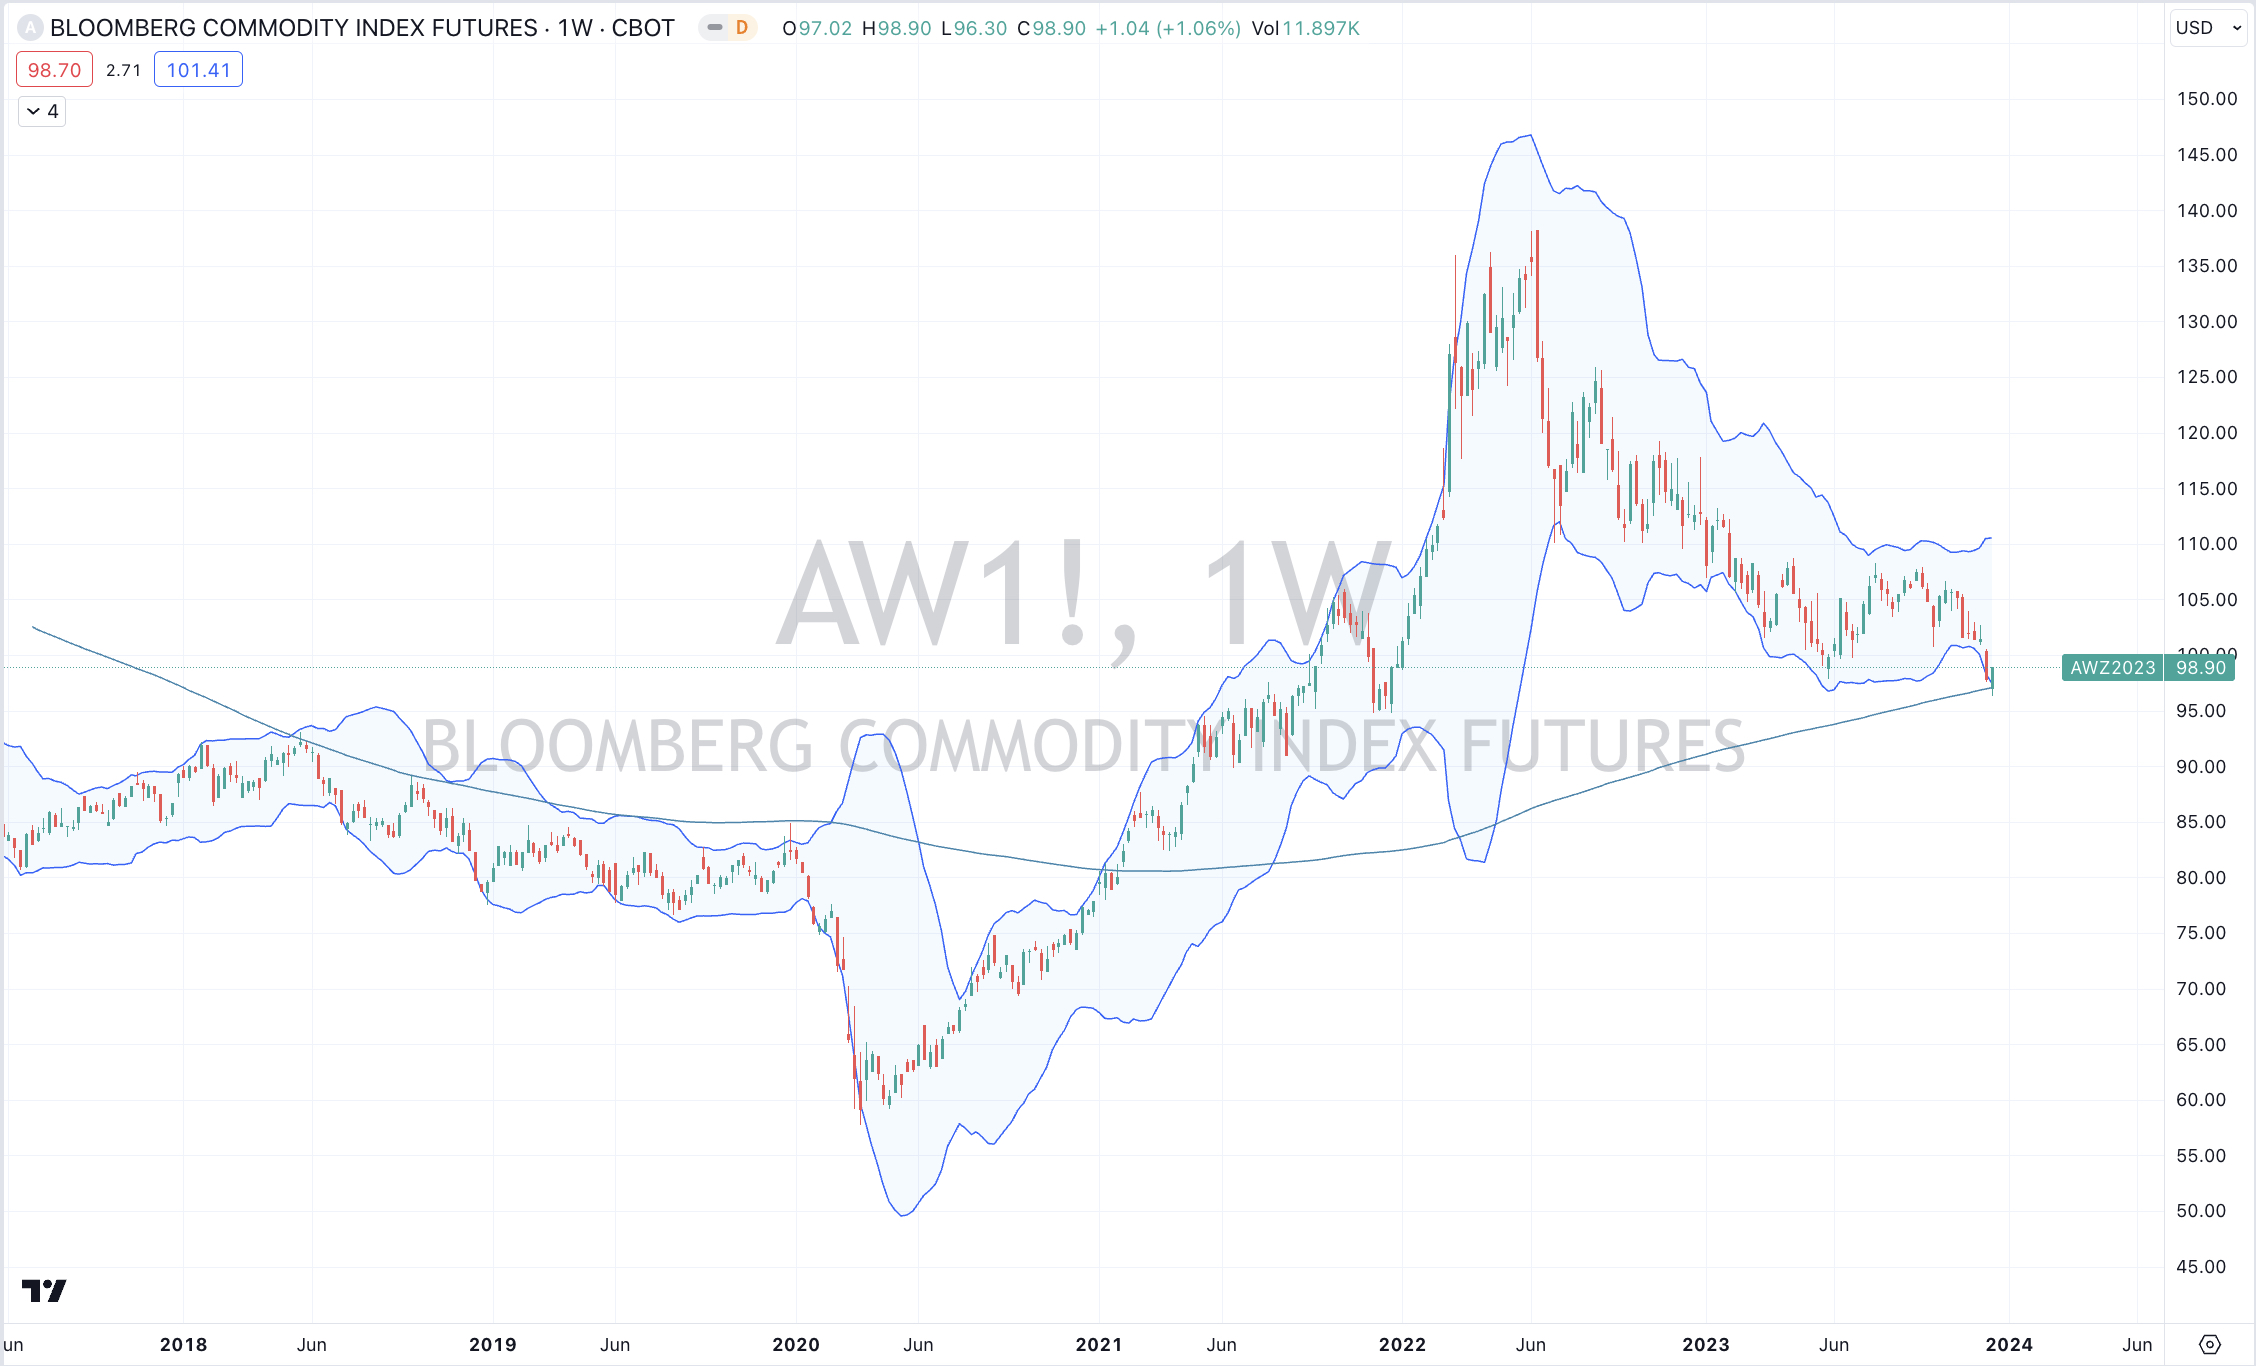
Bloomberg Commodity Index
S&P Goldman Sachs Commodity Index
Thomson Reuters CRB Index
Sugar
Natural Gas
Brent Crude Oil
GBP/JPY
USD/JPY
USD/SGD
USD/ZAR
And Russia’s MOEX Index
Oversold (RSI < 30)
Chilean 2 year government bond yield
Lithium Hydroxide
CSI 300 Index
The Oversold Quinella – Both Oversold and Traded at < 2.5 standard deviations below the weekly mean)
JKM LNG
Greek 10 yer government bond yields
Notes & Ideas:
Government bond yields again fell everywhere, again.
And so I emphasis and reflect on the euphoria of weeks ago when the consensus couldn’t possibly allow any probability that interest rates could decline.
For example, 8 weeks ago, the U.S. 5 yer bond yield appeared in this publication as an overbought extreme when it was trading at 5%. Today, that yield is 3.91%. Someone has lost a lot of money ‘shorting’ the hype at the wrong end of the pendulum.
Aussie 10 year yields have fallen 6 of the past 7 weeks as have the New Zealand 10’s and the U.S. 20’s.
The Swiss 10’s have mean reverted.
n.b. maybe its time to lock-ion cheap Swiss borrowing rates soon?
The South Korean 10’s are are in a 8 week losing streak.
And the IEI ETF has posted a 4% capital gain over the past 8 weeks.
Of course, that wouldn’t be good enough anymore, especially when equities have rose 15% over the same time……????
The TLT (20+ year) ETF stock price has risen 18.2% over the past 9 weeks. Prior to this advance, that ETF appeared as an ‘oversold extreme’.
The BoA 5-7 year corporate bond yield is hovering at the same yield as May 2023.
The Canadian 10’s and British 10’s yields at their lowest level since May 2023, British 10’s are back to May 2022 levels and German 10’s are at their lowest since December 2022.
Equities were mostly higher for the week extending most gains from the preceding 3 weeks.
Some of the weekly gains were impressive.
Inversely, most of Europe’s equity indices finished the week either +/- 0.3% from last week’s close.
Spain’s IBEX fell and so it’s not an ‘overbought extreme’. Other new entrants have entered that category this week.
The Nasdaq 100 being one of them.
Most indices end the week with return of between 1% – 1.6%.
The week that U.S. Banks ’twas larger than the previous week.
The KRE Regional Banks Index rose 8% for the week and has soared 31% over the past 7 weeks. The market has forgotten about Silicon Valley Bank collapse and all of this analyses about various banks “held to maturity” debt investments…..
It’s now 2.5 standard deviations above its rolling weekly mean.
Chinese indices were mostly lower again, although a couple of them posted gains of 2% for the week.
The Hang Seng had a bullish outside reversal week as did Malaysia’s KLSE Index.
The CSI 300 is now at the same price as seen in February 11, 2019 while also being in a 5 week losing streak.
The China A50 Index is in a 6 week losing streak and is nearly oversold.
Germany’s DAX is at an all-time high but not yet overbought. Comically, it broke its 6 week winning streak by feebly posting a decline of 0.1% for the week.
The CAC and BOVESPA are also at all-time highs.
The Dow Jones Industrials is a whisker from an overbought quinella.
The S&P MidCap 400 makes it 5 straight winning weeks.
The following indices have risen for 7 consecutive weeks; AEX, DJ Industrials, Nasdaq Composite and Nasdaq 100, KOSPI, NIFTY, Sensex, Copenhagen and the S&P 500.
The S&P Small Cap 600 was strong but it yet to make a ‘higher high’ but the Russell 2000 did so.
India’s SENSEX seems to be amongst the most extended of bourses, as it trades at 34% above its 200 week moving average.
While all are watching the Nasdaq, Sweden’s OMX Stockholm Index has climbed 17% over the past 17 weeks.
And Mexico’s IPC Index surged 5% to extend its weekly winning streak to 8 as it registers an overbought quinella. Since appearing in the overbought section of this publication, this index has risen 18% during this streak, outperforming the Nasdaq 100 by 4% over that time…..
Commodities were mixed.
Palladium soared 26%. It’s not oversold anymore.
Livestock, Uranium, Aluminium and Coffee were firmer.
Coal, Urea, Gas and Sugar prices were lower.
Grains were muted.
The Baltic Dry Index, Gold and Silver fell out of overbought territory this past week.
Cattle prices momentarily rose, thus removing them from an oversold extreme.
Following a 6 week losing streak (accounting for a cumulative 21% decline), Sugar is now in an oversold trough.
Aluminium had an outside bullish reversal week.
The Bloomberg Commodity Index mean reverted, to its 200 week moving average.
Cocoa broke its 8 week rising streak, yet remains overbought for 8 consecutive weeks.
Newcastle Coal gave up 7% of its previous fortnight gain of 18%.
China Coking Coal has built a 5 week winning streak.
Both WTI and Brent Crude broke their 7 week losing streak rising 0.3% and 1.3% respectively.
Although, Brent Crude is in its 2nd week of an oversold extreme.
Dutch TTF Gas tanked 14% and has now fallen 46% over the past 7 weeks.
Natural Gas fell 3.5% for the week even though it rose 4% during Friday’s session.
Natural Gas has slumped 34% during its 6 week losing streak.
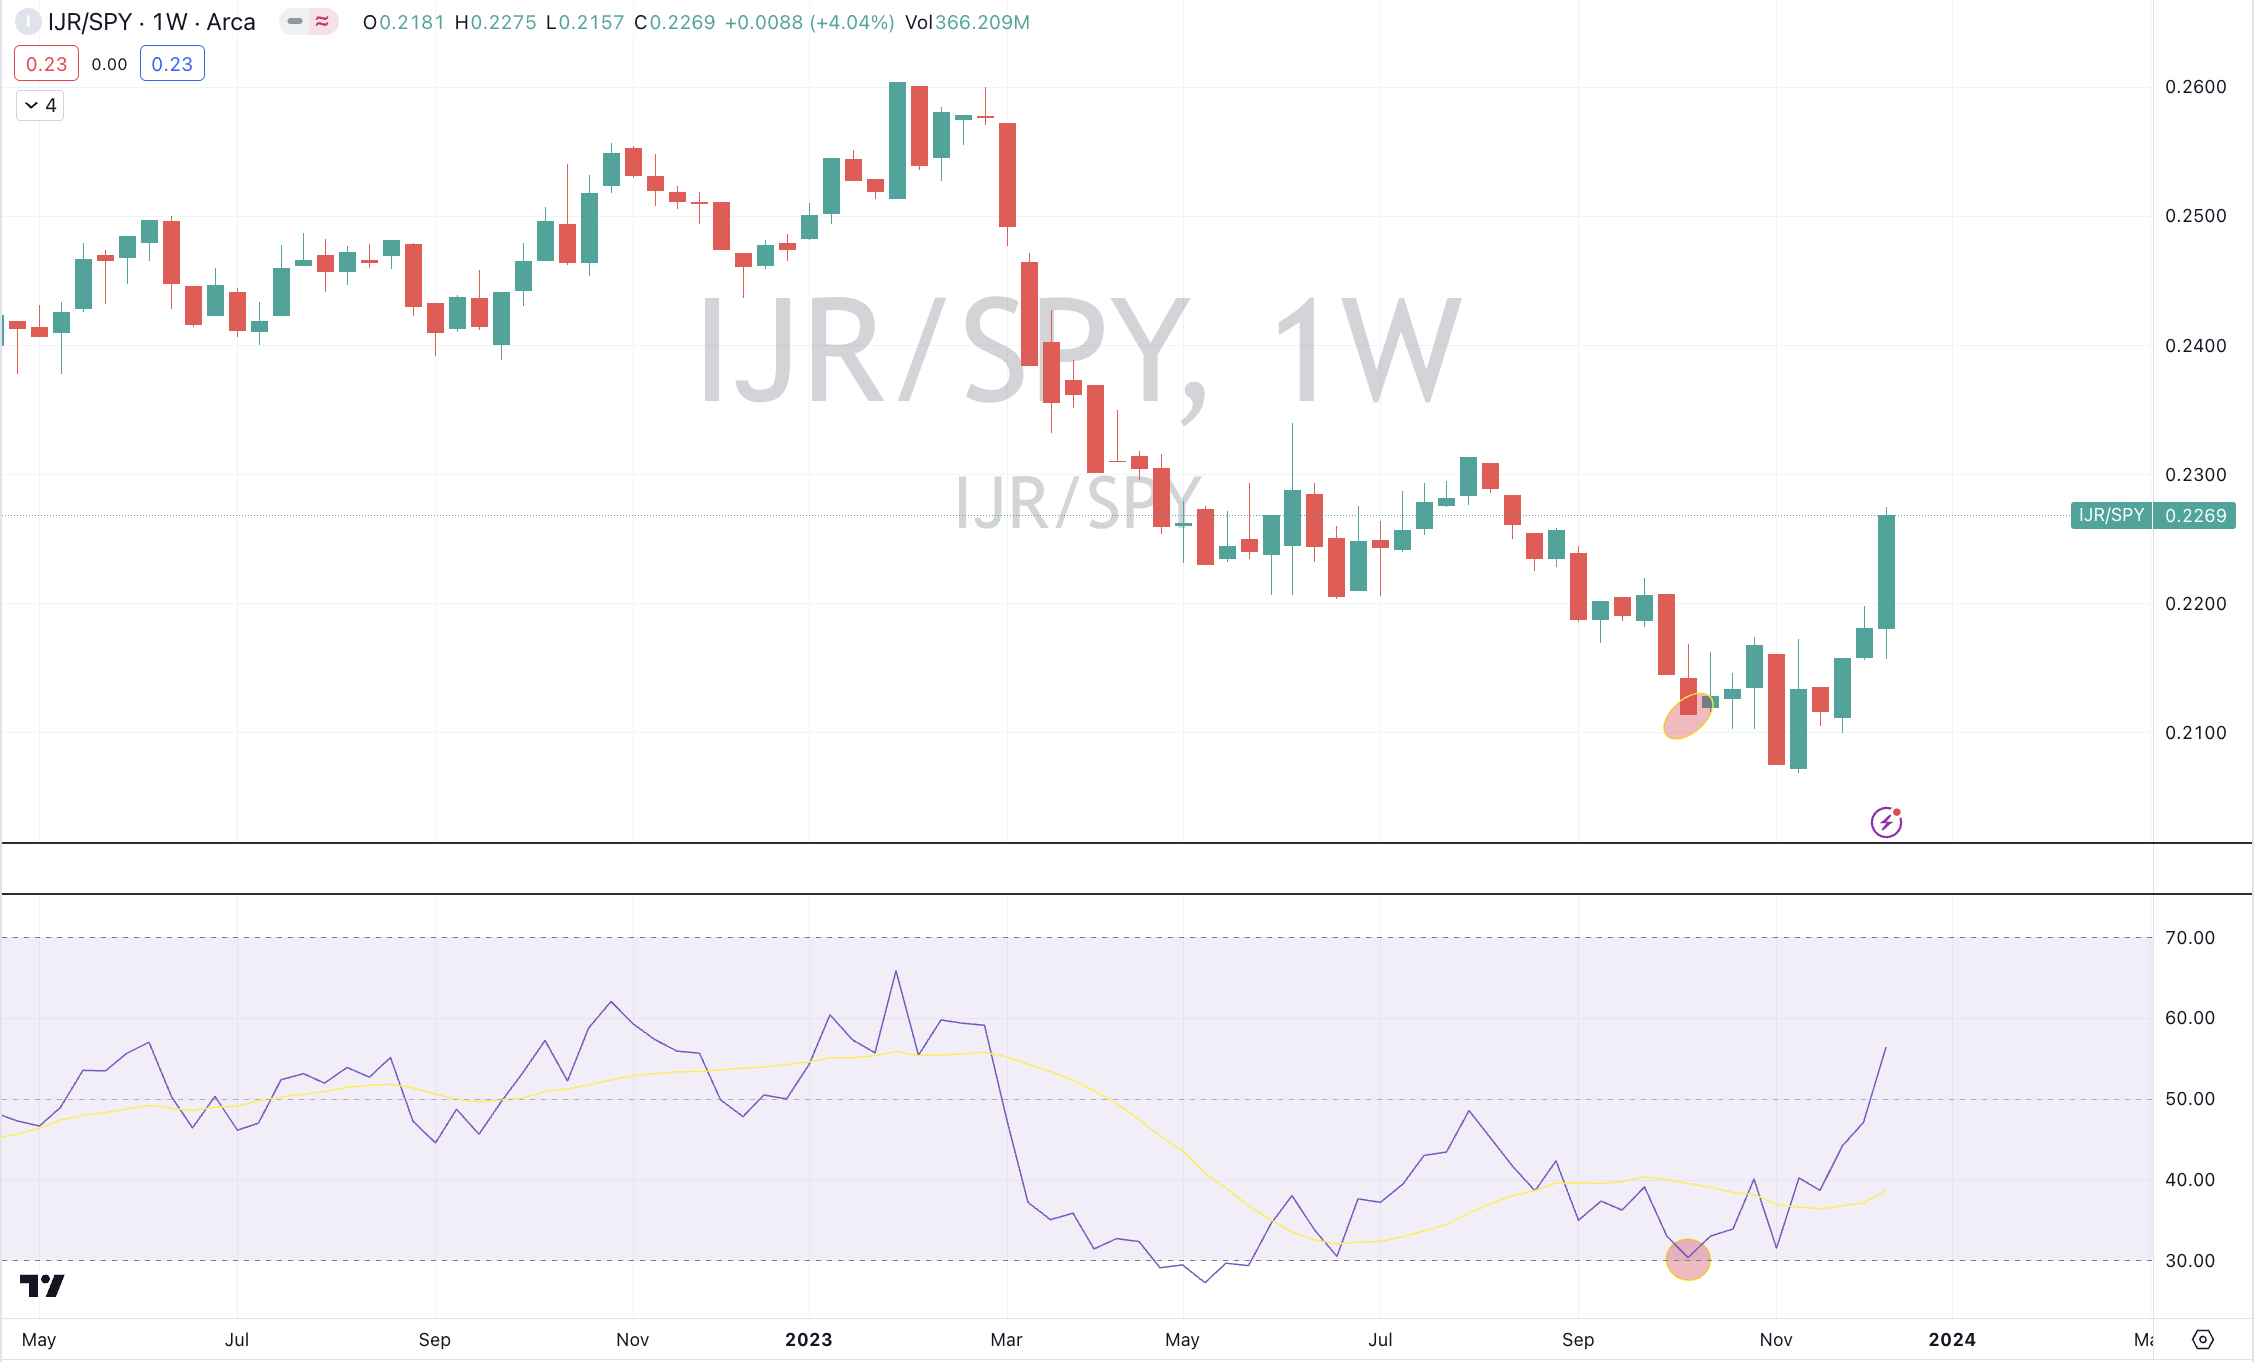
For a 2nd week, the broader commodity indices remain at oversold extremes.
And relatively versus equities they are too.
Non U.S. denominated Gold prices eased for a 2nd week, while Silver caught a bid following last week’s 10% shellacking.
Orange Juice is in a 4 week losing streak and is trading at 108% above its 200 week moving average.
Uranium remains overbought for a 18th consecutive week.
Lithium Hydroxide prices are now oversold for 23 consecutive weeks.
JKM LNG has fallen 7 of the past 8 weeks, declining 24% over that time.
And Iron Ore isn’t overbought anymore.
Amongst currencies, the Australian Dollar was firmer, resuming the advances of previous weeks.
The Loonie was higher again, the Euro was mixed again and the Yen was stronger again.
Collectively, the U.S. Dollar was weaker most everywhere.
In fact, against the USD, the Yen is in a 5 week winning streak.
Lastly, the USD/ZAR had a bearish outside reverse week.
The larger advancers over the past week comprised of;
Aluminium 4.7%, China Coking Coal 3%, Lean Hogs 4.4%, Copper 1.6%, Heating Oil 1.5%, Coffee 6.9%, Lumber 1.8%, Cattle 1.7%, Nickel 1.8%, Palladium 26.4%, Platinum 3.6%, Gasoline 4.1%, Gasoil 2.1%, Uranium 4.8%, Silver AUD 1.8%, Silver USD 3.7%, Oats 5.6%, KBW Banks 8.1%, DJ Industrials 2.9%, Dj Transports 5.3%, HSCEI 1.8%, HSI 2.8%, BOVESPA 2.4%, S&P Small Cap 600 5.8%, Russell 2000 5.6%, Nasdaq Composite 2.9%, KRE Regional Banks 8.1%, KOSPI 1.8%, FTSE 250 2.7%, S&P Midcap 400 4%, Nasdaq Biotech 6.1%, Nasdaq 100 3.4%, Nikkei 225 2.1%, NIFTY 2.3%, S&P Midcap 600 (not 400) 5.1%, Stockholm 3.2%, SENSEX 2.4%, Chile 3.2%, S&P 500 2.5%, TAIEX 1.7%, Nasdaq Transports 4.9%, ASX 200 3.4%, ASX Materials 4%, ASX Industrials 2.5%, ASX Small Caps 3.2% and the SOX soared 9.1%.
The group of decliners included;
Rotterdam Coal (4.8%), Baltic Dry Index (2.9%), Cotton (1.9%), DXY (2%), JKM LNG (10.2%), Lithium (1.9%), Newcastle Coal (7.1%), Natural Gas (3.5%), Sugar (5.9%), Dutch TTF Gas (14%), Urea U.S. Gulf (3.2%), Urea Middle East (2.6%), Shanghai Composite (0.9%), CSI 300 (1.7%) and Spain’s IBEX fell 1.3%.
December 17, 2023
by Rob Zdravevski
rob@karriasset.com.au