A weekly Macro, Cross Asset review of prices trading at extremes which may generate future investment ideas and opportunities.
The following assets (on a weekly timeframe) either registered an Overbought or Oversold reading and/or have traded more than 2.5 standard deviations above or below its rolling mean.
n.b. pricing of (commodity) futures contracts is only considering the immediate front month.
* denotes multiple week inclusion
Extremes above the Mean (at least 2.5 standard deviations)
IEF, IEI & SHY ETF’s
Sugar #16
EUR/GBP
EUR/USD
NZD/AUD
PHP/USD
Overbought (RSI > 70)
Australian government 10 year bond yield minus the Aust. 2 year bond yield spread
BofA High Yield Index
Tin
Urea (U.S. Gulf)
Gold in CAD and USD
Pakistan’s KSE Index *
And Chile’s IGPA Indices *
The Overbought Quinella (Both Overbought and Traded at > 2.5 standard deviations above the weekly mean)
BofA BB High Yield Option Adjusted Spread
U.S. 10 year minus U.S. 5 year bond yield spread
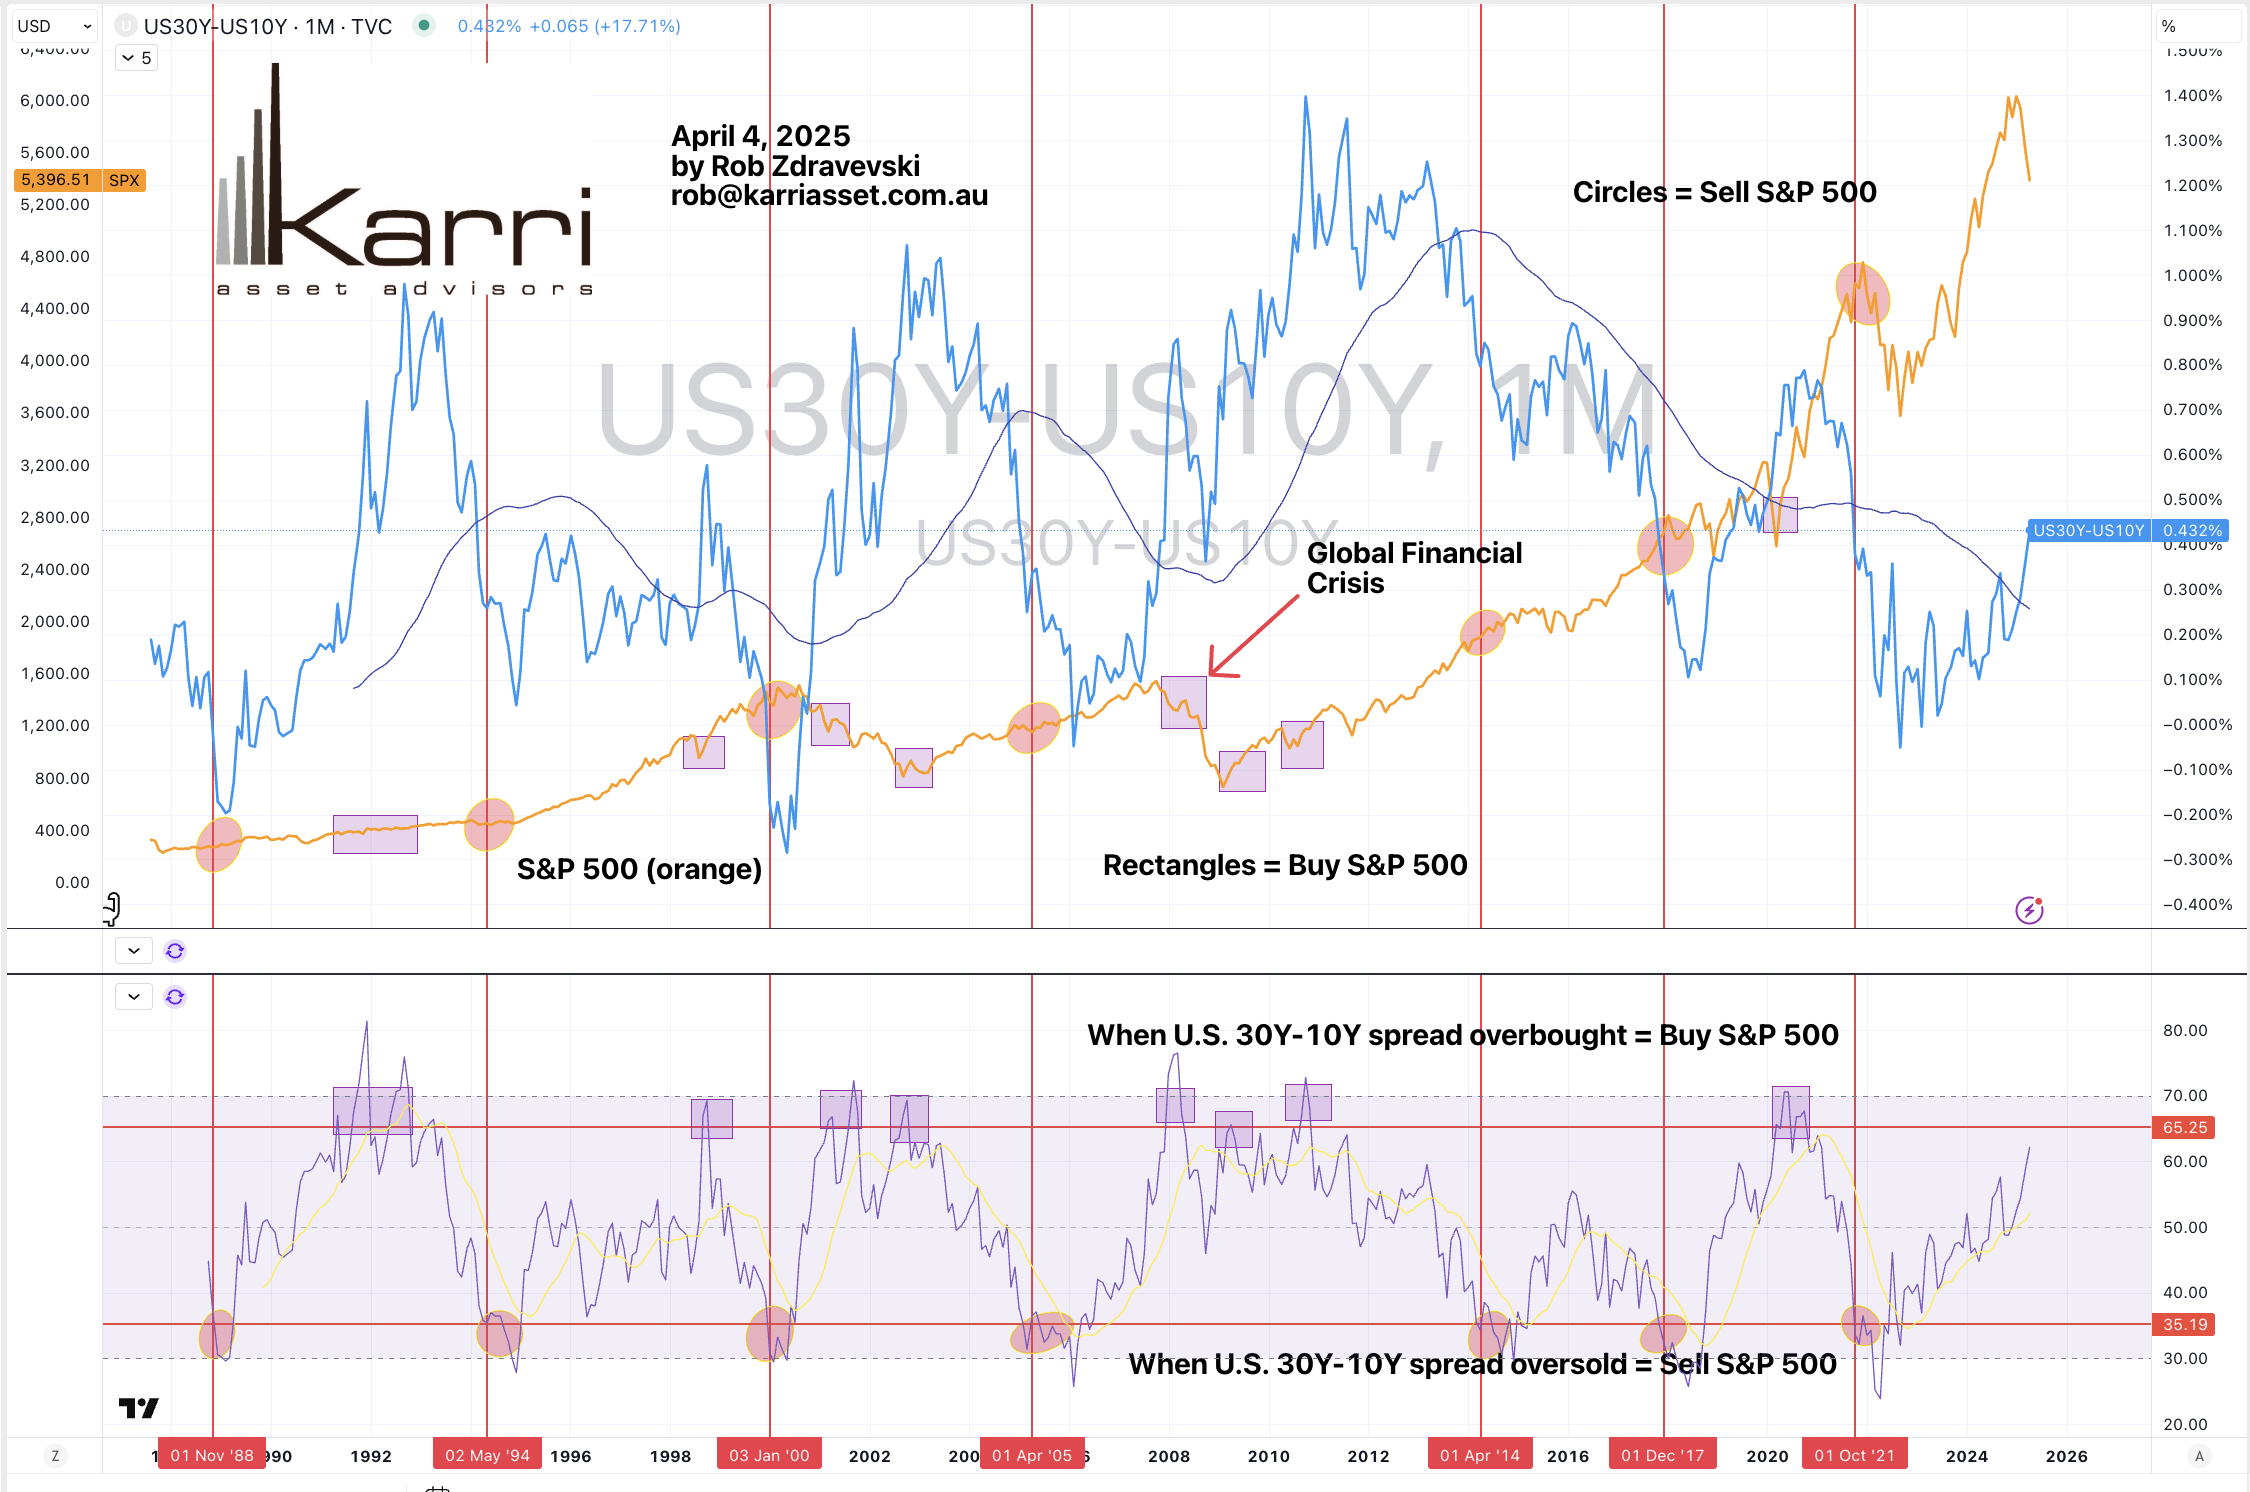
U.S. 30 year minus U.S. 10 year bond yield spread *
Gold in AUD and ZAR *
Extremes below the Mean (at least 2.5 standard deviations)
Australian 2, 3, 5 & 10 year bond yields
German and Italian 2 year bond yields
New Zealand & Polish 10 year bond yields
U.S. 10 year break-even inflation rate
TBX
U.S. 3, 5, 7 and 10 year bond yields
U.S. 5 year bond yield minus the U.S. 5 year break-even inflation rate
U.S. 5 year bond yield minus the U.S. 3 month bill yield
U.S. 5 year bond yield minus U.S.inflation rate
U.S. 10 year bond yield minus the Australian 10 year bond yield
U.S. 10 year bond yield minus the U.S. 10 year break-even inflation rate
U.S. 10 year bond yield minus the U.S. 10 year inflation rate
Aluminium
Brent and WTI Crude Oil
Cotton
U.S. (DXY) Dollar Index
Iron Ore
Gasoline
S&P GSCI
USD/CHF
USD/DKK
USD/SEK
Amsterdam’s AEX
KBW Bank Index
Dow Jones Industrials
Taiwan’s TAEIX Index *
KRE Regional Banks Index
Nikkei 225
Toronto’s TSX
Vietnam
ASX Materials
And ASX Small Caps
Oversold (RSI < 30)
U.S. 3 month government bill yield *
U.S. 10 year bond yield minus the German 10 year bond yield spread
Australian Coking Coal *
Richards Bay Coal *
North European Hot Rolled Coil Steel *
Lithium Carbonate *
Lithium Hydroxide *
Newcastle Coal *
Orange Juice *
Uranium *
AUD/INR
AUD/USD
CAD/CHF
Indonesia’s IDX
Nasdaq Transports
And Thailand’s SET Index *
The Oversold Quinella (Both Oversold and Traded at < 2.5 standard deviations below the weekly mean)
Indian 10 year government bond yield *
U.S. 2 year bond yield
AUD/CAD
AUD/EUR
AUD/CHF
AUD/SGD
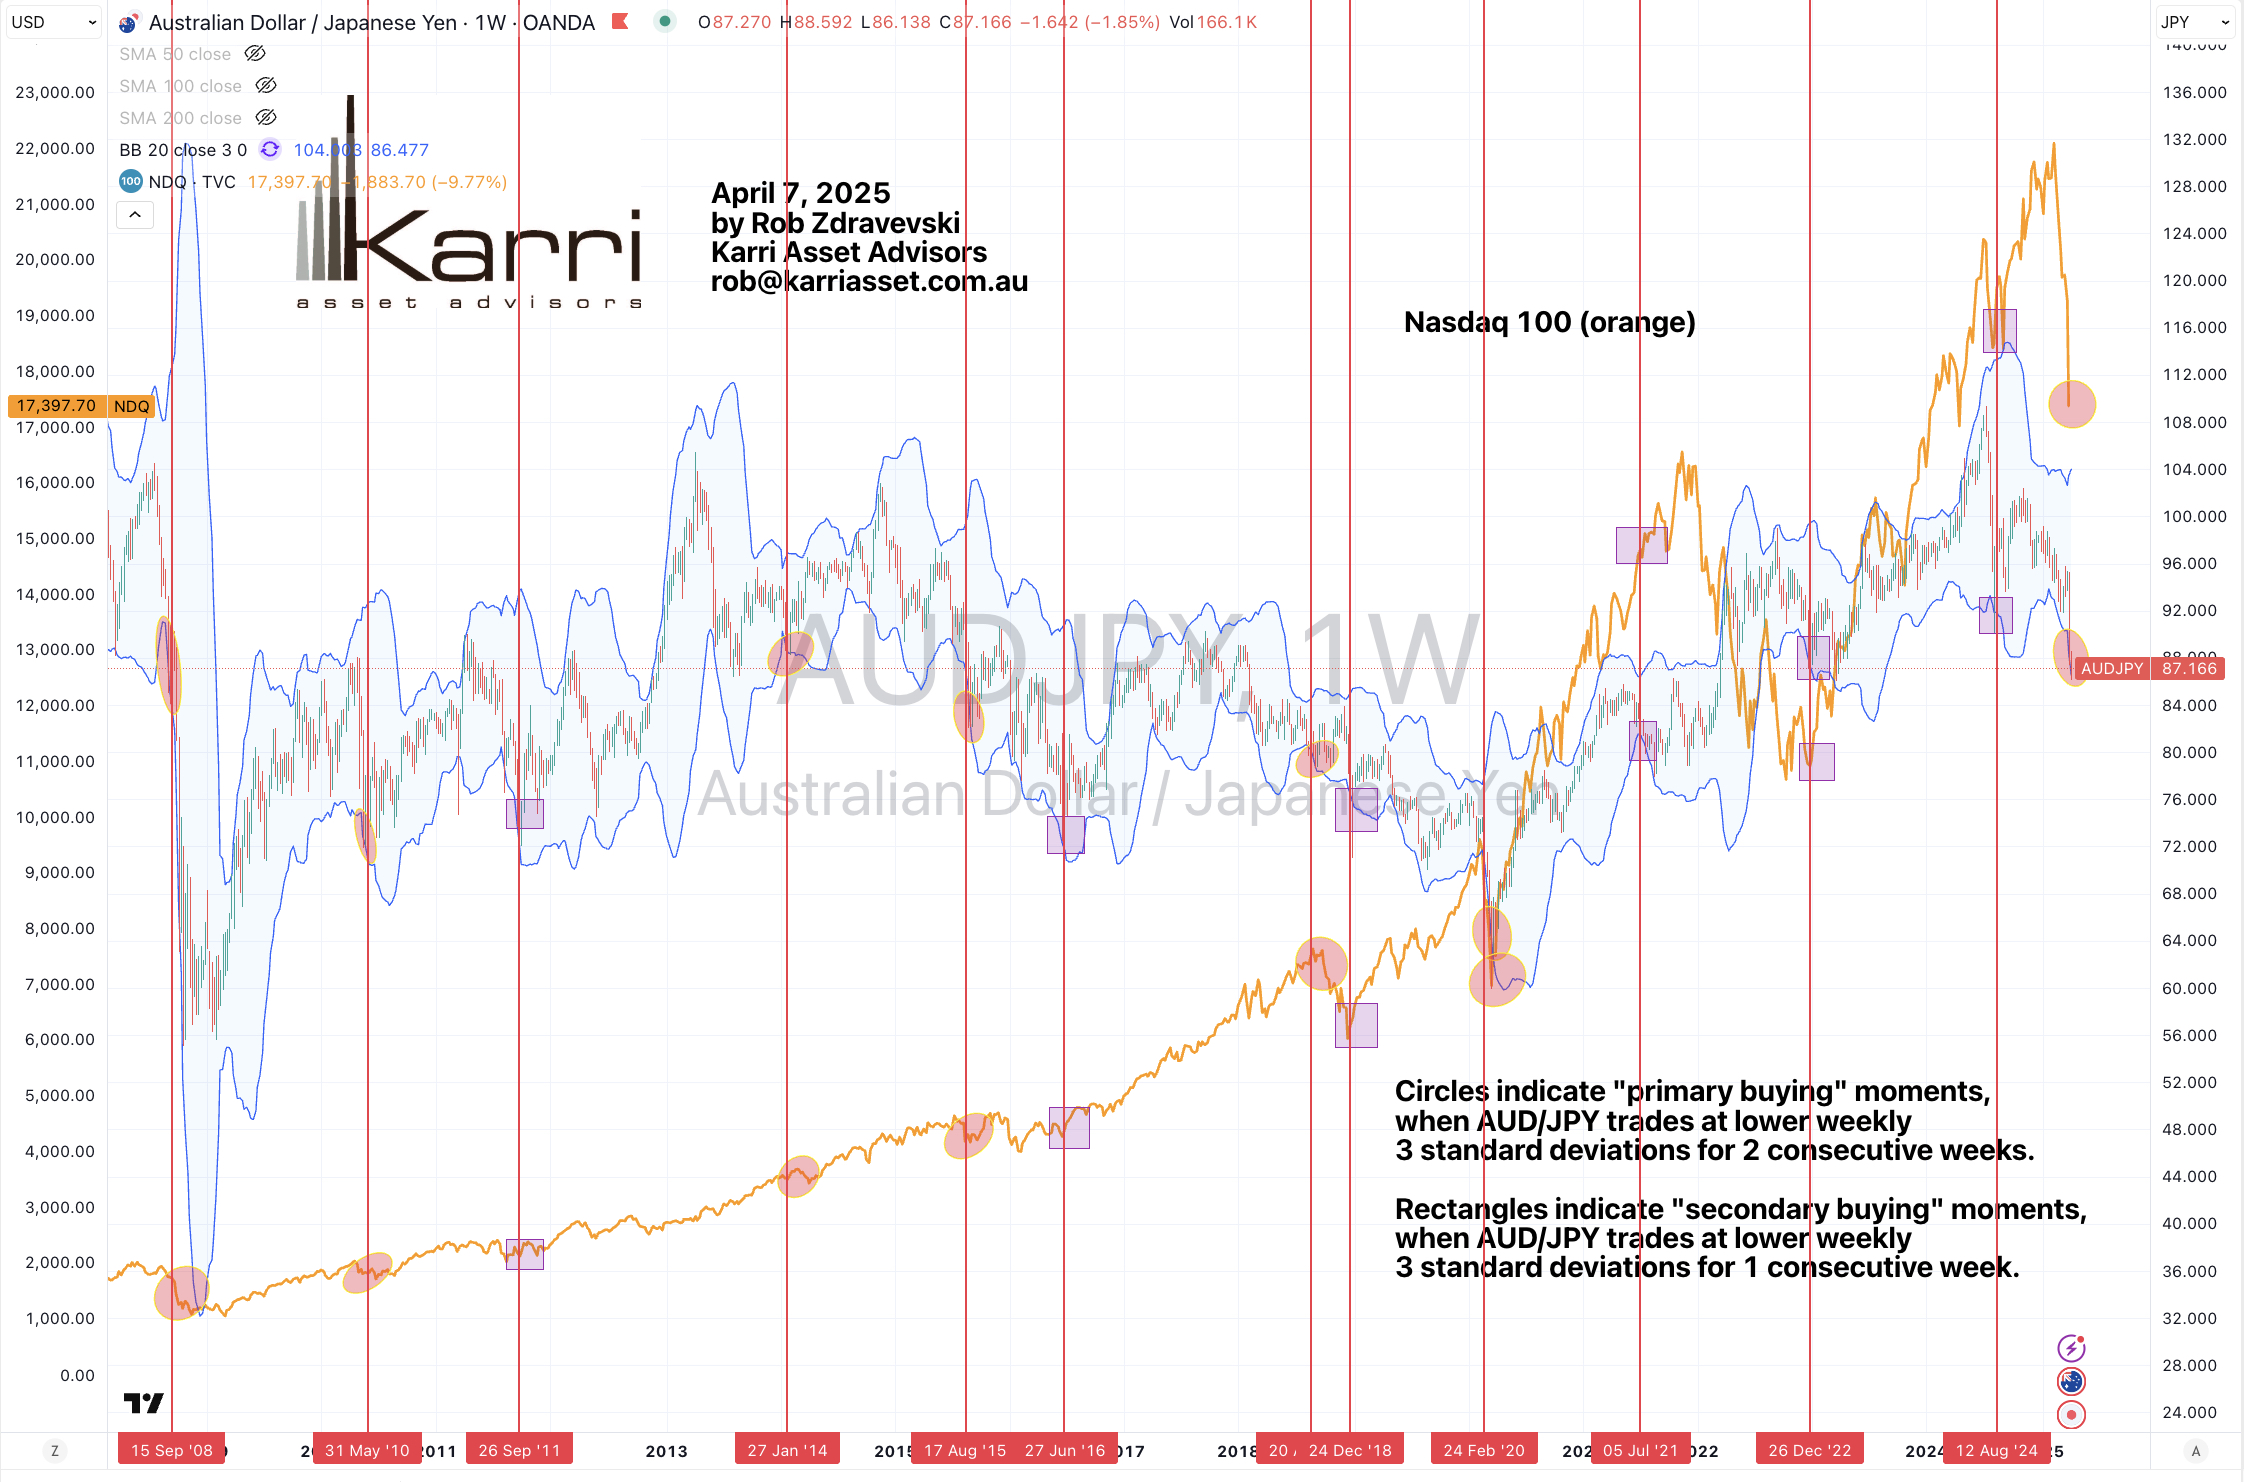
AUD/JPY
AUD/GBP
Dow Jones Transports
S&P Small Cap 600
Russell 2000
FTSE 250
S&P MidCap 400
Nasdaq Biotech Index
Copenhagen
Stockholm
Nasdaq Composite
Philadelphia Semiconductor (SOX) Index
S&P 500
Nasdaq Transports
And the IBB and XBI Biotech ETF’s
Notes & Ideas:
Government bond yields fell.
Any yields which were overbought last week are no longer so.
In this week’s overbought category you’ll find term spreads and high yield bond indices appearing.
The oversold category is full of shorter duration yields, cross country yield spreads and real interest rate spreads.
Austrian and Spanish 10’s are in a 4 week losing streak,
As are Aussie 2, 3 and 5 year yields along with German 2’d and 5’s.
U.S. 2 year bond yield mean reverted.
The U.S. 30 year minus U.S. 10 year yield spread has risen for 8 consecutive weeks.
This includes the whole Japanese curve which tanked this week. Leveraged shorter’s most likely became bankrupt. The widow maker is back.
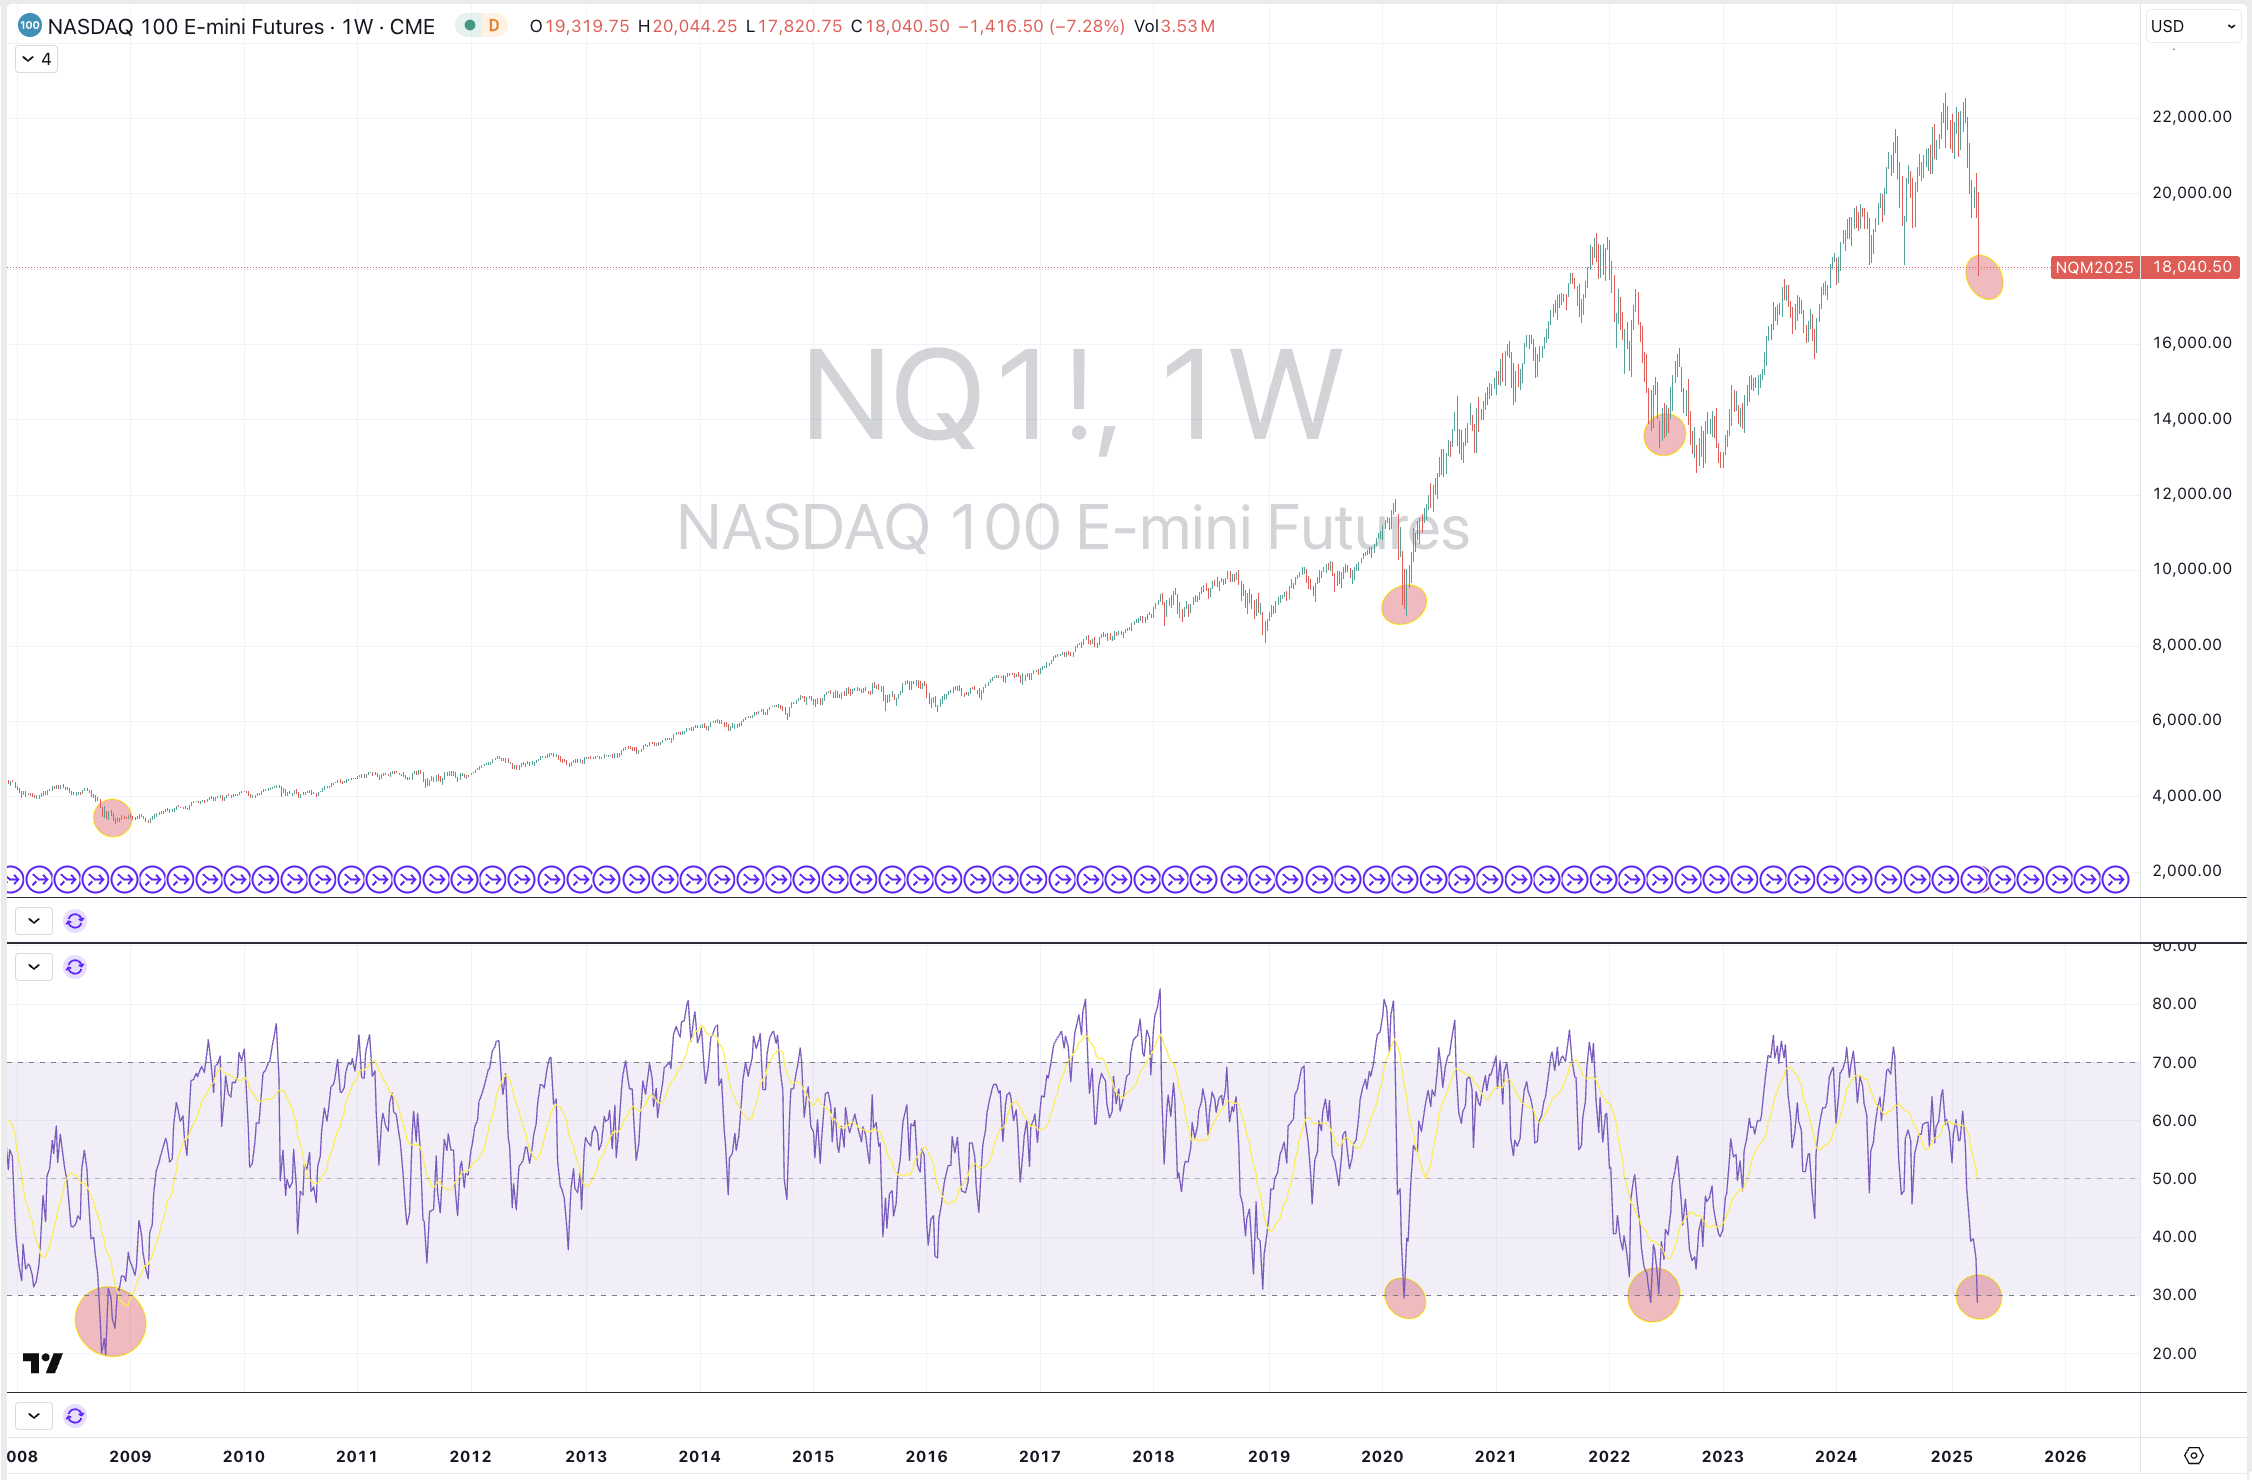
Equities were decisively weaker, again.
This week features a very longest of equity indices trading at oversold extremes.
There were also many indices which mean reverted.
For the 2nd week in a row, Chinese stocks weathered the storm.
The DAX, Hang Seng, Stockholm and Helsinki have fallen for 4 weeks straight.
Copenhagen is in a 5 week losing streak.
The Nasdaq Biotech have fallen for 6 weeks.
DJ Transports, the FTSE 250 and the SOX have also declined for 7 consecutive weeks.
The Nasdaq Composite has retreated for 6 of the past 7 weeks.
The S&P 500 has sunken for 6 of the past 7 weeks.
The S&P Small Cap 600, S&P MidCap 400 and the Russell 2000 have fallen 9 of the past 10 weeks.
The KRE Regionals Banks Index is back to the same price seen in July 2024.
Commodities were weaker.
The indices were mainly affected by the slump in oil prices.
Thus we see Crude and Gasoline at oversold extremes.
Some winners included Urea, Tin, Cocoa and Steel prices.
A couple of them made into overbought territory.
Coking Coal prices are working their way from being oversold for some time.
Orange Juice mean reverted.
Tin has risen 19% over the past 5 weeks.
Copper prices tanked.
Australian Coking Coal broke its 4 week losing streak.
Gold as priced in AUD have risen for 5 consecutive weeks.
while Lithium Hydroxide has been oversold territory for 96 consecutive weeks.
Currencies were woken from slumber and very active.
The simplest observation was risk was ‘off’.
That means the Aussie and Loonie were dumped and the Yen and Swiss were bought.
The world does this when its worried and risk averse.
The Australian Dollar fell 4% (or more) against every currency pair.
Perversely, the Loonie has risen for 5 straight weeks against the USD.
Both ‘risk’ currencies (AUD & CAD) rose against the Yen.
And the GBP/JPY broke its 5 week rising streak.
The larger advancers over the past week comprised of;
Australian Coking Coal 2%, Cocoa 5.8%, U.S. Hot Rolled Coiled Steel 4.7%, Tin 7.5%, Sugar #16 7.4%, Urea U.S. Gulf 6.1%, Urea Middle East 4.1%, Gold in AUD 2.5% and Gold in ZAR rose 2.1%.
The group of largest decliners from the week included;
Richards Bay Coal (3.4%), Aluminium (10.2.%), Bloomberg Commodity Index (5.8%), Baltic Dry Index (7.1%), Brent Crude (9.2%), WTI Crude Oil (10.6%), Cotton (5.3%), Copper (14.2%), Heating Oil (6.6%), Arabica Coffee (3.8%), Lumber (13%), Cattle (3.3%), JKM LNG in Yen (6.7%), Lithium Carbonate (6.7%), Lithium Hydroxide (5.7%), Newcastle Coal (8%), Natural Gas (5.6%), Nickel (10.2%), Orange Juice (4.4%), Palladium (7.8%), Platinum (8.2%), Gasoline (8.4%), Robusta Coffee (4.2%), S&P GSCI (6.8%), CRB Index (6%), Dutch TTF Gas (10.8%), Gasoil (8%), Silver in AUD (9.8%), Silver in USD (13.3%), Gold in CAD (2.2%), Gold in CHF (3.8%), Gold in EUR (2.7%), Gold in USD (1.5%), Oats (2.1%), Rice (3.3%), Soybeans (4.5%), All World Developed ex-USA (6.6%), AEX (7.3%), ATX (9.9%), KBW Bank Index (13.8%), BUX (9.2%), CAC (8.1%), ChinaA50 (5.1%), DAX (8.1%), DJ Industrials (7.8%), DJ Transports (9.8%), MIB (10.6%), HSCEI (2.2%), Hang Seng (2.5%), IBEX (6.7%), Bovespa (3.5%), IDX (7.3%), S&P SmallCap 600 (9%), Russell 2000 (9.6%), Nasdaq Composite (10%), KRE Regional Banks (12.7%), KOSPI (3.6%), FTSE 250 (7.6%), S&P MidCap 400 (9.1%), Mexico (3.2%), Nasdaq Biotech (9.8%), Nasdaq 100 (9.8%), Nikkei 225 (9%), NIFTY (2.6%), Oslo (7.8%), Copenhagen (10.9%), Helsinki (7.4%), Stockholm (10.1%), PX (7.9%), SA40 (8.9%), SENSEX (2.7%), SET (4.3%), SMI (9.3%), SOX (16%), IGPA (2.4%), S&P 500 (9.1%), IPSA (2.5%), STI (3.7%), Nasdaq Transports (9.8%), TSX (6.3%), FTSE 100 (7%), Vietnam (8.1%), WIG (9%), ASX Financials (2.8%), ASX 200 (3.9%), ASX Materials (7.1%), ASX Industrials (3.4%), ASX Smal Caps (6.4%), BIST (2.9%) and the XBI Biotech ETF fell 12.7%.
April 6, 2025
By Rob Zdravevski
rob@karriasset.com.au