Watch credit for your equities
April 4, 2025 Leave a comment
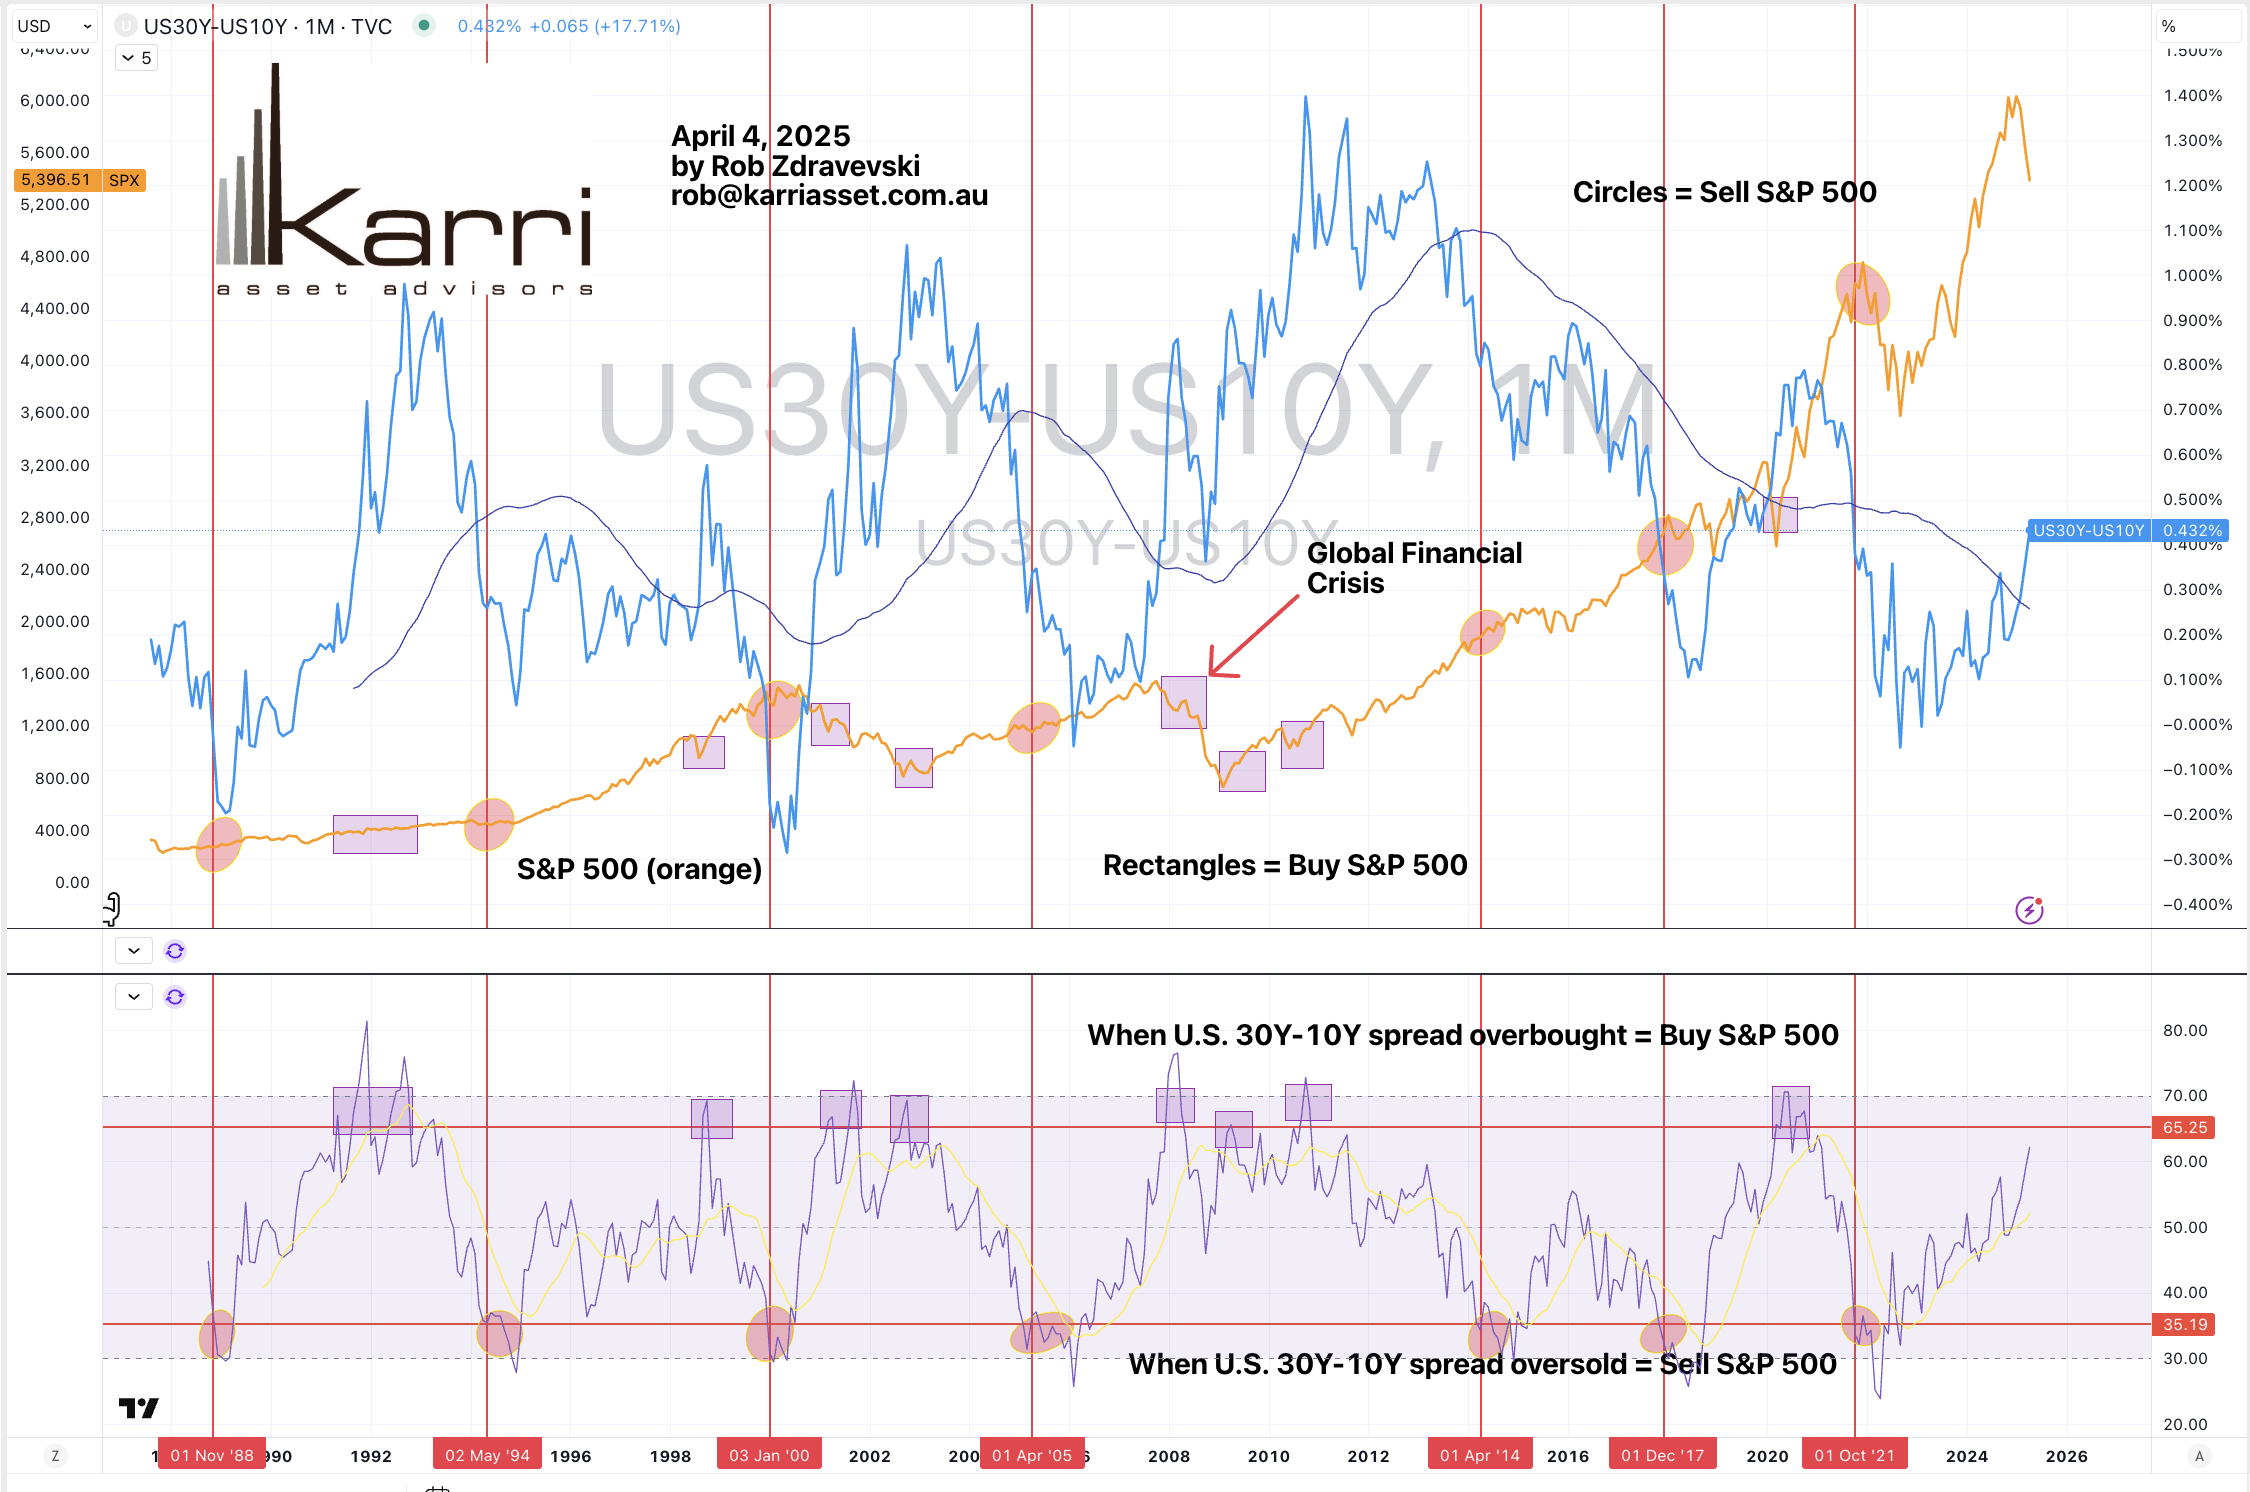
We’re closer to being ‘a buyer’.
The study below is a Monthly price chart of the U.S. 30 year bond yield minus the U.S. 10 year bond yield spread, over 35 years.
Follow the circles, rectangles and notes.
There are 6 times when to consider selling (lightening) the S&P 500
There are 9 moments when to buy/add/increase allocation to the S&P 500.
Credit doesn’t tell stories, Equities do !
April 4, 2025
rob@karriasset.com.au