Globally, 5% more rigs have been put to work since last month. An increase of 63 rigs and it’s being seen in the America’s with the Canadians becoming notably busier.
I’ll assume tar sands become more feasible with Crude at $75?
Wheat has retraced 78.6% of the advance from December 2020.
It’s nearly oversold, it may have a little further, down to the trend line at $6.10 but the ‘fat part’ of the short trade has been had.
On a weekly basis, other technicals suggest similar metrics, coincidences of touching a 50 Week Moving Average, reaching 2.5 standard deviations below its mean and other exhaustions.
Away from technicals, supply fundamentals seem favourable for higher prices again.
Corn prices have retraced an exact 50% of the rally which commenced in August 2020.
In the past few months, I have been writing about parabolic price moves and highlighting the risk of ‘going long’ at what seems the tail end of an advance which sometimes can resemble chasing a mania.
Albeit Corn is currently in a downtrend, my other indicators suggest that the strength of the decline is dubious. If Corn shoots below the 50% retracement mark, it should stop at the 50 Week Moving Average of $4.99.
That’s only a further 5.6%, following an already 28% decline from its $7.35 peak in mid-May.
Let’s not try and squeeze out the last kernel?
Perhaps it’s time to sell my equity holdings in Gruma (the tortilla and taco maker) and Kellogg. Their input prices may start rising again.
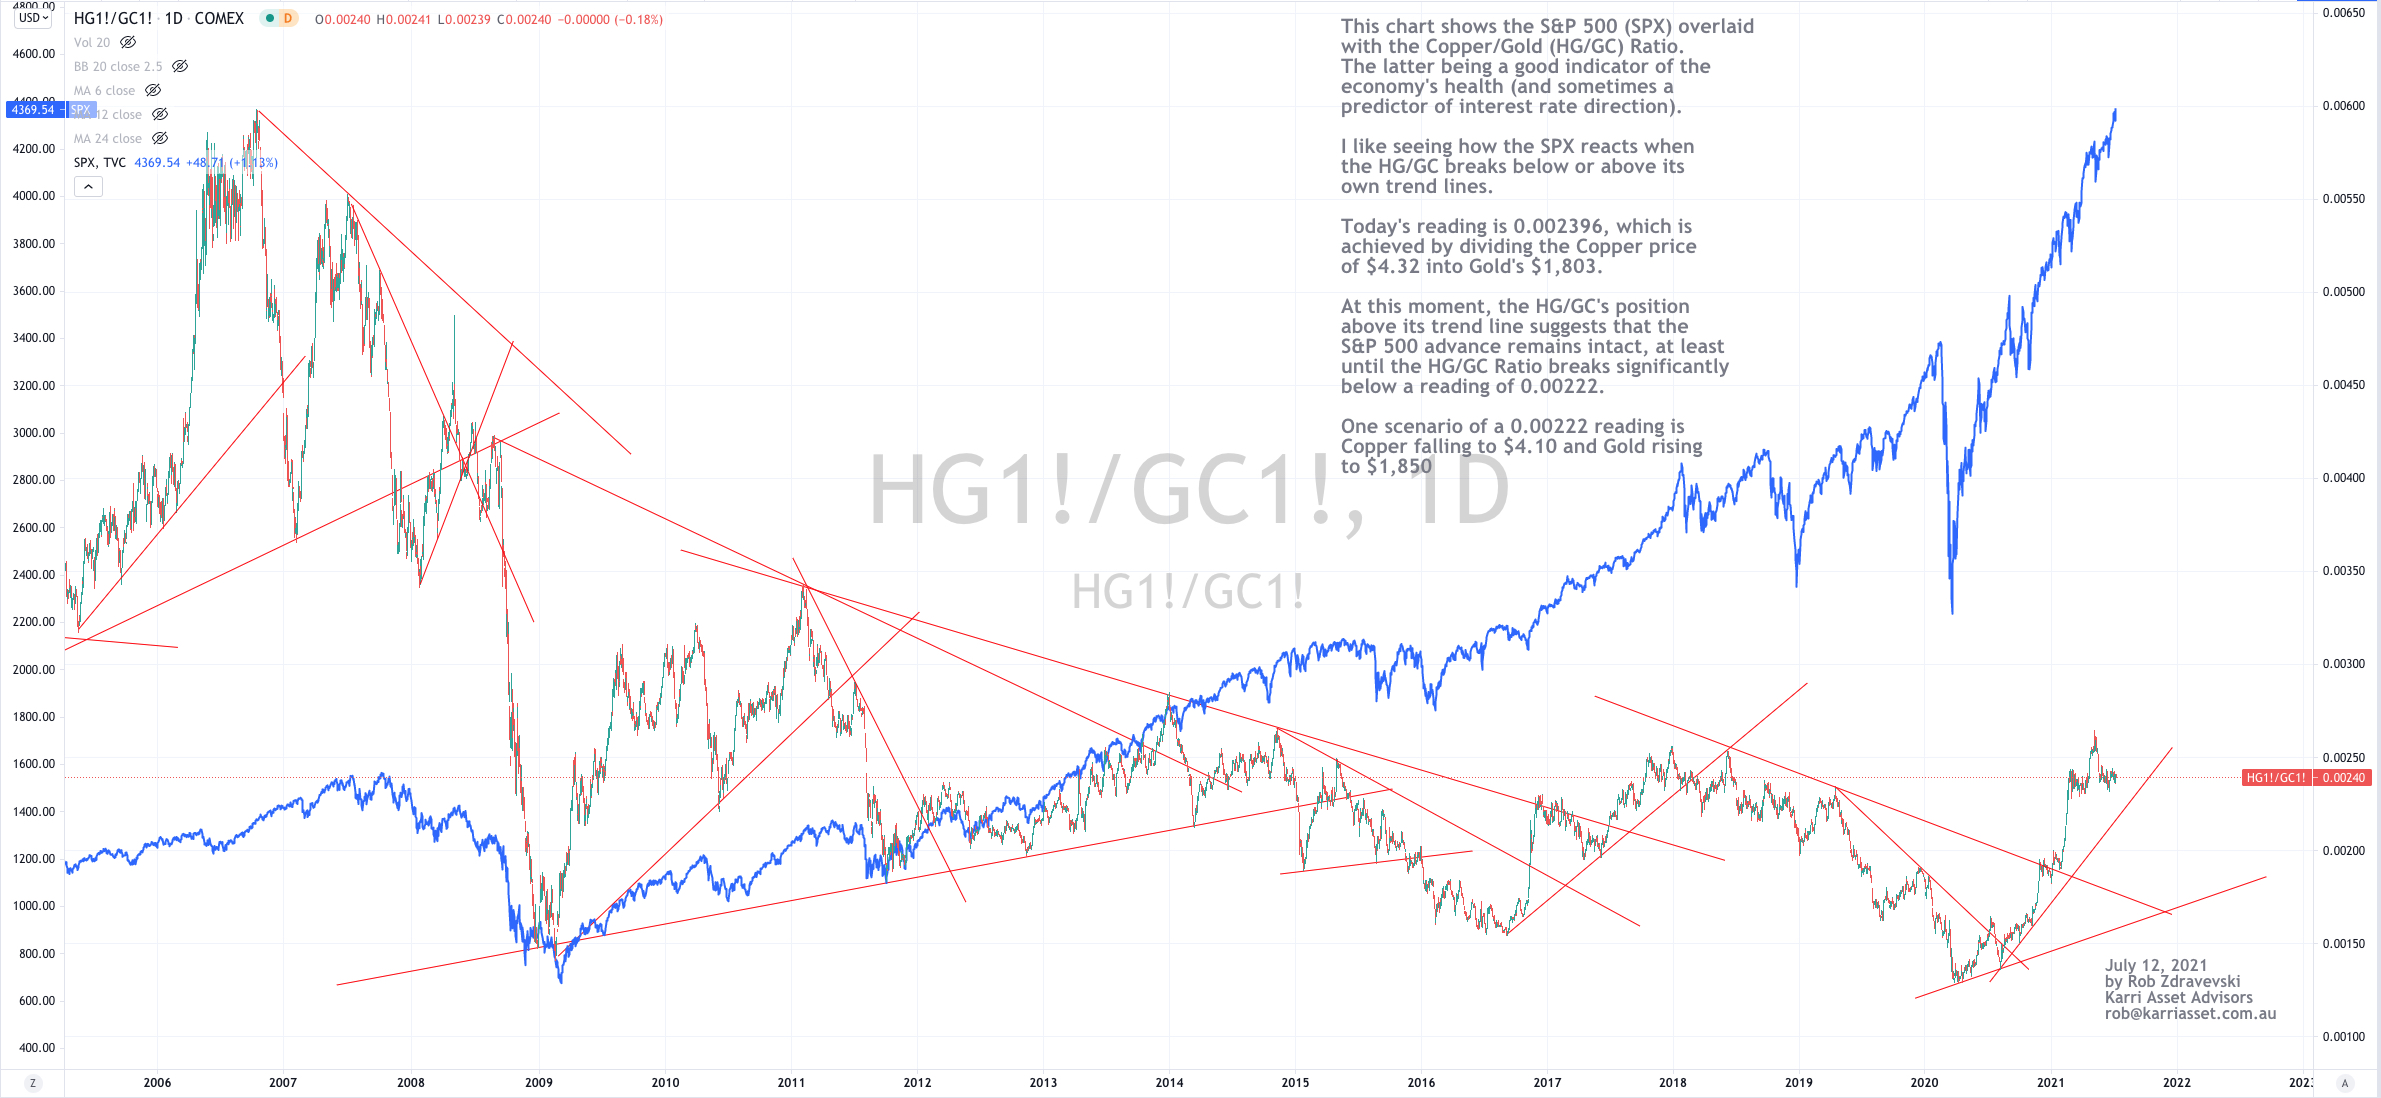
The chart below shows the S&P 500 (SPX) overlaid with the Copper/Gold (HG/GC) Ratio on a daily basis over the past 15 years.
The latter ratio is a good indicator of the economy’s health and sometimes a predictor of interest rate direction.
I find this chart helpful when pondering my asset allocation to equities and how much broader risk I am comfortable taking, especially at the later end of an advance, bull market or rally.
I like seeing how the SPX reacts when the HG/GC breaks above or below its trend lines.
Today’s reading of 0.002396 is calculated by dividing the Copper price of $4.32 into Gold’s $1,803.
At this moment, while the HG/GC’s is trading above its trend line (and a reading of 0.00222) it is suggesting that the S&P 500 advance remains intact……..
This seems quite perverse to many, as pundits reiterate their calls of an overvalued, ‘bubble-esque’ equities market.
In some recent posts I challenge the norm and perhaps the consensus call for a notable decline.
The S&P 500 can continue trading at the historical higher end of its historical stretch above its 200 Week Moving Average, just like the late 1990’s.
and the way the S&P 500 relates to the U.S. 10 year bond yield or more pointedly, the spread between the 10 year and 2 year yield is another important indicator to watch.
Investing is a highly nuanced past time or business.
Often markets move to where they can do the most damage….and going up can cause as much damage as going down, in circumstances such as ‘missing out’ or underperforming other fund managers if you’ve been holding a lot of cash.
P/E ratios are not the only thing to look at.
One scenario of a 0.00222 reading is Copper falling to $4.10 and Gold rising to $1,850. Just something to play around with.
You don’t need to be a cyber hacker to cause economic disruption.
The law of the land allows labour to organise themselves but is this the non-digital version of ransomware?
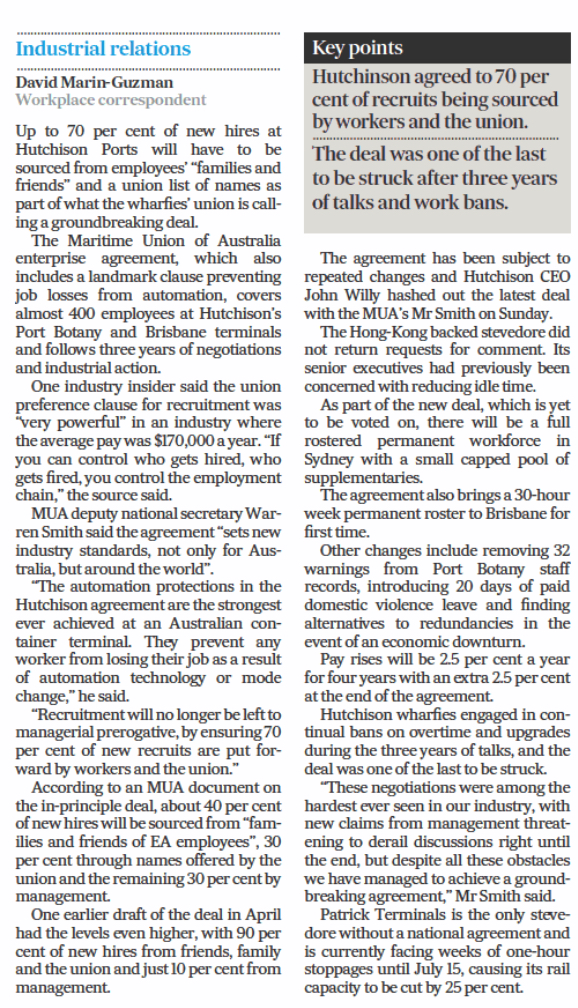
There is some good industrial relations reporting in the Australian Financial Review (AFR).
Take a look at the link below from today’s AFR article. The forceful language suggests negotiating isn’t a possibility. This unease has been brewing for months.
and further below is an extract from another article from the AFR (2 week ago) discussing a new employment agreement, which I was flabbergasted to read.
The ramifications of prolonged union blockades aren’t to be underestimated.
Think of the effect on the import of housing materials or motor vehicles and the export of iron ore, livestock and grains, to only mention a few.
Let alone the effect on GDP or even skew the thinking behind interest rate policy.
“Roughly a third of all people lacked access to adequate food, a figure that rose by 320 million from a year earlier, about as much as in the previous five years combined.”
I am flabbergasted to read this and perhaps naive.
Perhaps instead of funding businesses creating a new dancing, photo, video, shopping sharing app…..here is a problem to solve….
The following assets (on a weekly timeframe) registered an Overbought reading or traded more than 2.5 standard deviations above its rolling mean.
Extremes “above” the Mean (at least 2.5 standard deviations)
USD/KRW (does a stronger USD and weaker Korean Won mean cheaper Samsung phones and Hyundai cars?)
Overbought (RSI > 70)
Brent Crude Oil
WTI Crude Oil
Gasoil
Heating Oil
RBOB Gasoline
Tin (for the 11th week)
Iron Ore
Hot Rolled Coil Steel
France’s CAC-40 equity index (for the 13th consecutive week)
Switzerland’s SMI equity index (for the 4th week)
the Nasdaq 100
the S&P 500
and the Copenhagen, Stockholm and Helsinki equity indices.
The Overbought Quinella – Both Overbought and Traded at > 2.5 standard deviations above the weekly mean)
Natural Gas
Assets (securities) within my immediate universe which touched the other side of the extreme, being Oversold (where the RSI is < 30) or were at least 2.5 standard deviations below its mean are;
Extremes “below” the Mean (at least 2.5 standard deviations)
AUD/USD (for the 4th consecutive week)
AUD/JPY (a weaker AUD and a stronger Yen suggests ‘risk-off’ is tiring)
Nikkei 225 equity index
Hang Seng China Enterprise Index (HSCEI) <see note>
Hang Seng (HSI) equity index
U.S. Government 10 year bond yields (10’s),
the Australian (10’s),
Canadian, Chinese, U.K., Japanese and Swedish 10’s
the U.S. 10 year minus 2 year yield spread
Oversold (RSI < 30)
Nil
The Oversold Quinella – Both Oversold and Traded at < 2.5 standard deviations above the weekly mean)
Nil
Notes & Ideas:
This past week significantly produced a new wave of moves of 2.5 standard deviations below the Weekly mean, but not a single Oversold RSI Stochastic reading.
This tells me the downside moves are a fake-out and represent a trading Buy or at least, a bounce.
It’s time to prepare for when the new occurrences of extremes arise.
The week’s dominant price movers mainly featured losers in the soft agricultural’s, weakness in Asian equity markets https://robzdravevski.com/2021/07/08/chinese-stocks-are-not-popular/ and a lower AUD versus the U.S. Dollar and the Japanese Yen, some which are listed below.
Corn (10%), Wheat (6%), Sugar (5%), Soybeans (4%), Aluminium (3%), Cattle (2%), HSCEI (5%), Hang Seng (3%), Nikkei 225 (3%), Korean KOSPI (2%), Bitcoin (4%), Ethereal (8%) and Lumber (4%) which is nearing a $700 target.
And other commodity commentary saw Precious Metals have a benign week and while Brent Crude has a 7% weekly range (from top to bottom), it only declined 0.7% for the week from its previous close. Importantly, Brent remains in Overbought territory, as does a host of the energy complex.
Although my recent post suggests that it’s plausible and perverse that we see a higher leg in these indices depending on what the bond market does, as mentioned in this post.
Other equity indices closed near flat for the week, although ominously many had wide and whipsawing ranges which saw them either Bearish Outside Reversal Weeks (Singapore Straits Times) or where many made ‘lower highs and lower lows’, including the SOX Semiconductor Index, the Russell 2000, the S&P MidCap 400, the U.S. KBW Banking Index and the Dow Jones Transports.
The U.S. 10 year bond yield it yet to break above 1.75%. The yield fell to 1.36% from last week’s 1.43%, although bouncing from a 1.25% low. The 10’s remain bound in a larger range but we watch it broader capital markets could become explosive is the 10’s break either below 1.25% or above 1.65%.
And lastly, Bitcoin is trading 146% above its 200 Week Moving Average, which is slightly higher than last week’s 154% reading and certainly lower when compared to its 466% peak in mid-April 2021.
In the chart below, you can see that last night the U.S. Government 10 Year Bond Yield (‘the 10’s’) touched the lower end of a daily 2.5 standard deviation point and kissed the supporting trend line.
They are a ‘hair’ away from being Oversold. It’s now plausible that the yield in the 10’s move back to the 1.58%
This translates into a Long entry point for U.S. financial and cyclical equities……..and also for some selected commodities such as Brent Crude, Soybeans, Sugar, maybe Corn, perhaps Platinum and certainly Copper.
For the past 2 weeks, the media has been heralding the end of the ‘reflation trade’. It should prove to be momentary.
If one is interested and ‘ballsy’, rising yields in the 10’s should provide a short trade for your high price to revenue stocks. Think Peloton, Snap, Pinterest etc.
* not personal advice…do your own work or seek professional advice
It’s an interesting market day developing for the U.S. session.
The chart below is an observation of when the spread between the
U.S. 10 year yield minus the U.S. 2 year yield reaches an oversold “daily” reading and how it portends higher S&P 500 prices.
In the vain hope of being a trader, there is an opportunity to pick up some stocks which have been weaker over the past few days.
There is much noise in today’s European session (preceding the July 8 U.S. business day) with broad bond buying resulting in declining government yields, falling U.S. equity futures prices and weakness in European and Asian equities.
Hasn’t the stock market preferred lower bond yields, thus making equities more attractive?
……then why the media hubbub today about the weakness in the equity markets due to lower bond yields?
Lower bond yields are good for equities.
In the meantime, readers can refer to my recent posts about the range of the U.S. 10 year bond yield (and the spread) is in and the effect it should have on the stock market if it breaches either side.
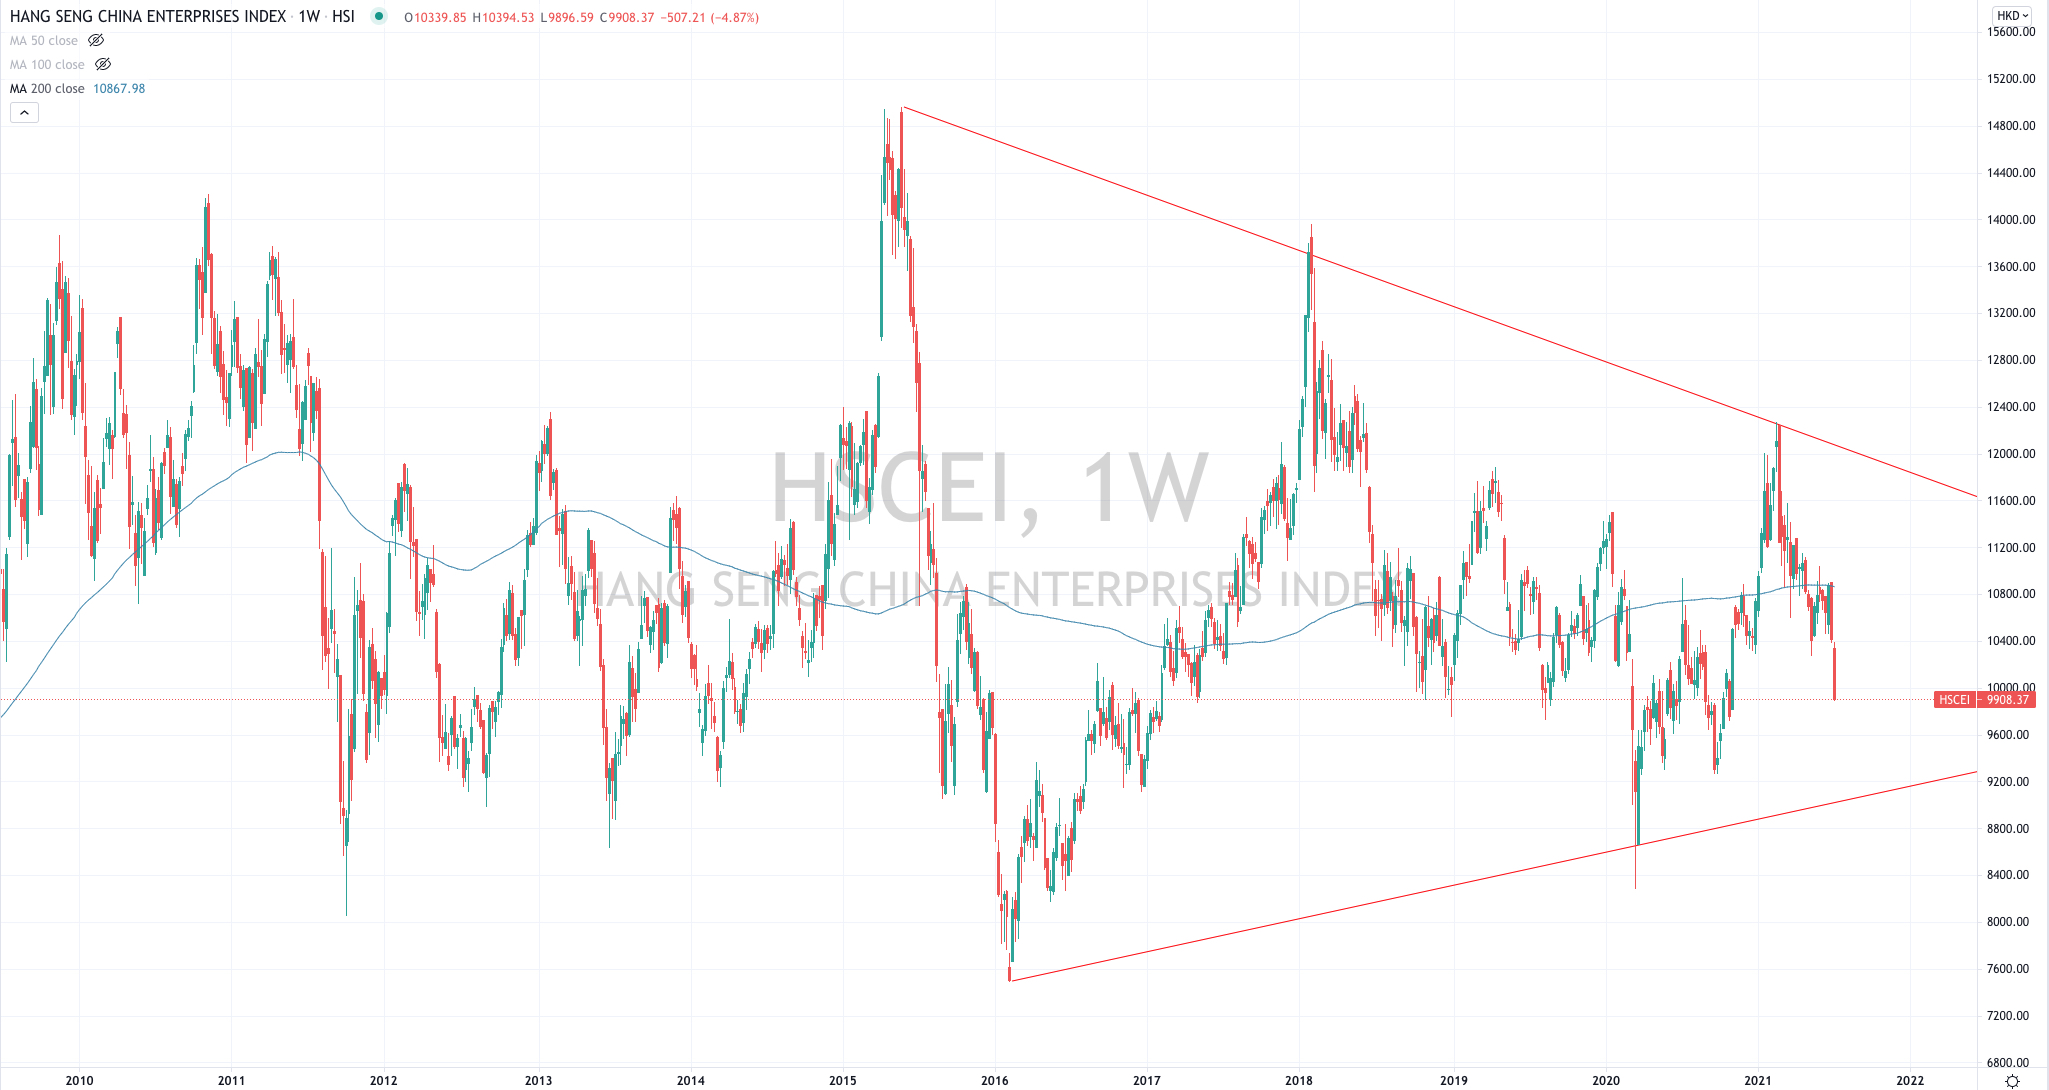
A most interesting contrarian, oversold investment opportunity on my radar is the Hang Seng China Enterprises <equity> Index (“HSCEI”).
The HSCEI serves as a benchmark that reflects the overall performance of Mainland Chinese securities listed in Hong Kong.
Index constituents include Bank of China, Sinopec, Alibaba, Conch Cement, Geely Auto, CNOOC, China Mobile, ICBC, CITIC and Tencent.
With all the hoopla surrounding restrictions of where Chinese companies are permitted to list their publicly quoted securities, temporary mis-pricing is often what occurs at such a moment.
The HSCEI has declined 20% from its February 2021 peak.
Why would Chinese authorities ruin their ascension onto the global capital markets scene by restricting foreign capital interest and retarding their own companies seeking liquidity?
It doesn’t make sense and I think there is some type of smokescreen (tactic) behind the latest announcements which may include inflicting a little pain on U.S. investors or flexing a little (soft-power, economic) muscle.
Don’t lose sight of the larger part of a story. China wants to have a financial services and capital market industry similar to the Western World.
They are hiring ‘western’ skills and offering full banking licenses to ‘western’ firms, just so they can be ‘like us’.
It is in China’s interest to bid for foreign capital.
For example, China is the world’s 2nd largest bond market. Today, the foreign share of the mainland Chinese bond market is 3.5%, which has risen from 1.2% at the end of 2017.
Interest in Chinese capital markets (bonds or stocks) will continue to grow with news such as $300 billion to enter the bond market as a result of FTSE Russell officially adding China to its World Government Bond Index in October 2021.
In order to sniff out an investment opportunity, it’s important to filter or dissect the current ‘noise’.