Conditioning For Lower Returns

Most of the investing world measures annual performance at the end of December 31st.

The media and pundits make themselves seem clever by reporting what has already happened.

You must remember that they are reporters and not market professionals or investors.

What is the difference?  

Journalists and commentators seldom (if at all) take any risk with their own or while advising and managing other people’s money.

While it’s informative, it’s not visionary and it doesn’t help anyone’s past nor prepare anyone for the future.

What is more important that simply reporting the past 3 years of performance figures….
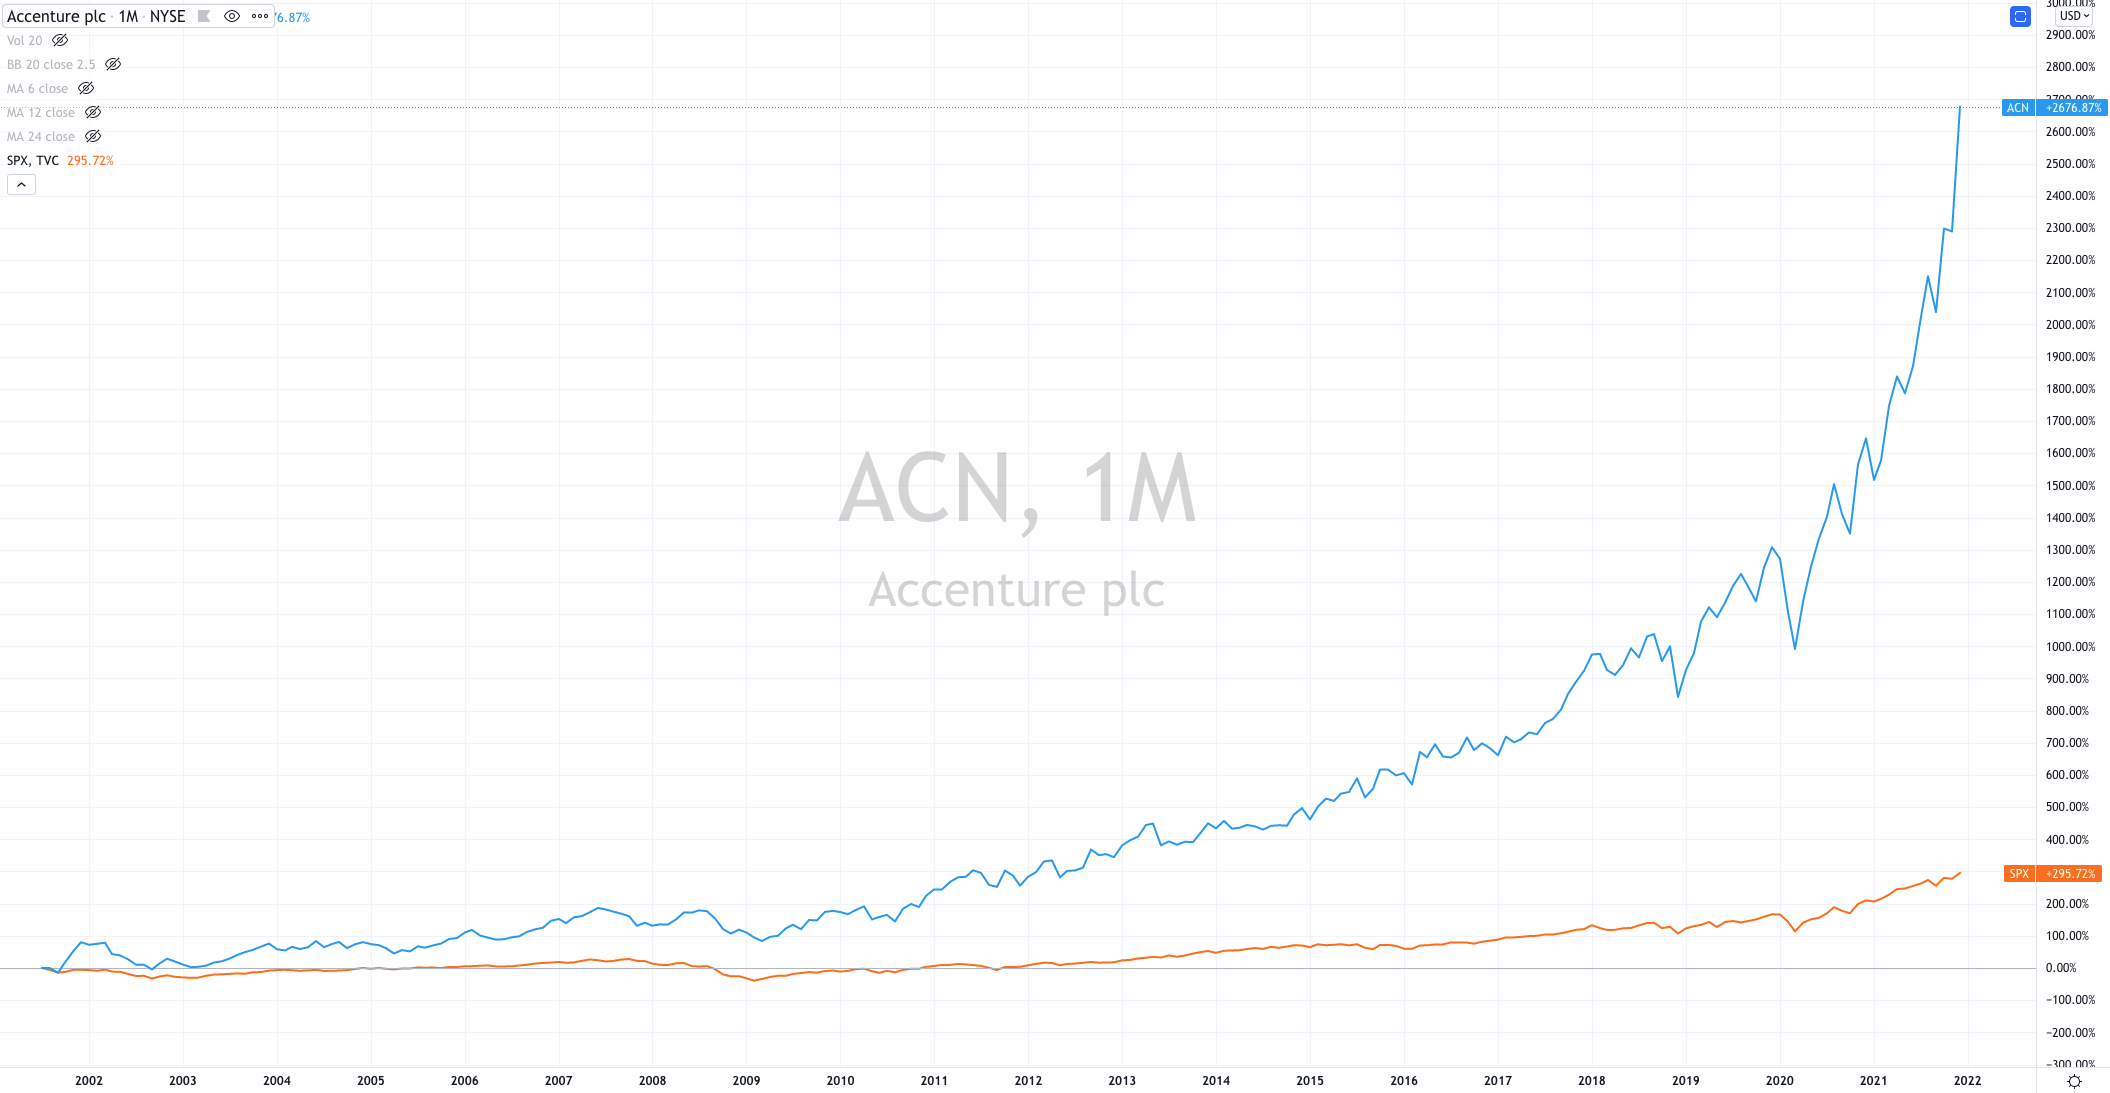
S&P 500

2019 29%

2020 16%

2021 27%

Nasdaq 100

2019 36%

2020 50%

2021 27% 

…..is to ponder what to expect in the coming year or so.

While that prediction is impossible, the best guidance I can offer readers is that these type of returns are not to be taken for granted and certainly not to be extrapolated or ‘banked on’ in the future.

It’s more plausible to expect 2022 numbers to come in at +7% or (5%).

Consider conditioning oneself for lower returns.

Why?

Unscientifically;

Winning streaks come to an end,

Many think it’s their god-given right to earn 20% every 2 months, 

Those type of returns are extraordinary when compared to the cash rate,

Persistent extraordinary performance are eventually subdued,

Elastic Bands and Pendulum snap back and 

When I posed an investment idea which I thought may provide a 15% return over the next 18 months, the investor responded with “it’s hardly worth making that investment for such an average result”.

Mathematically, we may argue whether earnings expand, investors pay even higher prices for those future earnings or what has been or isn’t already factored or discounted.

Meanwhile the ASX 200 Index performance has been;

2019 19%

2020 (2%)

2021 13%

January 3, 2022

by Rob Zdravevski

rob@rkarriasset.com.au

Macro Extremes (week ending December 31, 2021)

The following assets (on a weekly timeframe) registered an Overbought reading or traded more than 2.5 standard deviations above its rolling mean.

Extremes “above” the Mean (at least 2.5 standard deviations)

Italian 10 year government bond yields

Soybeans

Rice

Overbought (RSI > 70)

U.S. 2 year bond yields

Cattle

USD/JPY

The Overbought Quinella – Both Overbought and Traded at > 2.5 standard deviations above the weekly mean)

None

Assets (securities) which touched the other side of the extreme, being Oversold (where the RSI is < 30) or were at least 2.5 standard deviations below its mean are;

Extremes “below” the Mean (at least 2.5 standard deviations)

EUR/GBP


Oversold (RSI < 30)

None

The Oversold Quinella – Both Overbought and Traded at > 2.5 standard deviations above the weekly mean.

Hot Rolled Coil Steel (HRC)


Notes & Ideas:

Notable news in market action included Urea and the JKM LNG Marker are no longer Overbought.

It was the mildest of weeks not only considering the movements over the past 12 weeks but also the lighter than usual volume which can exacerbate price volatility.

I’m encouraging readers to review past few editions of ‘Macro Extremes’ contains some basics of the framework which I am watching and they are still intact, from Gold, Silver, Currencies and Bonds.

The biggest weekly mover in global markets was the declines in Coal and Gas related commodity prices. JKM LNG fell 22%, Rotterdam Coal declined 16%, Dutch TTF Gas was walloped 47%, while Hot Rolled Coil (HRC) Steel gave up 11%.

All of these assets are falling following parabolic ascents, which remains something to watch, although HRC Steel is the first commodity to have reached an Oversold level for many months, after ‘only’ declining 26% from its August all-time high.

Interestingly, Dutch TTF Gas has fallen 61% from its parabolic peak and not close to touching an extreme low.

The price of Rice has touched its highest level in 20 months. The previous time it saw this level was mid-2014.

It’s worth pondering the effect of these higher prices for producing and exporting nations along with those countries where Rice is a notable staple.

China and India produce 29% and 23% of the globe’s annual crop, while the latter is the largest exporter.

In other milestones, the Japanese Yen has closed at its weakest price (versus the U.S. Dollar) since March 13, 2017.

More on these topics and their relationship to other assets in separate posts.

And Crude Oil, Gasoil (diesel), U.S. Transports and the S&P 500 all gained, adding to and confirming last week’s bullish outside reversal weeks.

The larger advancers over the past week comprised of; 

Australian Coal 3.1%, Cocoa 1.9%, WTI Crude 1.9%, Gasoil 2.1%, Lumber 9.4%, Cattle 1.9%, Silver 1.8%, Brent Crude 2.7%, Rice 4.5%, Dow Jones Transports 1.8%, IBEX 1.8%, S&P 400 Midcap 1.7%, MOEX 2.3%, Sensex 2.1% and Copenhagen 25 index rose 1.8%.

The group of decliners included ;

Aluminium (2%), Rotterdam Coal (15.5%), China Coal (7.3%), Lean Hogs (2.1%), HRC (11.2%), JKM (21.5%), Coffee (2.2%), LNG Nymex (33.8%), Sugar (1.9%), Dutch TTF Gas (47%), Urea (9.8%), Corn (2.1%), Wheat (5.4%), Oats (3.4%).

Lastly, and editorial comment.

Bitcoin and Ethereum both declined 8% for the week, while they seem to synchronise their weekly movements lately, it seems difficult to consolidate the concept that they can be considered a ‘currency’….but then again, the Turkish Lira did fall 18% for the week and many still call it a currency.


January 2, 2022

by Rob Zdravevski

rob@karriasset.com.au   

Wow ! Accenture Wow !

Back then, when I was a broker at Salomon Smith Barney, the firm was part of the new IPO in Accenture.

This was the new name for Andersen Consulting after the partners voted to become independant from Arthur Andersen

My job was to be the broker contact for the Australian partners and anything involving their Stock, Options and ESOP. The main focus was the “Founders Shares” which were priced at 1 cent.  

The IPO was priced at $14.50 per share on July 18, 2001


Back then Accenture’s numbers looked like this;

Revenues $10 billion

Net Profit: $2.4 billion

Number of employees: 75,000

Market Cap: $14 billion

The chart below shows Accenture stock price is now trading at $415.

I remember the IPO day well and 20 years on, some of those Australian partners are still clients or remain within my network.

While some have sold all their holdings, I’m sure many have divested along the way and perhaps there are those who haven’t sold a single share.

Today’s Accenture numbers are;

Revenues $51 billion

Net Profit $6 billion

Number of employees: 674,000

Market Cap: $272 billion

It’s simply amazing to watch the stock price of this company rise 20 fold over the past 20 years and furthermore, outperform the S&P 500 by a factor of 10, as seen in the 2nd chart presented below.

Incidentally, Accenture’s stock has tripled over the past 20 months and its price rise now resembles a parabola along with a few indicators spitting out Overbought signals.

I guess the biggest problem selling now is finally triggering a taxable event.

Finally, it’s nice to see a stock appreciate and adding most of its value in its guise as a public company.

More on this later.

December 31, 2021

by Rob Zdravevski

rob@karriasset.com.au

My final newsletter for 2021

My final newsletter for 2021 is here……

https://mailchi.mp/karriasset/a-distorted-sp-500-amongst-extreme-peaks

Lower Shipping Costs

Below is a chart of the Baltic Dry Index, which has risen 12 fold in 18 months.

Such a parabolic rise is often met with a severe retracement.

Recently, it couldn’t trade above a recent mark (as noted in the ellipse) to make a ‘higher high’ but last week, it broke beneath a trend line and made a ‘lower low’.

Other indicators are also bearish.

I’ll look for it to mean revert to its 200 week moving average (blue line) but I think $900 is plausible. Look out below.

Then the next chart I have overlaid the nice correlated Iron Ore price.

The case for a lower Baltic Dry Index increases the probability of lower Iron Ore prices.

We are seeing may assets and securities in a battle to make a ‘higher high’ and if they can’t, we’ll see them making a double dip to recent lows.

Where parabolas have existed, expected lows to be tested but also broken. Reversion to the mean will be a more notable thing to look for.

With that, I think about mining companies exposed to this theme. 

I believe that lower shipping prices will more than offset a new 20% decline in Iron Ore prices.

December 27, 2021

By Rob Zdravevski

rob@karriasset.com.au.

#mining #shipping #RIO #FMG #BHP #ironore

Macro Extremes (week ending December 24, 2021)

The following assets (on a weekly timeframe) registered an Overbought reading or traded more than 2.5 standard deviations above its rolling mean.

Extremes “above” the Mean (at least 2.5 standard deviations)

None

Overbought (RSI > 70)

U.S. 2 year bond yields

Turkish 10 year bond yields

the JKM “Japan/Korea (LNG) Marker”

Urea 

The Overbought Quinella – Both Overbought and Traded at > 2.5 standard deviations above the weekly mean)

Dutch TTF Natural Gas (it fell 23% of Friday alone)

Assets (securities) which touched the other side of the extreme, being Oversold (where the RSI is < 30) or were at least 2.5 standard deviations below its mean are;

Extremes “below” the Mean (at least 2.5 standard deviations)

Russia’s MOEX equity index

Spain’s IBEX equity index

HSCEI Index

Hang Seng Index

Sugar


Oversold (RSI < 30)

None

The Oversold Quinella – Both Overbought and Traded at > 2.5 standard deviations above the weekly mean.

None


Notes & Ideas:

It was a mild week considering the movements over the past 12 weeks.

There isn’t much to report. 

The past few editions of ‘Macro Extremes’ contains some basics of the framework which I am watching and they are still intact, from Gold, Silver, Currencies and Bonds.

The U.S. 10 year bond yield is still in a downtrend while it holds the 1.34% support line.

From previous week’s commentary, I’ll reiterate watching the difference between the U.S. 10 year bond yield minus the U.S. 2 year bond yield.

The biggest weekly mover in global markets was the Turkish Lira rising 52% following continual weeks of making new historic lows.

Look out for a note on the Baltic Dry Index, which fell a further 7% this week, adding to last week’s 27% decline and it’s part of a story which I am telling is an example of 2nd chance selling pressure which will eventuate in a double dip in many assets.

Another notable mover was (NYMEX traded) U.S. LNG prices, which rose 19% as a flotilla of cargoes are heading to Europe chasing higher spot prices on the continent. 

I’ll continue to highlight the peril of chasing parabolic moves such as the one seen in Dutch TTF Gas price, which after more than doubling in 6 weeks, fell 23% on Friday alone.

While Crude Oil, Gasoil (diesel), U.S. Transports and the S&P 500 all made outside bullish reversal weeks.

The larger advancers over the past week comprised of; 

Oslo +2.3%, Stockholm +3.5%, Philadelphia SOX +4.6%, S&P 500 +2.3%, Transports +3.5%, AUDJPY +2%, AEX +2.4%, CAC +2.3%, DJ Transports +2.3%, IBEX +3%, S&P Midcap 400 +2.6%, Nasdaq 100 +3.2%, Russell 2000 +3.1%, Aluminium +5.8%, Bloomberg Commodity Index +2.6%, WTI Crude +4.3%, Iron Ore +2.2%, Gasoil +1.8%, Lean Hogs +3%, Copper +2.3%, Heating Oil +5%, Cattle 1.8%, LNG +19.5%, Platinum +4.3%, Gasoline +4%, Silver +1.8%, CRB Index +2.6%, Brent Crude +4%, Corn +2.1%, Rice +1.8%, Soybeans +4.1% and Wheat +5.1%.

The group of decliners included ;

Baltic Dry Index (6.8%), Hot Rolled Coil Steel HRC (2%0, JKM (8.5%), Lumber (2.5%), Dutch TTF Gas (3.2%), Rotterdam Coal (2.7%), Bovespa (2.2%) and Istanbul’s BIST (9.5%)


December 27, 2021

by Rob Zdravevski

rob@karriasset.com.au   

AdBlue’s affect on Diesel prices

AdBlue shortages is a popular topic.

The shortage of this fluid which is squirted onto the exhaust gases produced by diesel engines (in order to reduce emissions) is expected to affect the trucking (logistics, supply chain etc) industry.

Understandably, the price of Urea continues to scream stratospherically and parabolically higher.

But the price of GasOil (diesel) has declined. This is also understandable as we’d expect fuel to be conserved and truckers buying less diesel as an in kind reaction to AdBlue shortages.

With that said, the main highlight of this post is to show you the volatility of the GasOil price lately.

In the chart below, the first ellipse shows GasOil falling 12% on November 26th and then for the next 4 trading days it has a minimum of a 5% trading range in each day.

Volatility continues for the next 2 weeks.

Then (the second ellipse) this Monday it closes down 5.5% from the previous day.

On the next day (Tuesday), it closes up 5.5%.

This tells you to stay away.

It tells you that some markets are becoming a video game.

It’s a reminder to watch but not play.

December 23, 2021

by Rob Zdravevski

rob@karriasset.com.au

#adblue #diesel

Watching for Lower Lows

Within the ‘mean reversion trade’, which I think will play out in 2022……

the current game is to firstly watch if markets double dip and test the lows seen in the past fortnight.

And then incorporate that into whether prices make higher highs or lower lows.

The patterns and waves seen in the AUDUSD (weekly) chart below, is being mimicked across a host of assets.

In this example, the bounce from 0.7000 needs to travel above 0.7555 to make a ‘higher high’….while a new ‘lower low’ is close by.

Additionally, the AUDUSD has also been a good proxy for ‘risk-on’ and ‘risk-off’ sentiment.

December 20, 2021

by Rob Zdravevski

rob@karriasset.com.au

Macro Extremes (week ending December 17, 2021)

The following assets (on a weekly timeframe) registered an Overbought reading or traded more than 2.5 standard deviations above its rolling mean.

Extremes “above” the Mean (at least 2.5 standard deviations)

Lumber

China’s CSI 300 equity index

Overbought (RSI > 70)

U.S. 2 year bond yields

the JKM “Japan/Korea (LNG) Marker”

Coffee

Urea 

Dutch TTF Natural Gas

and the U.S. Dollar (DXY) Index

The Overbought Quinella – Both Overbought and Traded at > 2.5 standard deviations above the weekly mean)

Dutch TTF Natural Gas

Assets (securities) which touched the other side of the extreme, being Oversold (where the RSI is < 30) or were at least 2.5 standard deviations below its mean are;

Extremes “below” the Mean (at least 2.5 standard deviations)

Russia’s MOEX equity index


Oversold (RSI < 30)

EUR/USD

DKK/USD

The Oversold Quinella – Both Overbought and Traded at > 2.5 standard deviations above the weekly mean.

TRY/USD – the Turkish Lira is historically weak


Notes & Ideas:

It was a week of falling bond yields, meaning it was a ‘risk-off’ week and inversely, equities eased.

Other markets mainly digested and consolidated recent moves as they find their way from old extremes into new trends.

I’m also watching if certain securities attempt a double dip, to their recent lows. More on that in upcoming posts on my blog.

Some macro trends are at an acute point. Platinum and Silver are closing in to an Oversold extreme. The Copper/Gold ratio is trying to enter a downtrend while the U.S. government 10 year bond yields remain in a weak downward trend.

The difference between the U.S. 10 year bond yield minus the U.S. 2 year bond yield is also something I’m watching.

And it’s worth noting that the Australian government 2 year bond yield had a bullish outside reversal week. 

In a review of topics from last week’s note, I wrote, 

“Gold (in AUD) needs to holds A$2,467 and USD priced Gold equivalent level is US$1,758”

And so they did, XAUAUD traded to $2,463 and closed at $2,523, while XAUUSD traded to $1,753 and closed at $1,798.

Silver needed to hold $21.80. It traded to $21.41 and closed at $22.54 (up 1.4% on the week) 

Those support levels remain.

And Brent Crude did not trade above $77.00 and thus it didn’t make a ‘higher high’. Brent closed 3.3% lower from the previous week at $72.96.

Henry Hub Natural Gas remains weak, falling a further 6% and is now down 35% over the past 3 weeks. I keep reminding readers that bullish parabolic moves are inevitably followed by quick retracements.  

Japanese (JGB’s)  and American 10 year government bond yields are still testing (and so far, holding) support lines of 1.34% and 0.03% respectively. 

While last week, I heralded that the Hang Seng China Enterprises Index (HSCEI) had a bullish outside reversal week. That was nullified this week, with a 4.2% decline which resulted in a bearish outside reversal week, as that index and the Hang Seng (HSI) search for an extreme low.

And an oversold GBP/USD may find support as the Bank of England became the first G7 nation to raise interest rates in the ‘pandemic era’.

The larger advancers over the past week comprised of; Aluminium +4%, Hogs +10.6%, Hot Rolled Coil Steel +2.6%, JKM +20.6%, Dutch TTF 29.4%, Orange Juice +9.4%, Rotterdam Coal +8.2% and China Coal +7.8%.

The group of decliners included Baltic Dry Index (27.3%, which may be an example of 2nd chance selling and eventually a double dip), Tin (3.9%), Natural Gas (6%), Sugar (3%), Brent Crude (3.1%), Australian Coal (3.3%), Uranium (3.4%), Bitcoin (7%), Ethereum (5%), AEX (2.1%)< KIBW Banking Index (2.9%), S&P Midcap 400 (2.2%), Russell 2000 (1.7%), China’s CSI 300 (2%), Dow Jones Industrials (1.8%), DJ Transports (3.5%), HSCEI (4.2%), Hang Seng (3.4%), Nasdaq 100 (3.3%), SOX (3.9%), Sensex (3%) and S&P 500 (1.9%).


December 18, 2021

by Rob Zdravevski

rob@karriasset.com.au   

This guy is good

Valuable learning and context within 9 minutes