Macro Extremes (week ending June 10, 2022)

The following assets (on a weekly timeframe) registered an Overbought or Oversold reading and/or have traded more than 2.5 standard deviations above or below its rolling mean.

Extremes “above” the Mean (at least 2.5 standard deviations)

None

Overbought (RSI > 70)

Australian 2, 3, 5 & 10 year government bond yields

Canadian, Swiss, Spanish, French, Greek, Italian, South Korean, New Zealand, Swedish and Portuguese 10 year government bond yields

U.S. 2, 5 & 10 year government bond yields

German 2, 5 & 10 year government bond yields

TBT & TBX

U.S. Dollar (DXY) Index
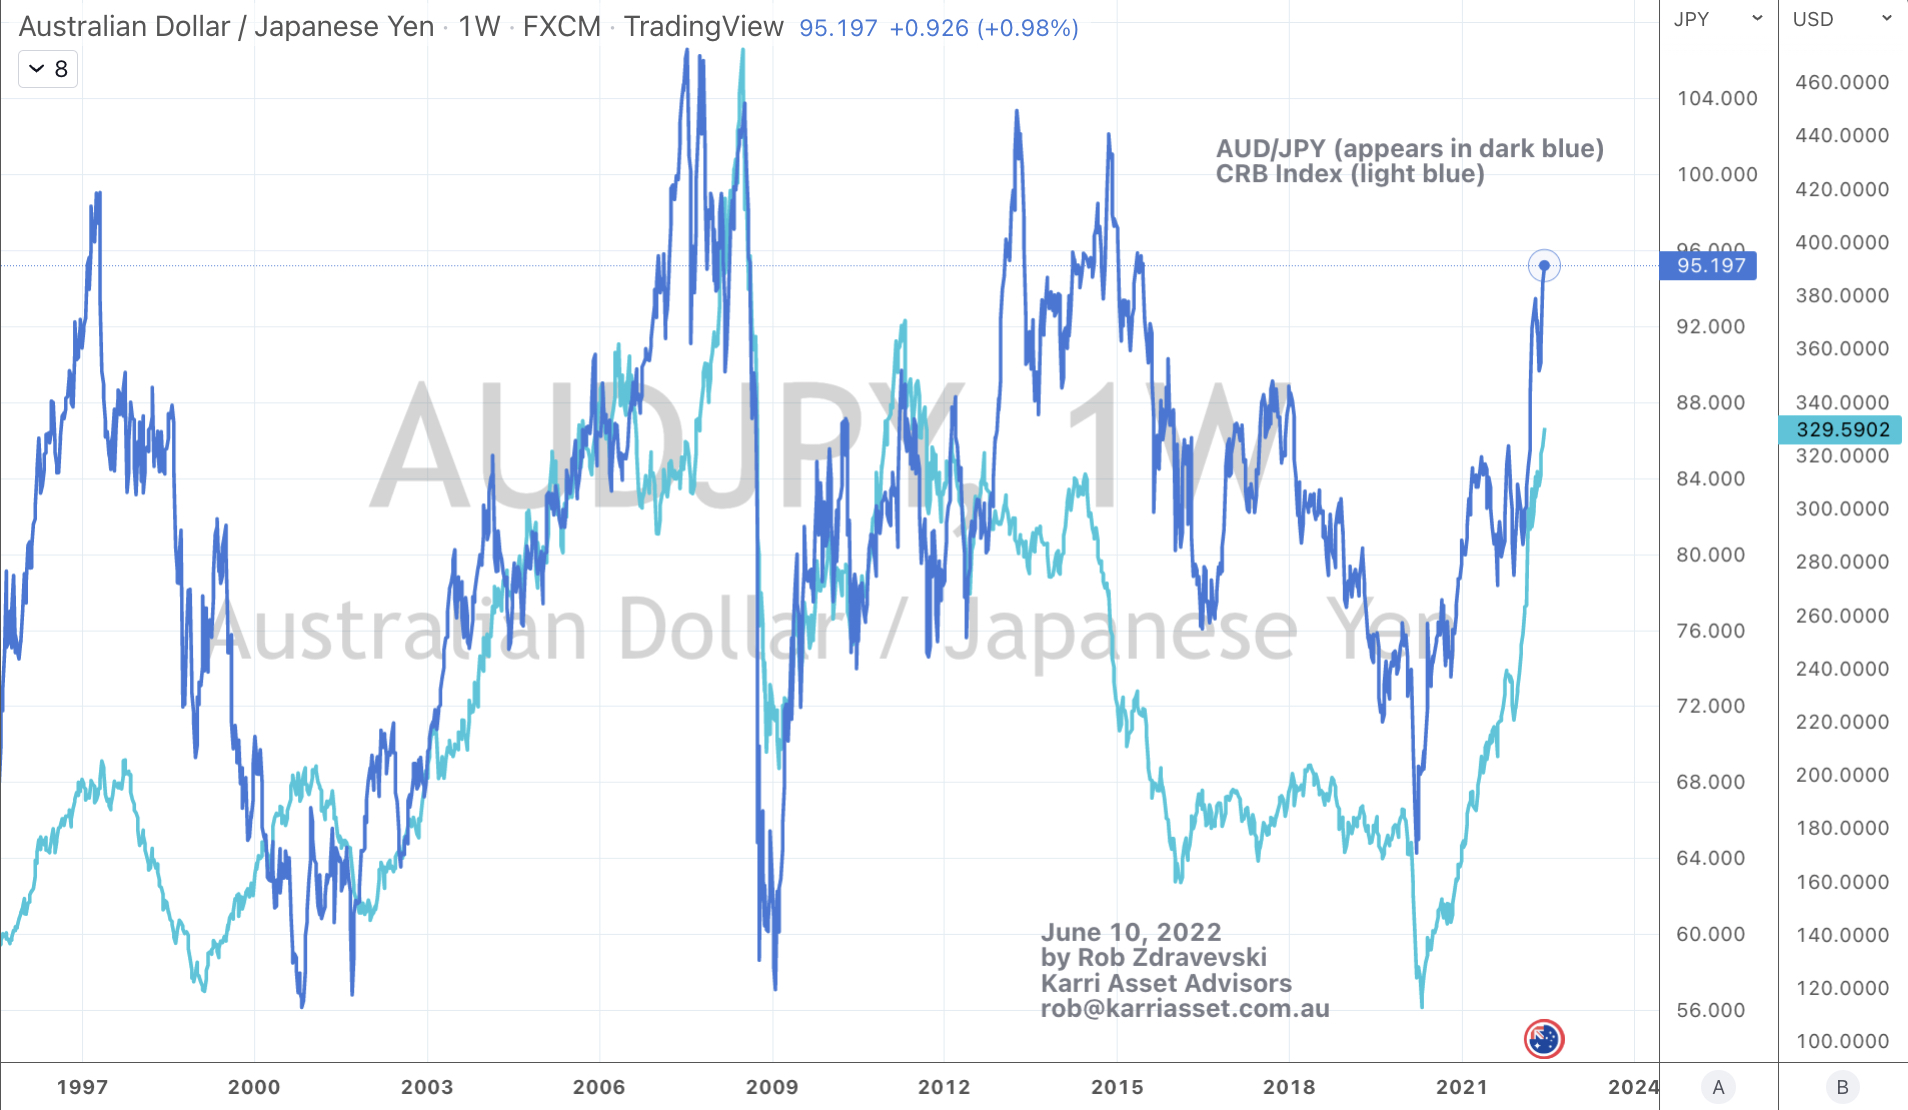
CRB Index

Bloomberg Commodity Index
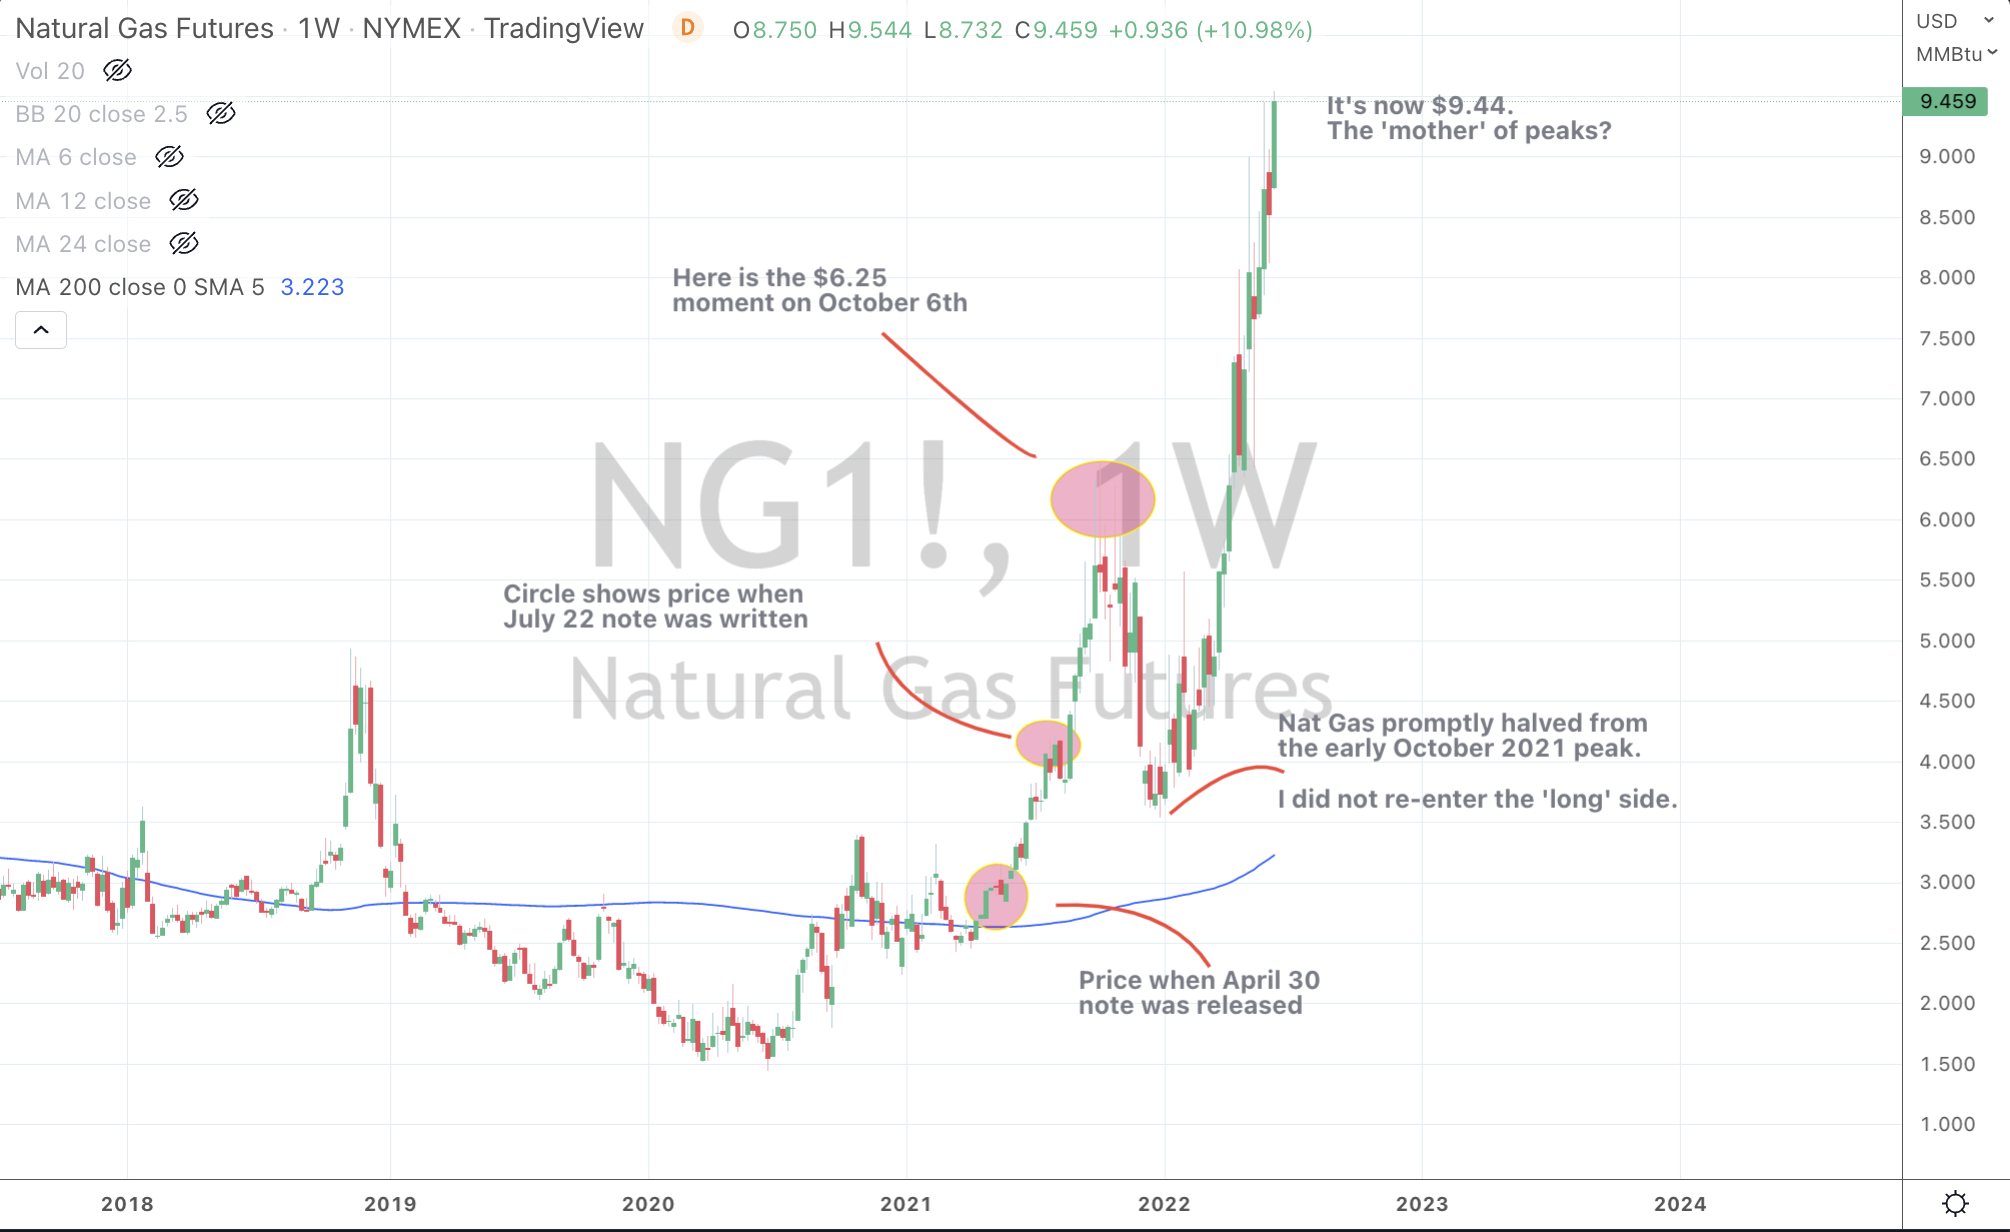
Natural Gas

Gasoline

WTI Crude Oil (September ’22 and December ’22 contracts)

USD/JPY

The Overbought Quinella – Both Overbought and Traded at > 2.5 standard deviations above the weekly mean)

British 10 year government bond year yields

Extremes “below” the Mean (at least 2.5 standard deviations)

None


Oversold (RSI < 30)

NZD/AUD

JPY/USD

TLT & IEF

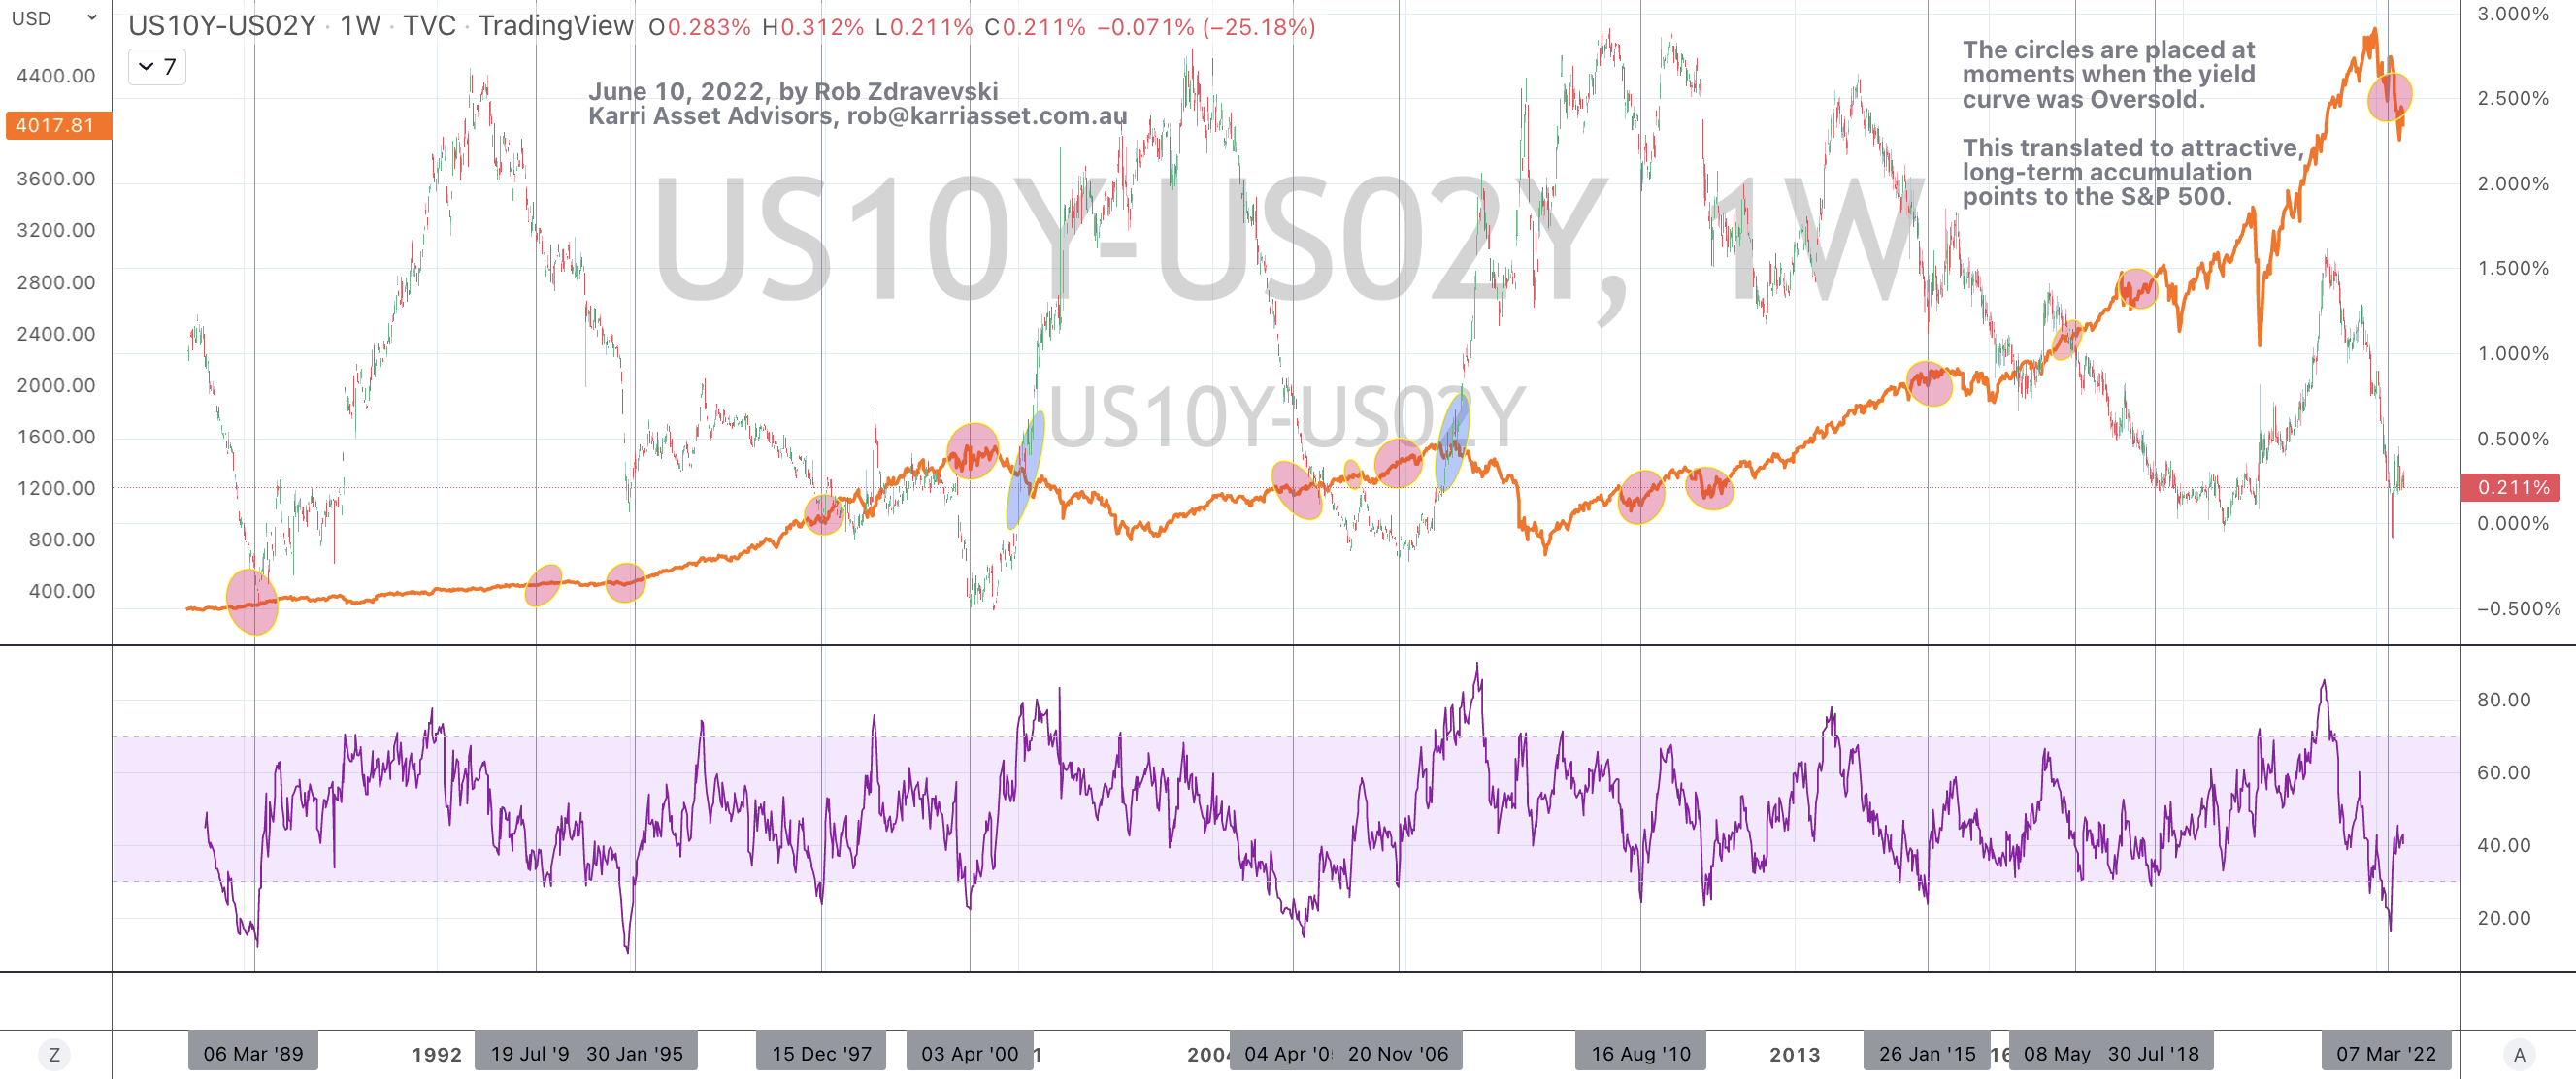
US 10 year minus Australia 10 year government bond yields

The Oversold Quinella – Both Overbought and Traded at > 2.5 standard deviations above the weekly mean)

None

Notes & Ideas:

The big news for the week was that global government bond yields made new, recent highs, everywhere, except for the U.S. 10’s.

The Canadian 10’s moved from 3.07% to 3.38% and Australian 10’s rose from 3.50% to 3.76%, hitting its highest level not seen since June 2014.

All the G-10 nations (except the U.S.) saw their government bond yield rise to mimic June 2014 prices.

While the yield in the U.S. 10 year yield peaked in the past week at 3.18%, it didn’t trade above its week ending May 9th, 2022 high of 3.20%, let alone its 3.25% high seen in October 2018.

Although the U.S. 10’s high in June 2014 was 3.05%.

In other news, the U.S. Dollar Index also failed to trade above its May 9th weekly high and WTI Crude Oil didn’t make news highs either.

Most global equities took a drubbing and the sentiment seems awfully bearish but note that these indices didn’t make ‘lower lows’.

The only equity markets to register gains this week were those tracking Chinese and Hong Kong stocks. The Shanghai Composite Index has risen 9% in 5 weeks and 14% since its April 25 low. 

It’s worthy to note that we saw outside bearish reversal week’s in the DAX, CAC, Dow Jones Transports, S&P Mid Cap and Small Cap indices.

However, my work suggests that major western equity indices are not about to embark on a major, new or extended downward leg.

Many indices are already showing weekly RSI readings in their 30’s, they are closing in on their longer term mean reversions, nearing their lower band of normal standard deviations and when coupled with my other trend and momentum indicators, my work suggests that the ‘set-up’ isn’t in place for such a move.

Cryptocurrencies saw more weakness. Ethereum fell 20%. With little fanfare and news, it seems like apathy may mark an upcoming low. I’ve marked $22,500 as a target for Bitcoin. That’s 18% lower than its current price of $27,500 as I write this.

Silver also had a outside bearish reversal week as it works its way down to it 200 week moving average of $20.36, which is a further 7% below todays price.

The CRB (commodities) Index remains overbought, for the 21st consecutive week.

Last week, I wrote that while “Copper rose for the week as did the Copper/Gold ratio. The latter hit and didn’t break resistance.”

This week, Copper fell which aided how the Copper/Gold ratio behaved, for it did not break above that resistance line.

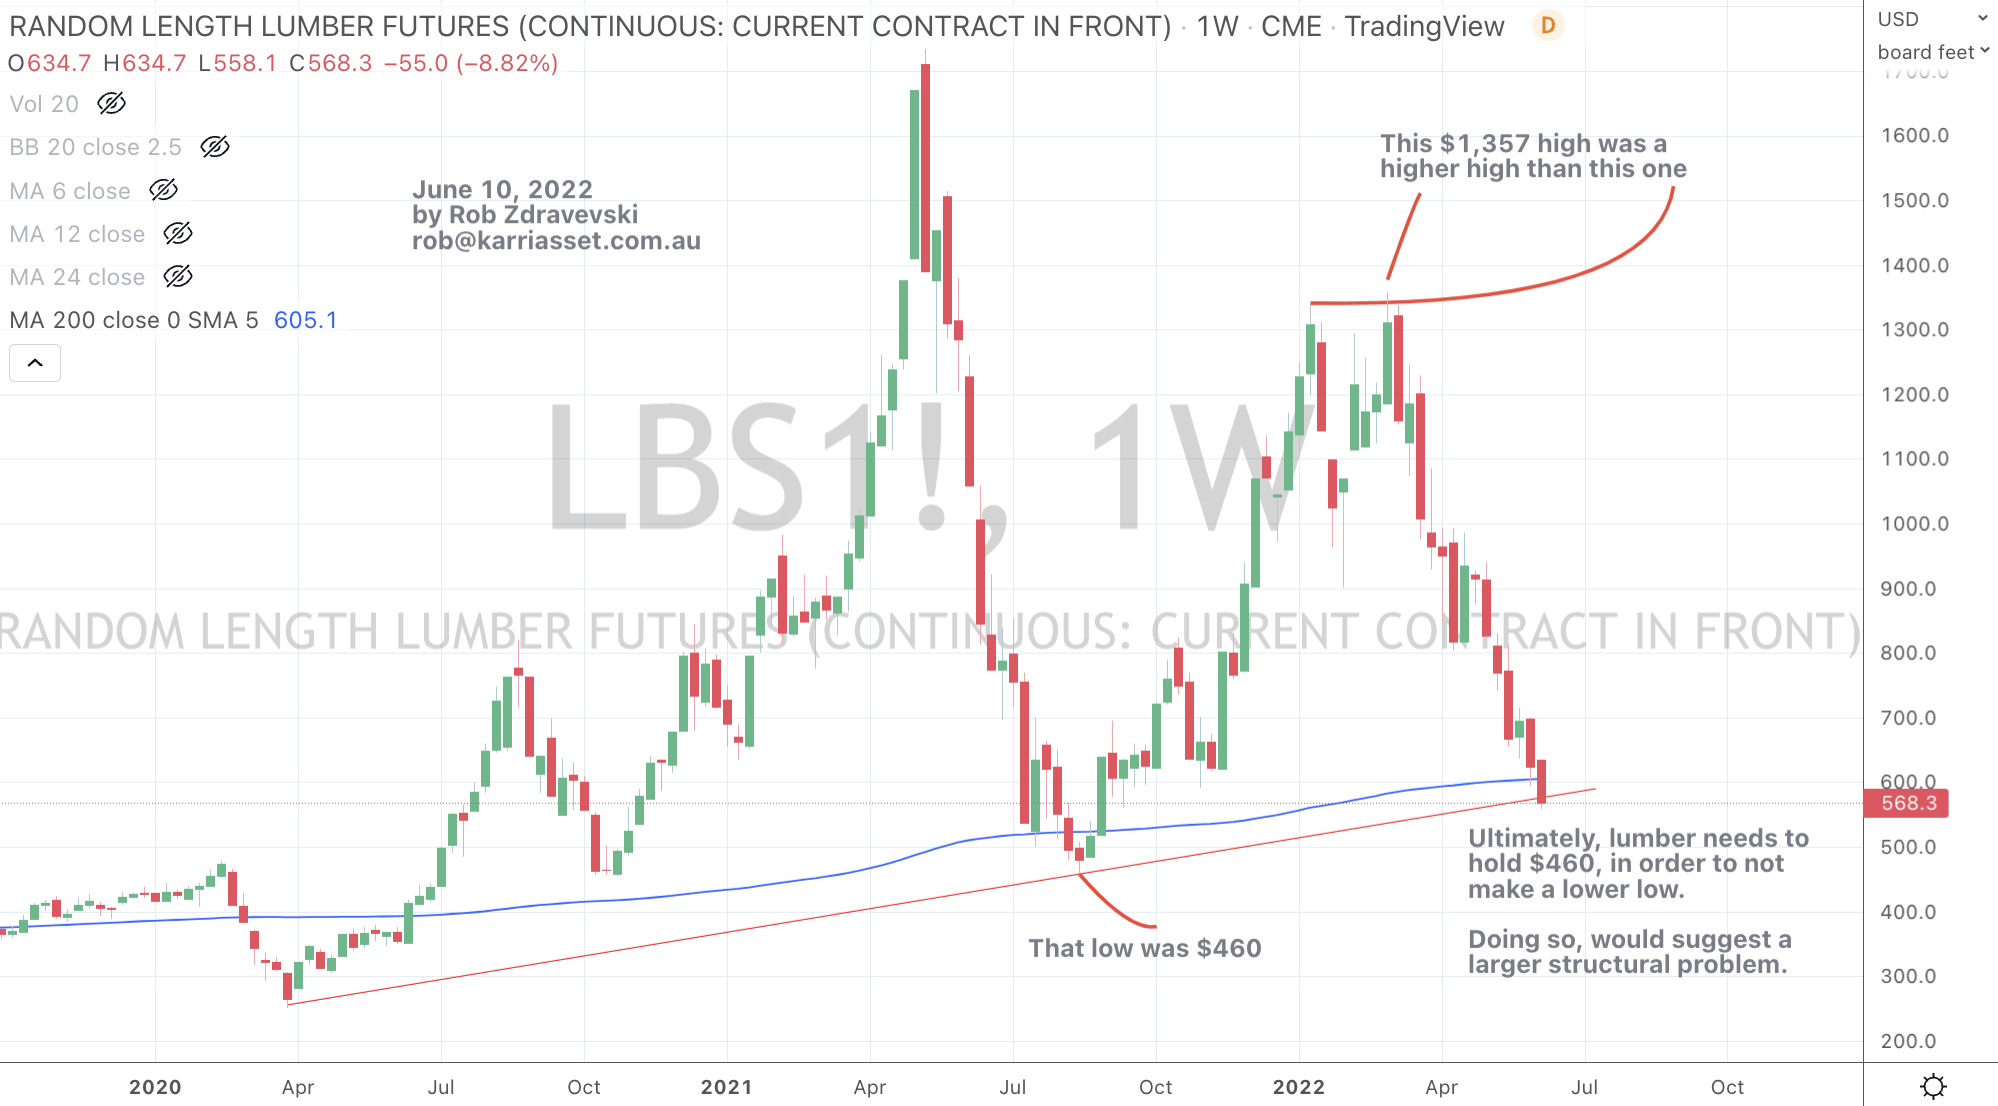
Lumber fell 10% for its 2nd week in a row and a blog post from earlier in the week revises a buying entry point as $460 per tonne.

Last week, I wrote a reminder to watch if Gold (in AUD) holds the A$2,500 level.

It did and has, the low for the week was A$2,544

And the Japanese 10’s tell us that things aren’t that bad as they idle around the 26 basis points mark.

The larger advancers over the past week comprised of; 

China Coal 7.3%, WTI Crude Oil 1.5%, DXY 2%, Heating Oil 2%, Cattle 2%, Tin 7.3%, Natural Gas 3.8%, Orange Juice 2.4%, Cotton 5%, Uranium 2.5%, Silver in AUD 2.2%, Gold in AUD 3.5%, Corn 6.4%, Soybeans 2.8%, Wheat 3%, Shanghai Composite 2.8%, CSI-300 3.7%, HSCEI 4.7%, HSI 3.4%.

The group of decliners included;

Australian Coal (8.2%), Aluminium (2%), Rotterdam Coal (3%), Baltic Dry Index (11.9%), Gasoil (2.8%), Hogs (2.2%), Copper (4%), JKM (3.5%), Lumber (10.8%), Palladium (4%), Platinum (4%), Gasoline (1.9%), Sugar (2.2%), Urea (9%), Oats (5.7%), Rice (3.3%), Bitcoin (8.5%), Cardano (10.8%), GBTC (3%), Ethereum (20.2%), AEX 2.7%, KBW Bank Index (7.8%), CAC (4.6%), DAX (4.8%), Dow Jones Industrials (4.6%), DJ Transports (7.5%), MIB (6.7%), IBEX (3.8%), Bovespa (5.1%), KOSPI (2.8%), Midcap 400 (4.6%), Nasdaq 100 (3.6%), Sensex (2.3%), Oslo (2.7%), Copenhagen (3.4%), Helsinki (2.7%), Stockholm (3.8%), Russell (4.4%), SMI (3.9%), SOX (7.5%), S&P 500 (5.1%), FTSE-100 (2.9%), Canada’s TSX (2.5%), S&P SmallCap 600  (4.3%), Biotech Index (5.2%) and Australia’s ASX 200 fell 4.2%.

June 12, 2022

by Rob Zdravevski

rob@karriasset.com.au  

Re-iterating rarer occurrences

Continuing today’s theme and sermon, the chart below (in amongst dire, ‘the sky is falling’ news and sentiment) shows the S&P 500 already hitting an Oversold reading and only its 9th occurrence in 41 years.

Look for the circles denote so, in the chart.

The previous moment before 1987 was in 1981.

June 10, 2022

by Rob Zdravevski

rob@karriasset.com.au

All is good in the ‘hood’

A year ago, I wrote this note. It has some additional links to read as well.

That note was about watching the relationship between the U.S. yield curve the lows seen in the S&P 500, on a daily basis.

Today’s note highlights a much bigger picture.

It’s a weekly observation over more than 3 decades.

From the ‘page’ of being a constant investor and accumulator and never is one, a seller…..

I’d like to direct readers attention to the orange line of the S&P 500 in the attached chart.

The chart requires a little time to stare and digest it.

The circles are placed at moments when the yield curve was Oversold.

It’s not necessarily when the curve was “inverted”.

I have placed vertical lines near as many occurrences without making the lower timeline looking crowded.

For some reference, the yield curve (or spread) is the calculation between the yield of the U.S. government 10 year bond and that of the U.S. government 2 year bond.

This “oversold” moment has happened 14 times in the past 33 years.

This also coincided with attractive, long-term accumulation points in the S&P 500.

The two moments when this thesis failed was when the yield curve notably traded and crossed above the S&P 500, which is highlighted by the blue ellipses.

Today, this scenario is Oversold YET the spread is NO where near crossing ‘above’.

There are no blue circles appearing.

In the context of years, a few months should be insignificant for the longer-term investor.

Today’s message happens to match last months musing’s about the lows in the S&P 500 and Nasdaq…..

and the Buy signals in my recent newsletter….

https://mailchi.mp/karriasset/buy-signals-appearing

June 10, 2022

by Rob Zdravevski

rob@karriasset.com.au

Will cheaper Lumber lead to lower building costs?

On May 23rd, 2022, I wrote a note about Lumber.

Within it I said, that Lumber…..

“It also tends to lead the S&P 500 in near-term peaks and troughs.”

“I also think it has been a handy barometer of inflation or at least scarcity of supply.

With today’s price trading down to that $570 support level mentioned in that note and also to its 200 week moving average, I don’t think Lumber’s price decline is over.


I think you can buy your timber 15% cheaper than today’s price.
$481 is my Buy price.

June 10, 2022

by Rob Zdravevski

rob@karriasset.com.au

Another reason to watch AUD/JPY

The Australian Dollar compared to the Japanese Yen is one of my favourite ‘risk appetite’ indicator.

The chart below shows it mirroring the CRB (commodities) Index.

The Yen is at its weakest point against the AUD in 7 years.

Against the U.S. Dollar, the last time the Yen that this week was 20 years ago.

And then the CRB is its highest level in 11 years.

Now, I’ll watch for a change in trend, a crossing of moving averages and break of support lines in the AUD/JPY.

If this occurs, then my thinking that inflation will abate and a retracement in recently hot commodities markets should follow.

June 10, 2022

by Rob Zdravevski

rob@karriasset.com.au

Aussie Dollar is telling me inflation will abate

A decline in tonight’s (Friday) U.S. Consumer Price Index (CPI) report will help confirm my thinking that inflation will abate.

Keep in mind, that the CPI figure is a lagging reading, which is why I’m posting a chart of U.S. inflation and the AUD/USD.

You’ll notice the symbiotic relationship until lately.

The AUD not rallying along with the rate of inflation tells me inflation will abate.

I believe currency (and credit) markets before anything else.

June 10, 2022

by Rob Zdravevski

rob@karriasset.com.au

A story about the AUD and the ASX 200

Check out the chart below.

It is the Australian Dollar (vs USD) laid over the ASX 200.

(AUD in blue and the ASX 200 is in orange)

Other than a couple divergences (in 2001 and 2013), this 30 year chart shows that these two prices generally move in lockstep.

Some people also call this an analog or correlation.

However, the content in this note carries a correlation to a note written earlier this week, where I state that the AUD may rise a little to close that divergence to commodity prices……

but the larger move should be seen with a decline in commodity prices.

If we see this evolve, the ASX 200 is vulnerable due to its large weighting to commodity and mining related companies.

This earlier note (below) about the Australian Dollar versus the Japanese Yen is also related.

https://robzdravevski.com/2022/06/01/aussie-yen-leads-the-spx-in-risk/

In the AUD/JPY case, we already have a very strong Aussie. The Yen is at a 20 year low and trading at extremes Oversold levels against many crosses.

The USD is inversely at Overbought levels.

So, the if the USD takes a break and declines a little, then the Yen rises against it.

In turn, the AUD stays supported by weaker USD, but stifled from any meaningful advance by a stronger Yen.

I see a ‘lid’ holding the AUD from rising significantly.

A rising Yen signifies a little equity risk is in the air and specifically, the sector which is the ‘frothiest’ are commodities.

Should we see commodities decline, inflation will take a breather and those companies producing ‘end-product’ will see cheaper ‘input’ prices.

So, not all is lost.

I’ll leave you with a chart showing the AUD/USD (the blue line) versus West Texas Intermediate (WTI) Crude Oil (in orange).

The AUD/USD would need to trade above 0.7670 before I entertain the possibility of a rally into the 80’s.

Otherwise, I’ll look for lower prices and mean reversion in a host of commodity prices before they decide their next move.

June 9, 2022

by Rob Zdravevski

rob@karriasset.com.au

AUD and Commodity prices aren’t in sync

Last week, I wrote about the relationship the S&P 500 has with the AUD/JPY currency cross.

The chart below shows the dance that the AUD/USD does with commodities prices.

To be specific, it’s with the CRB Index which tracks a basket of 19 commodities being, Aluminium, Cocoa, Coffee, Copper, Corn, Cotton, Crude Oil, Gold, Heating Oil, Lean Hogs, Live Cattle, Natural Gas, Nickel, Orange Juice, RBOB Gasoline, Silver, Soybeans, Sugar and Wheat.

Generally, when commodity prices rise, so does the Australian Dollar (especially against the U.S. Dollar)

It hasn’t been doing so lately.

What’s wrong?

Why the divergence?

Which index or price is the one to believe?

I think that overall, commodities prices will decline.

In the CRB’s case, perhaps by 25%, down to the 240 point region.

While the AUD/USD may converge up to a limit of 0.7640, but compared to its current level of 0.7180 it’s not a compelling bet. It’s more of something to watch should that price suit your strategic investment or corporate purposes.

June 7, 2022

by Rob Zdravevski

rob@karriasset.com.au

And now it’s the ‘mother’ of a peak in Natural Gas

On April 30, 2021, I wrote a note about the ‘mother’ of all breakouts.

The topic was about the price of Natural Gas.

At that time, Natural Gas was trading at $3.00.

The note (see link below) showed a pending trend reversal in a 20 year chart, not some little 3 week observation.

Then, the July 22, 2021 note was telling readers about taking some profits at $4.07

then on October 6, 2021, I wrote about selling the remainder of the position at $6.25

In the first chart below, I have placed annotations which follow the timeline of each of these posts.

Following the October 6, 2021 call of selling the balance of the position, the price of Natural Gas nearly halved within 3 months, falling to $3.54.

Whether it was the markets way of correcting a parabolic move or sorting out the ‘unnatural’ owners and late-comers, the price decline didn’t satisfy and reach my re-entry points and so…….I didn’t re-enter the trade.

Today, the Henry Hub Natural Gas price is $9.50

From the New Year low of $3.54 (this timing coincided with the peak in the S&P 500), Natural Gas performed a second surge to the current price of $9.50.

There is no crying over spilt milk here !

All within 12 months, the Natural Gas price doubled, then halved, then tripled….

Hardly normal stuff.

But I will now call the opposite of my April 30, 2021 note,

with my various indicators coupled with fundamental observations, 

for whether Henry Hub Natural Gas trades at $9.50 or $10.50, heed the extreme in this pendulum.

It’s the now looking like the ‘mother’ of all peaks.

The 20 year chart is below.

June 7, 2022

by Rob Zdravevski

rob@karriasset.com.au

SPX not at an extreme

I’m re-visiting my notes written in October 2021 and late December 2021, when the S&P 500 was reacquainting itself with historically high percentages it was trading above its 200 week moving average.

In the chart below, the S&P 500 isn’t touching those ‘extreme’s anymore.

This is a function of the mean ‘rolling higher’ and a healthy decline in the index.

Incidentally, since mid October 2021, that 200 week moving average has moved from 3,210 to its current reading of 3,500.

The S&P 500 is now ‘only’ 17% above that very long term mean, as seen in the chart below.

June 6, 2022

by Rob Zdravevski

rob@karriasset.com.au