On the eve of last quarter’s earnings season (on January 26th, 2022) I wrote a newsletter citing Alphabet (Google’s) earnings as being important and setting the course for technology stock price action.
The charts contained within that newsletter featured some support lines that some of the FAANGM stocks were still holding above.
Google has now broken below that support line as has Microsoft, while Apple remains barely above its.
My previous quips have mentioned the weighted importance that these stocks have in the Nasdaq 100 and S&P 500. The recent pullback of these goliaths (following their dead cat bounce) explains the 7% decline in the Nasdaq 100 over the past 3 weeks.
Alphabet (Google) reports earnings April 26th.
Apple reports on April 28th.
There is good probability that these stocks fall further, much like other high-flyers have and some of their FAANGM brethren.
Mean Reversion is a big theme of mine and it is a warning to heed in a market (and world) which thinks prices only travel in a one-way direction.
Whilst valuation and fundamentals matter and the pricing of an asset already takes that into account, the price action of the asset is something else to observe when ‘animal spirits’ sends it to the edges of its normal trading range or price distribution.
So, in Alcoa’s case, it is difficult to convince one self to buy the shares at this level.
And if you do, at least recognise that you may be the marginal buyer.
In the chart below, you’ll see Alcoa is stretched above a significant long term measure that I use, being the 200 Week Moving Average.
This is one study I use to illustrate moments of ‘extremes’.
Alcoa has never traded at 220% above its 200 week moving average.
In fact, a price which is 60% above (or below) its 200 week moving average is about the extent of the equity price ‘elastic’.
So, what’s next;
Although the current 200 week moving average is currently at $31, its not so clear to expect the price of Alcoa shares to simply fall and mean revert to that level.
The recent parabolic price move means that this mean will “roll higher” at a reasonably faster pace than normal.
We should see the price of Alcoa and its 200WMA converge to somewhere near the $55 mark.
This also suggests holders of Alcoa stock manage their risk (i.e. selling, hedging)
From a corporate perspective, it’s prudent for Alcoa to use its ‘inflated’ currency (being its shares) to either raise capital, restructure debt or to make acquisitions.
The following assets (on a weekly timeframe) registered an Overbought reading or traded more than 2.5 standard deviations above its rolling mean.
Extremes “above” the Mean (at least 2.5 standard deviations)
U.S. Dollar Index (DXY)
Overbought (RSI > 70)
Australian 2, 3, 5 & 10 year government bond yields
Greek, Spanish, French, Italian, British, Swedish, Portuguese, New Zealand, Swiss, Canadian & Korean 10 year government bond yields
German 5 and 10 year yields
U.S. 2, 5 & 10 year yields
Bloomberg Commodity & CRB Index
Cotton
Uranium
Corn
AUD/JPY
TBX
The Overbought Quinella – Both Overbought and Traded at > 2.5 standard deviations above the weekly mean)
TBT
U.S. 10 year minus German 10 year bond yield spread
China Coal
Natural Gas
Orange Juice
Istanbul’s BIST equity index
USD/JPY
Assets (securities) which touched the other side of the extreme, being Oversold (where the RSI is < 30) or were at least 2.5 standard deviations below its mean are;
Extremes “below” the Mean (at least 2.5 standard deviations)
None
Oversold (RSI < 30)
TLT
IEF
China’s CSI 300
JPY/AUD
HKD/USD
The Oversold Quinella – Both Overbought and Traded at > 2.5 standard deviations above the weekly mean)
JPY/USD
Notes & Ideas:
The big news for the week remains in the bond market.
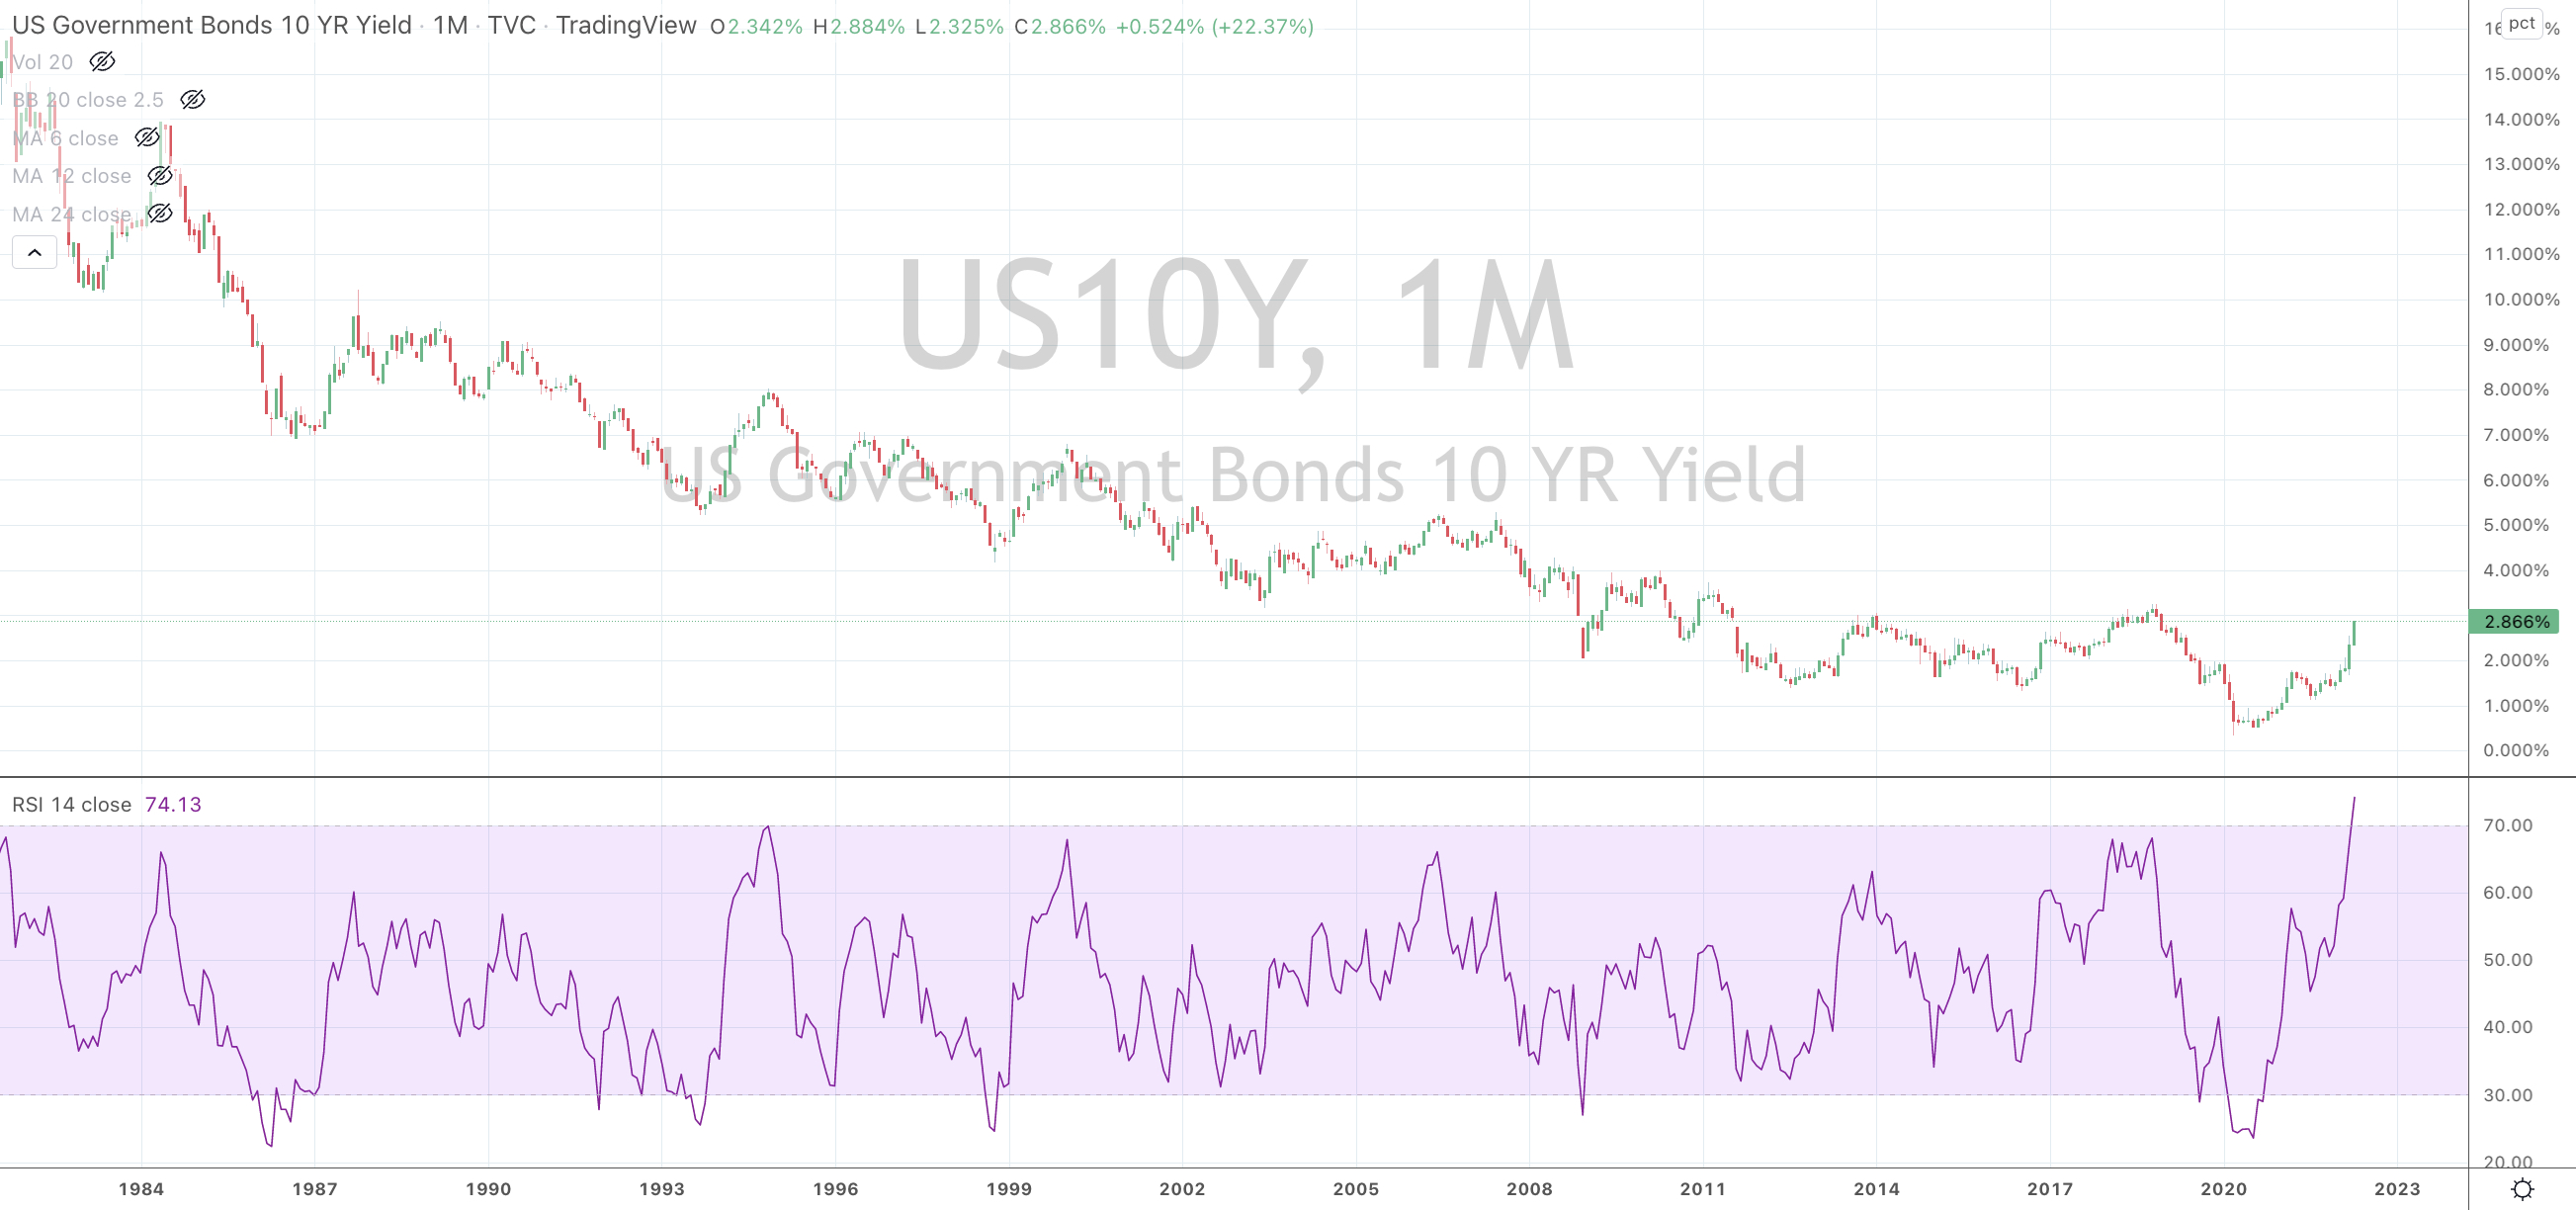
Major government 10 year bond yields are overbought. The oversold levels of the Bond ETF’s are helpful tools to use to confirm this overbought bond yield status.
Such overbought levels in the U.S. 10 year are notable that it has never been so, in the 40 years of data appearing in the chart below. It’s so meaningful, that the chart below is a Monthly chart and not my normal series of Weekly charts.
The inverted U.S. yield curve inverted I son longer news. As I wrote last week, “Much noise (once again) for not much substance. Curves needs to invert more than a few days before probability stacks up for a future recession call.”
Last week, I also cited a bullish outside reversal in the yield curves.
Pundits are commenting that the Stockmarket doesn’t seem to care about the rising yields which implies danger, as the bond market is something we tend to respect more than equities.
In a future post, I’ll discuss the reason for this, where I’ll illustrate real yields being more relevant than nominal yields, especially when compared to the earnings yield of equities.
Furthermore, this post, talks about my take on the yield curve
In short, the S&P 500 rallied for 15-20 months after than inversion but I think the added weight to an advance in the equities market is summarised in the last paragraph of that newsleter.
It’s the quantum of the rate rise that is fascinating.
In the real world, if your mortgage repayments double and corporate debt repayments triple and the servicing of government interest quadruples, surely some pressure will be felt.
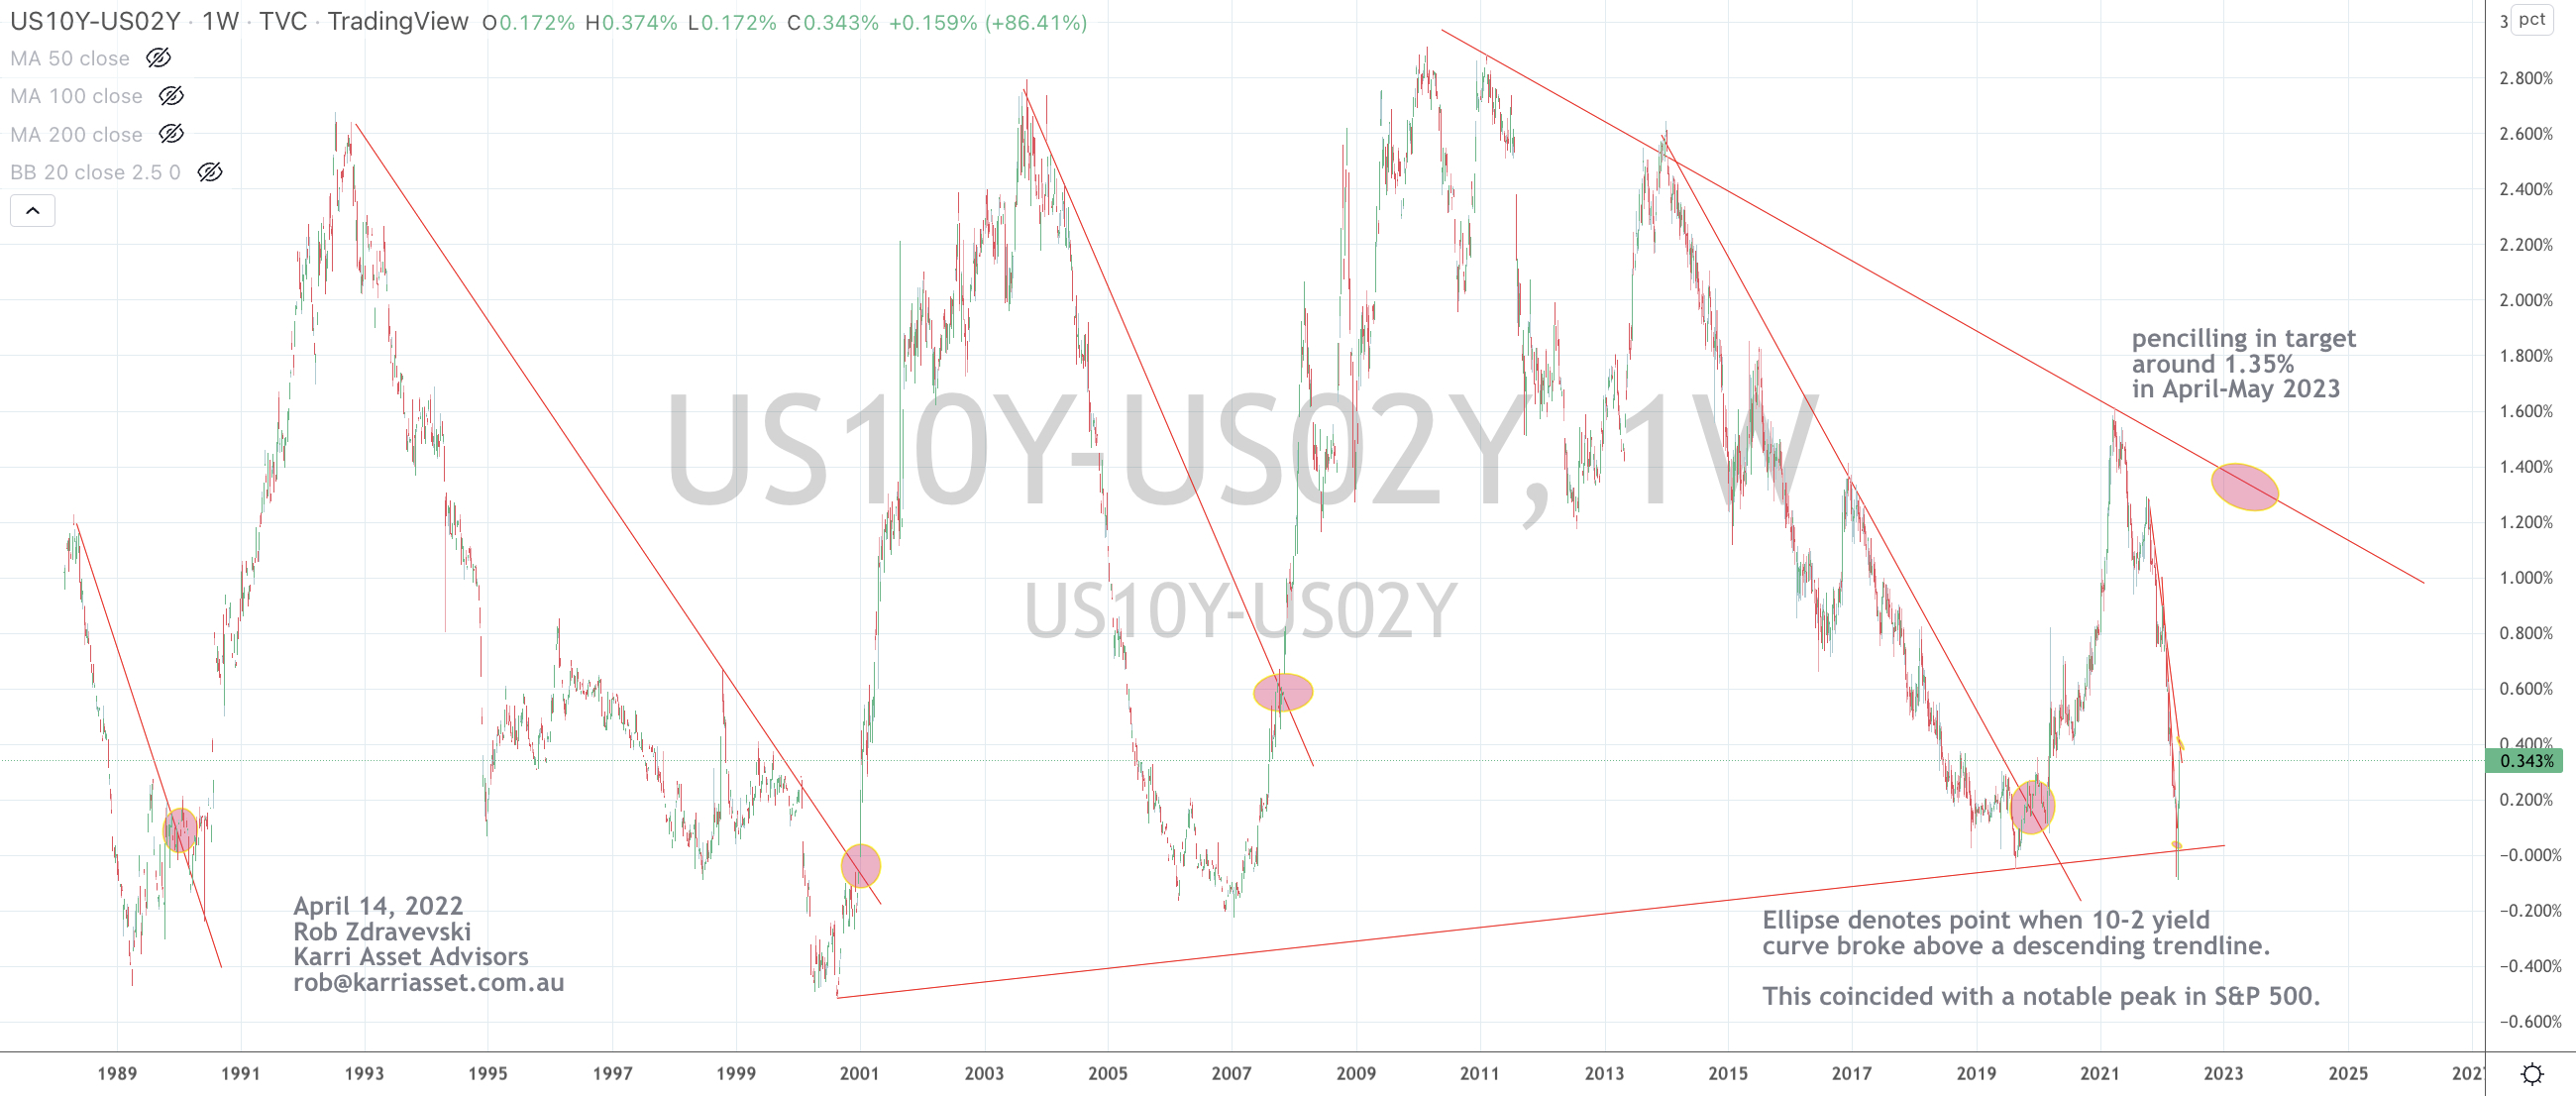
Nonetheless, the chart below of the U.S. yield curve will be good to keep handy.
The circles denote moments when the curve (the spread) broke above a notable downward sloping trendline which happened to coincide with a peak in the S&P 500 occurring within the next month or so.
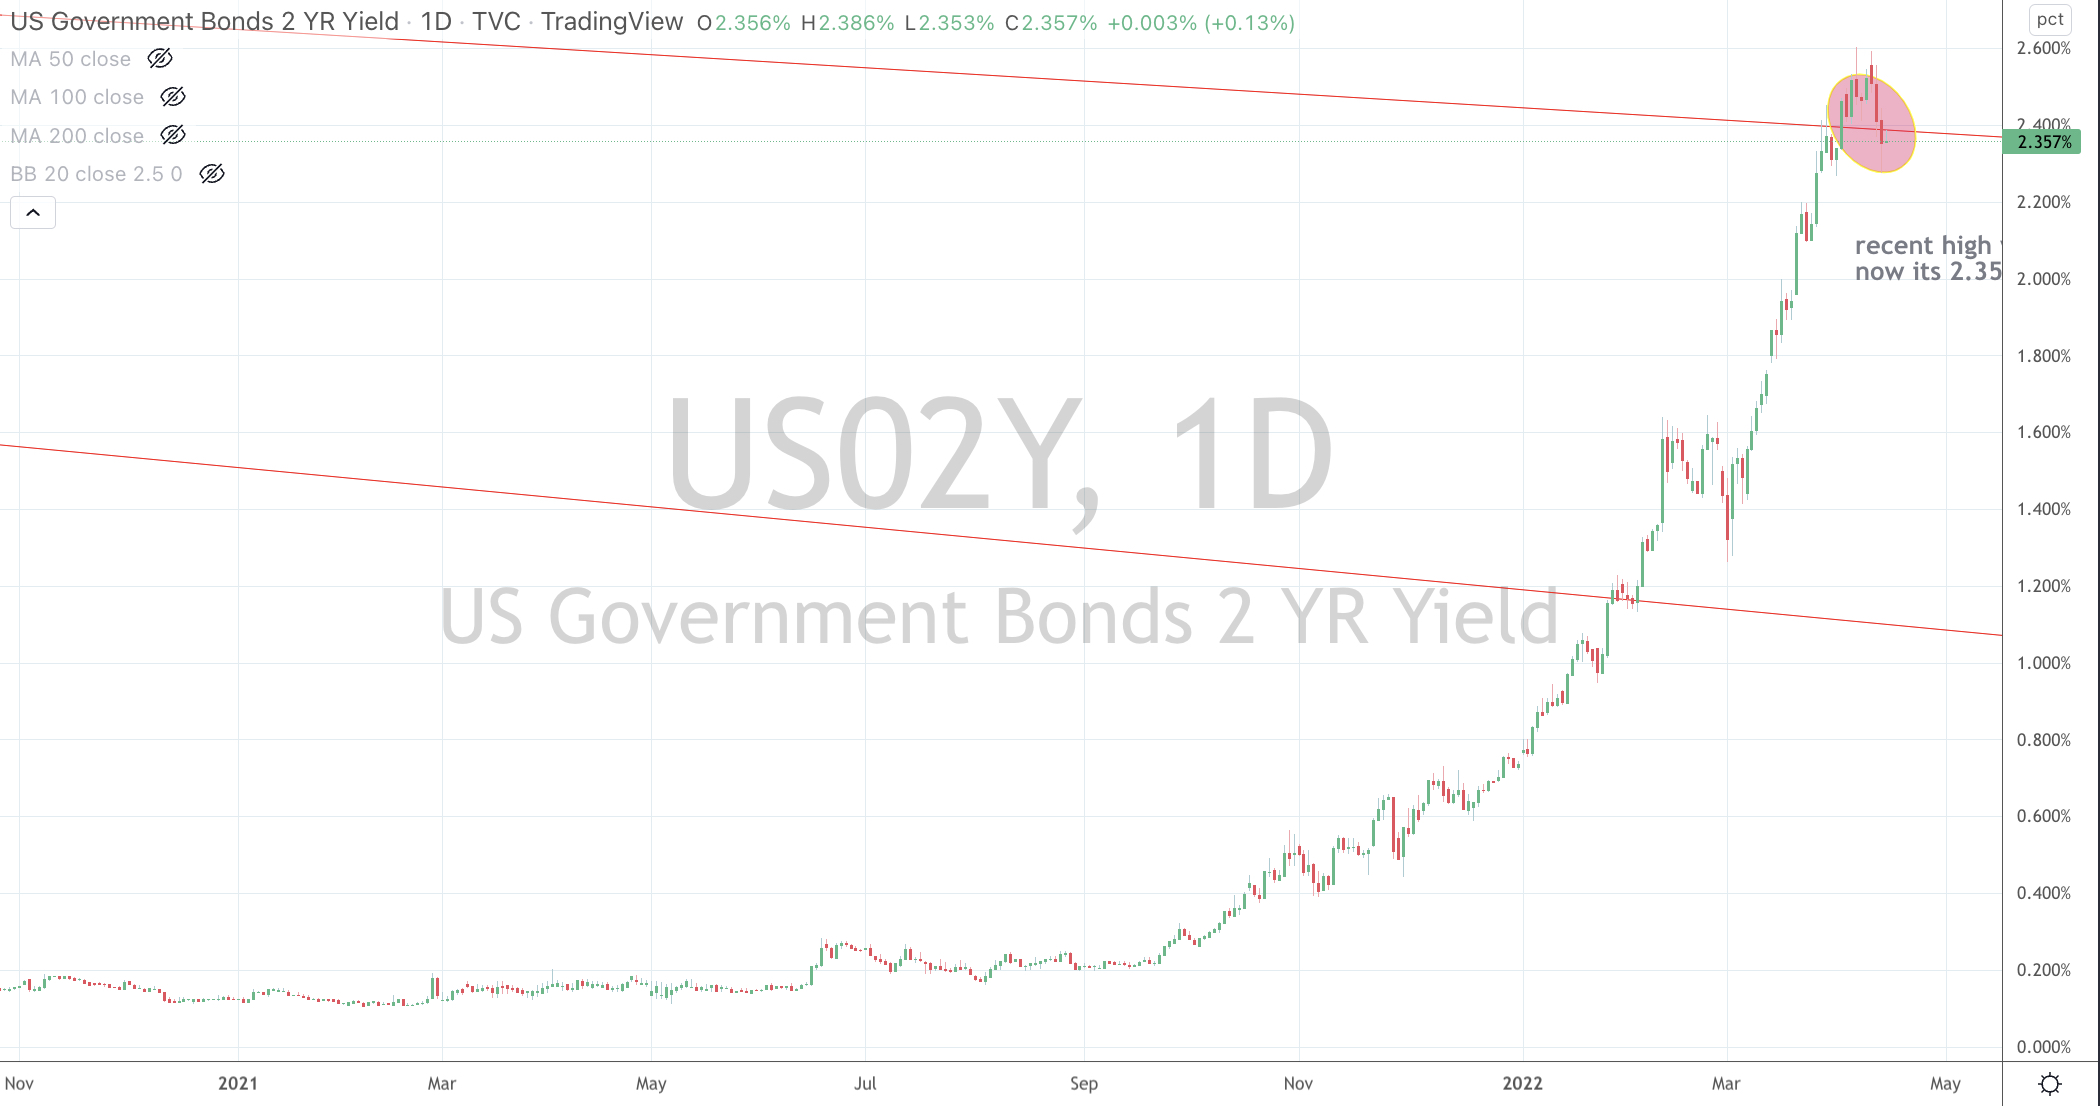
In one chart below, you’ll see the amazing 10 fold rise and steepness of the U.S. 2 year bond yield. It’s obvious that the market has factored many Fed rate rises.
I think it is factoring in too many and perhaps the market is concurring with the predictions of 6, 7 or 8 rate hikes.
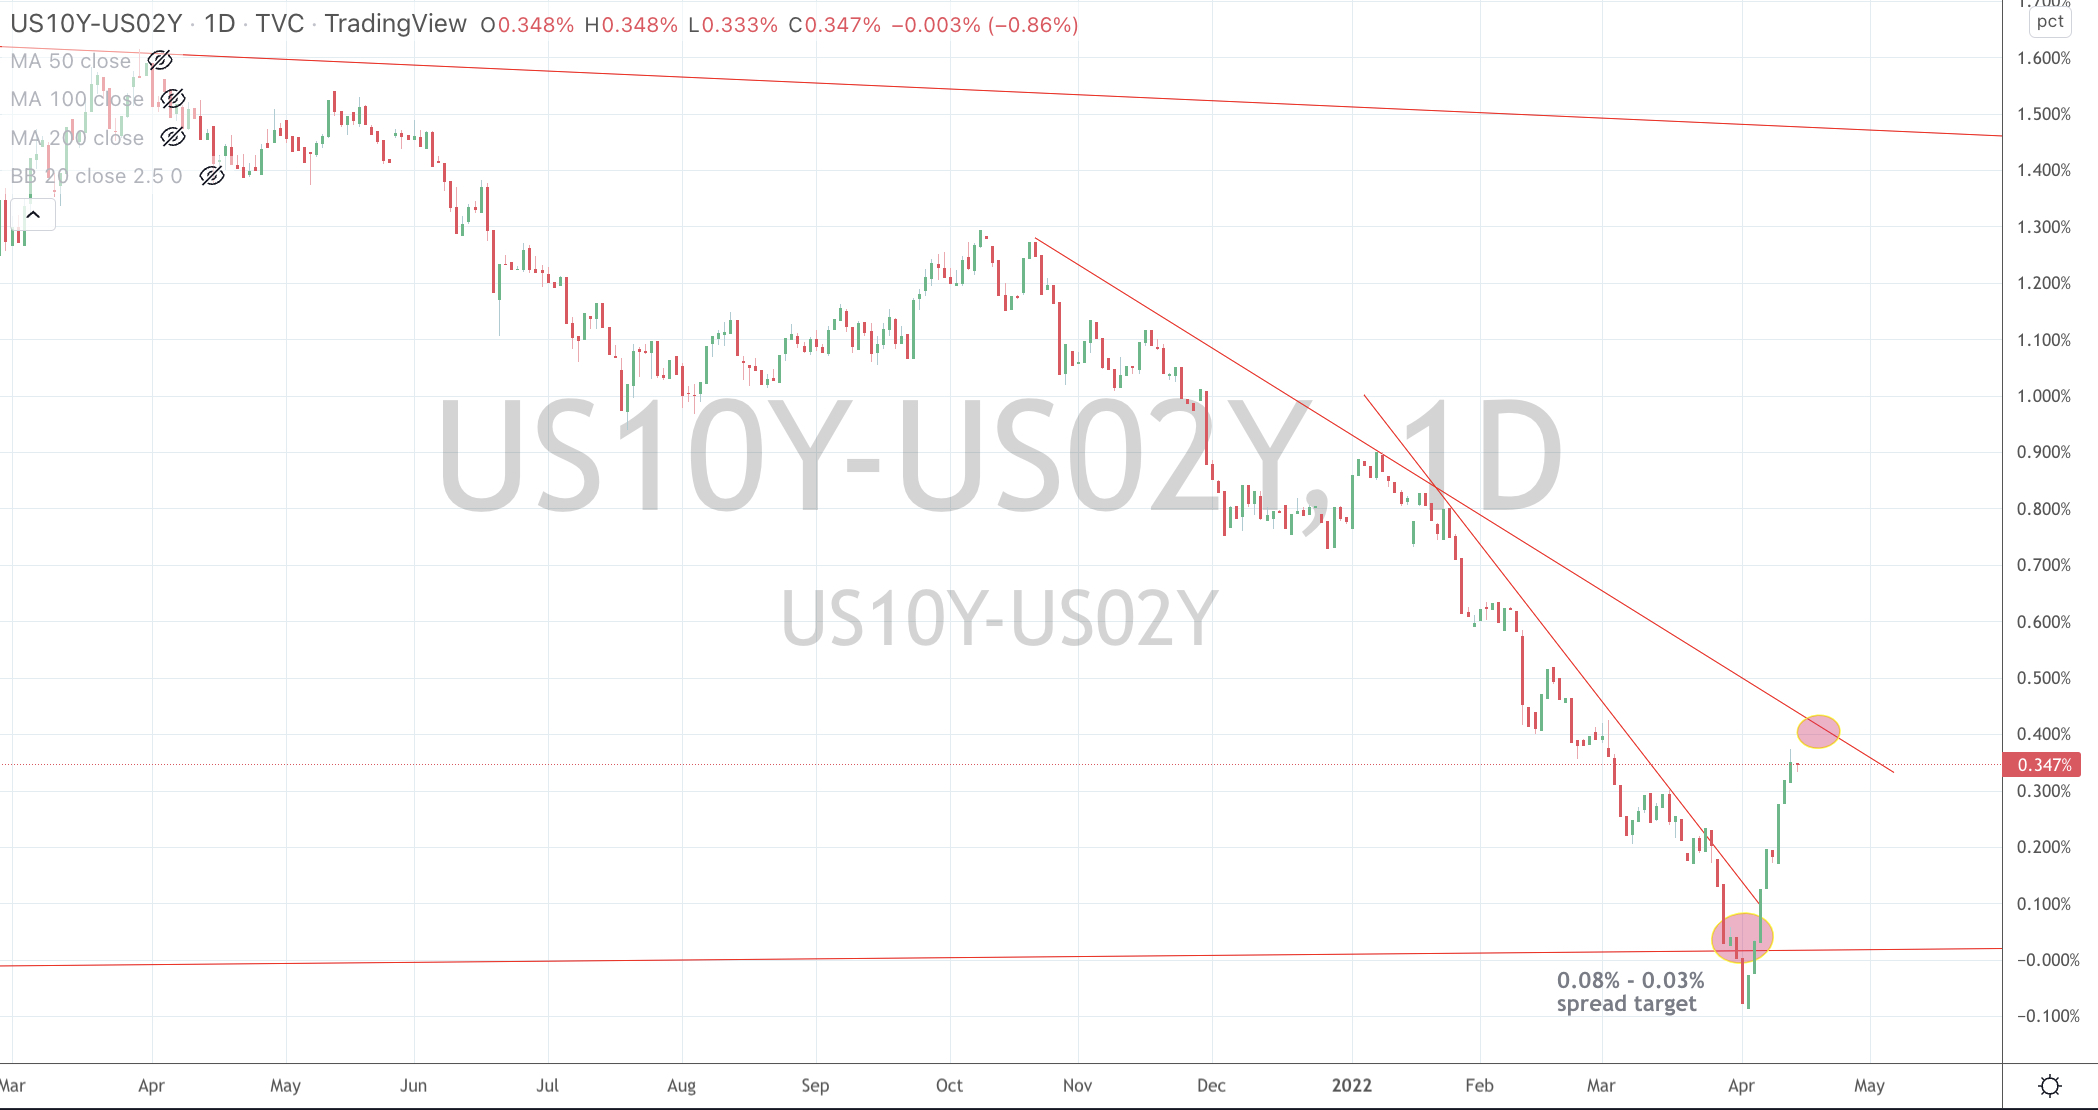
The other chart shows the yield curve inverting for a whole 2 days. That’s hardly long enough to signal a recession, but since then it has steepened to 0.35%.
It has occurred because the front end of curve (2 years) has declined from 2.59% to 2.35% faster (‘greater’) than the 10 year yield.
This bullish steepener is good for equities.
I’m looking for the spread to initially visit 0.40%
It tells us that inflation may be peaking, which is my belief.
And it tells us that the market is considering that the Fed may not aggressively in raise rates as the market participants have previously hinted.
My position is that the Fed may hike 2 or 3 times and then cut once for they may have gone too far.
Nothing notable to report in the overall drilling rig count numbers, but specifically the Canadians reduced the amount of rigs in operation by 16%.
Let’s see what the April 2022 report looks like, when crude prices were higher. We’ll check if there was any conviction in starting up any new activity.
The following assets (on a weekly timeframe) registered an Overbought reading or traded more than 2.5 standard deviations above its rolling mean.
Extremes “above” the Mean (at least 2.5 standard deviations)
U.S. 10 year minus German 10 year bond yield spread
Natural Gas
Orange Juice
AUDUSD
CADUSD
AUDSGD
TBT
Overbought (RSI > 70)
Australian 2, 3,5 & 10 year government bond yields
Greek, Spanish, French, Italian, Portuguese, New Zealand, Swiss, French, Canadian & Korean 10 year government bond yields
German 5 and 10 year yields
U.S. 2, 5 & 10 year yields
Bloomberg Commodity & CRB Index
Uranium
Corn
The Overbought Quinella – Both Overbought and Traded at > 2.5 standard deviations above the weekly mean)
Swedish 10’s
TBX
AUDGBP
AUDJPY
Assets (securities) which touched the other side of the extreme, being Oversold (where the RSI is < 30) or were at least 2.5 standard deviations below its mean are;
Extremes “below” the Mean (at least 2.5 standard deviations)
Gold Volatility Index
Bond ETF’s TLT & IEF
Oversold (RSI < 30)
HKD/USD
Russia’s MOEX Index
The Oversold Quinella – Both Overbought and Traded at > 2.5 standard deviations above the weekly mean)
JPY/USD
U.S. 10 year minus 5 year government bond yield spread (which has now inverting and at lowest since September 2000.
Notes & Ideas:
The big news for the week was in the bond market (as 10 year yields touch and tickle overbought extremes.
The U.S. yield curve inverted for a couple days and now it isn’t. Much noise (once again) for not much substance. Curves needs to invert more than a few days before probability stacks up for a future recession call.
In fact, we saw a bullish outside reversal week for the US10-02 spread and the US10-05 spread, along with the Swiss 10’s and Rotterdam delivered coal price.
The other big news is in the currency market, especially the divergence being seen in the currencies of the commodity sensitive economies of Australia and Canada.
The AUD and CAD are hitting highs against many currencies whilst the USD is also marking its own highs. These two moments seldom occur at the same time.
We’re also seeing multi-year weakness in the Yen and the Euro is getting a drubbing.
It was a mild week amongst the major global equity indices as the ASX 200 only fell 0.2% and the S&P 500 declined 1.3%, while some sub U.S. indices did see outlier weakness such as the SOX, the Russell 2000 and MidCap 400.
In expected news, the AUDEUR, the DXY and Oslo bourse are nearing overbought extremes.
Meanwhile, Bitcoin and Ethereum fell 8% for the week, meanwhile Cardano remains 67% below its September 2021 high.
Speaking of 67%, Istanbul’s BIST 100 has risen 67% since September 2021.
The larger advancers over the past week comprised of;
Rotterda, Coal 11.2%, Bloomberg Commodity Index 2%, Cocoa 2.9%, Natural Gas 9.8%, Orange Juice 6.4%, Palladium 6.7%, Sugar 5.4%, CRB Index 1.7%, Urea 2.5%, Uranium 9%, Corn 4.6%, Oats 7.4%, Soybean 6.7%, Wheat 6.8%, Swiss SMI 2.7%, FTSE 100 rose 1.8%, Istanbul surged 5.3% (up 20% in past 5 weeks) and Australia’s ASX 200 advanced 1.2%.
The group of decliners included;
Aluminium (3.6%), Australian Coal (12.6%, now down 37% in past 3 weeks), Baltic Dry Index (12.8%), China Coal (2.7%), Gasoil (6.9%), Gold Volatility Index (3.7%), Lean Hogs (2.3%), Heating Oil (3.1%), Hot Rolled Coil Steel (3.3%), JKM (3.1%), LNH (12.6%), Rubber (3.1%), Dutch TTF Gas (7.4%), Brent Crude (2%), KBW Banking Index (2.3%), CAC (2%), Dow Jones Transports (6.7%), Bovespa (2.7%), MOEX (6.1%), Nasdaq 100 fell 3.6%, Nikkei 225 (2.5%), TAIEX (1.9%), Russell 2000 (4.6%), Philadelphia Semiconductor Index “SOX” (7.3%), S&P Midcap 400 3.4%0 and S&P 500 declined 1.3%.
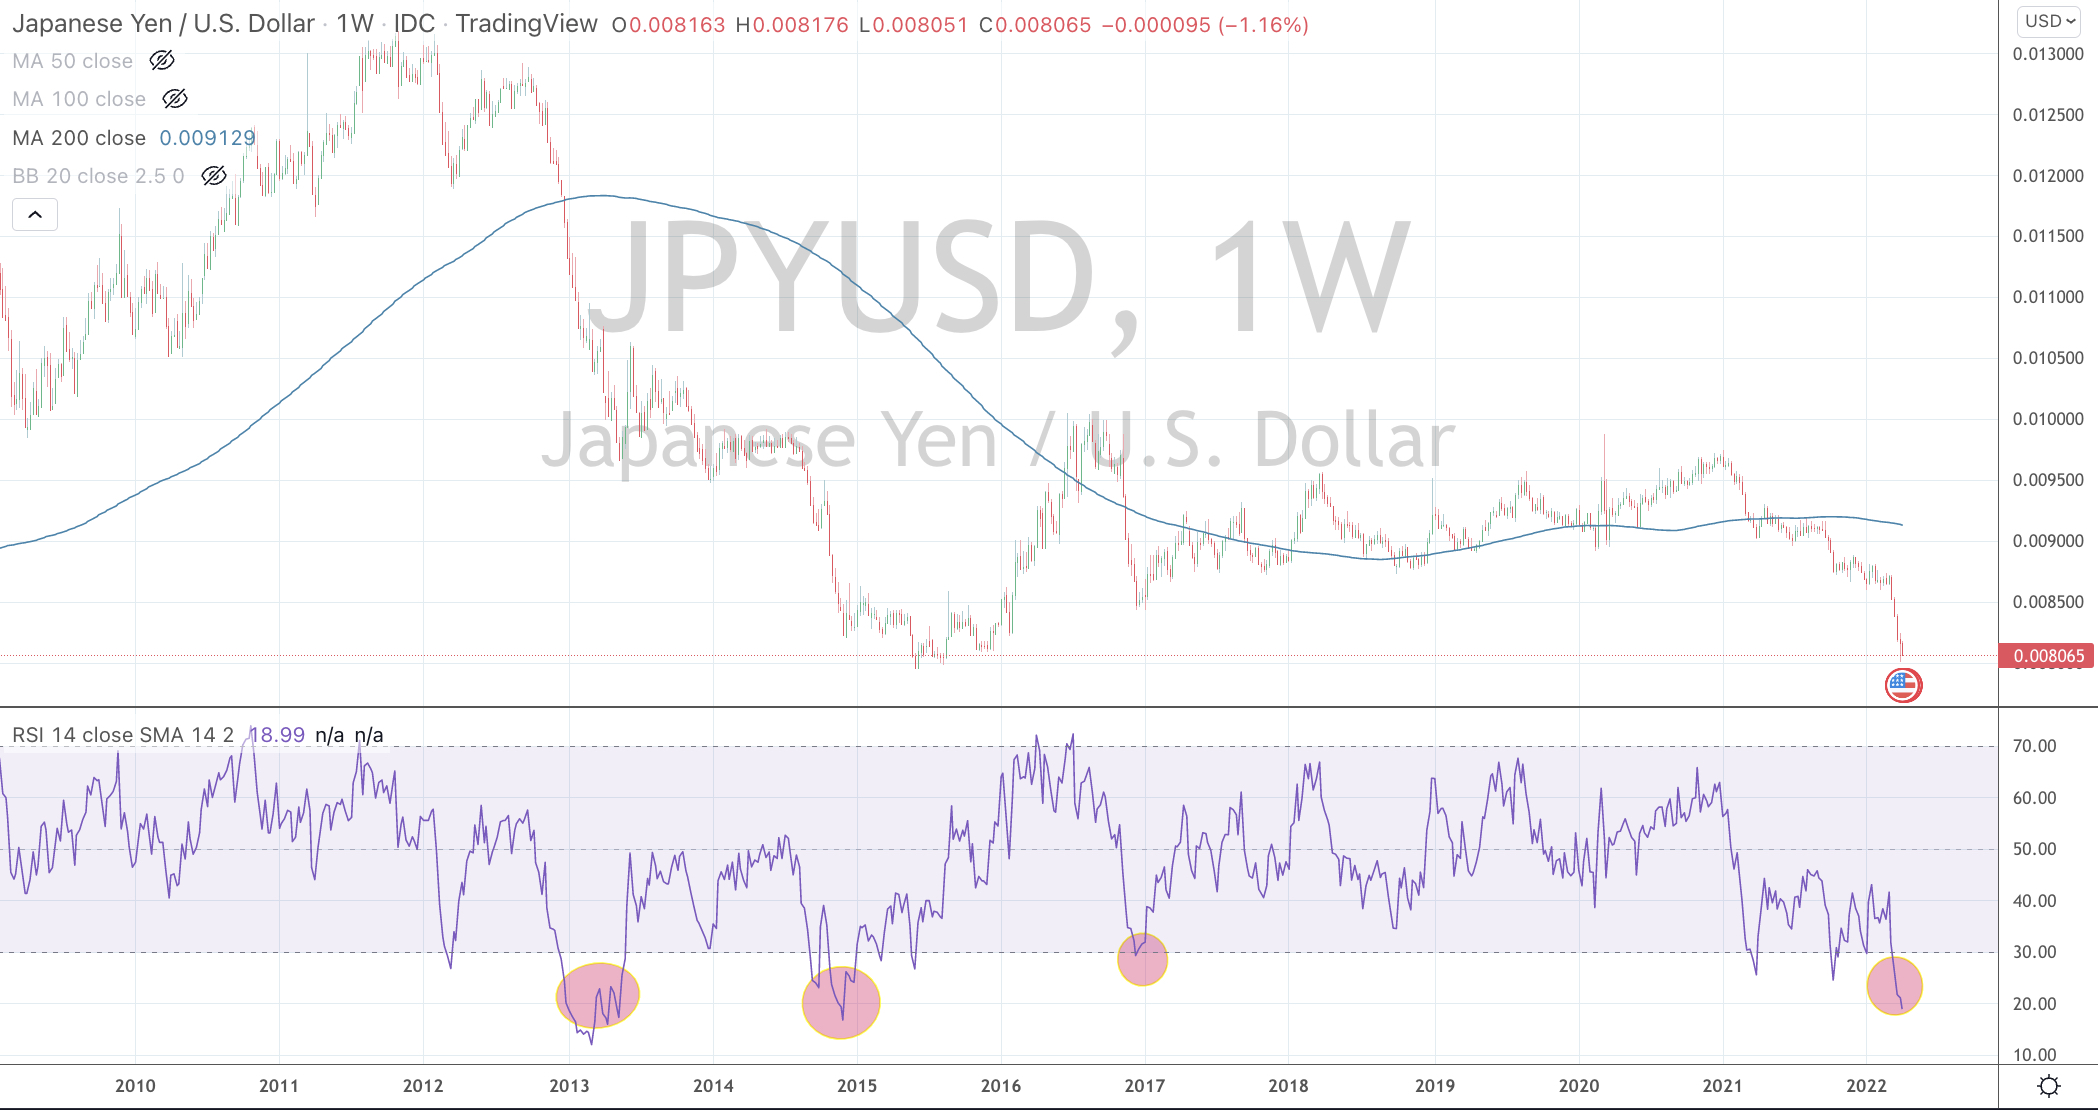
The Japanese Yen is at its weakest in 6 years against the Aussie and the U.S. Dollar.
In the chart below, I’ve circled 4 moments since 2009 when it was decidedly Oversold, trading at extended percentages below its 200 week moving average and at 2.5 standard deviations below its rolling weekly mean.
Buying some Yen is the first step,
nibbling away at some cheap Japanese equities is the next.