Being ahead of the ‘curve’
April 14, 2022 Leave a comment
In March 2021, I wrote this newsletter which studied what happened to the S&P 500 after the yield curve inverted.
https://mailchi.mp/karriasset/quadrupling-yields-increases-equities-risk-2
In short, the S&P 500 rallied for 15-20 months after than inversion but I think the added weight to an advance in the equities market is summarised in the last paragraph of that newsleter.
It’s the quantum of the rate rise that is fascinating.
In the real world, if your mortgage repayments double and corporate debt repayments triple and the servicing of government interest quadruples, surely some pressure will be felt.
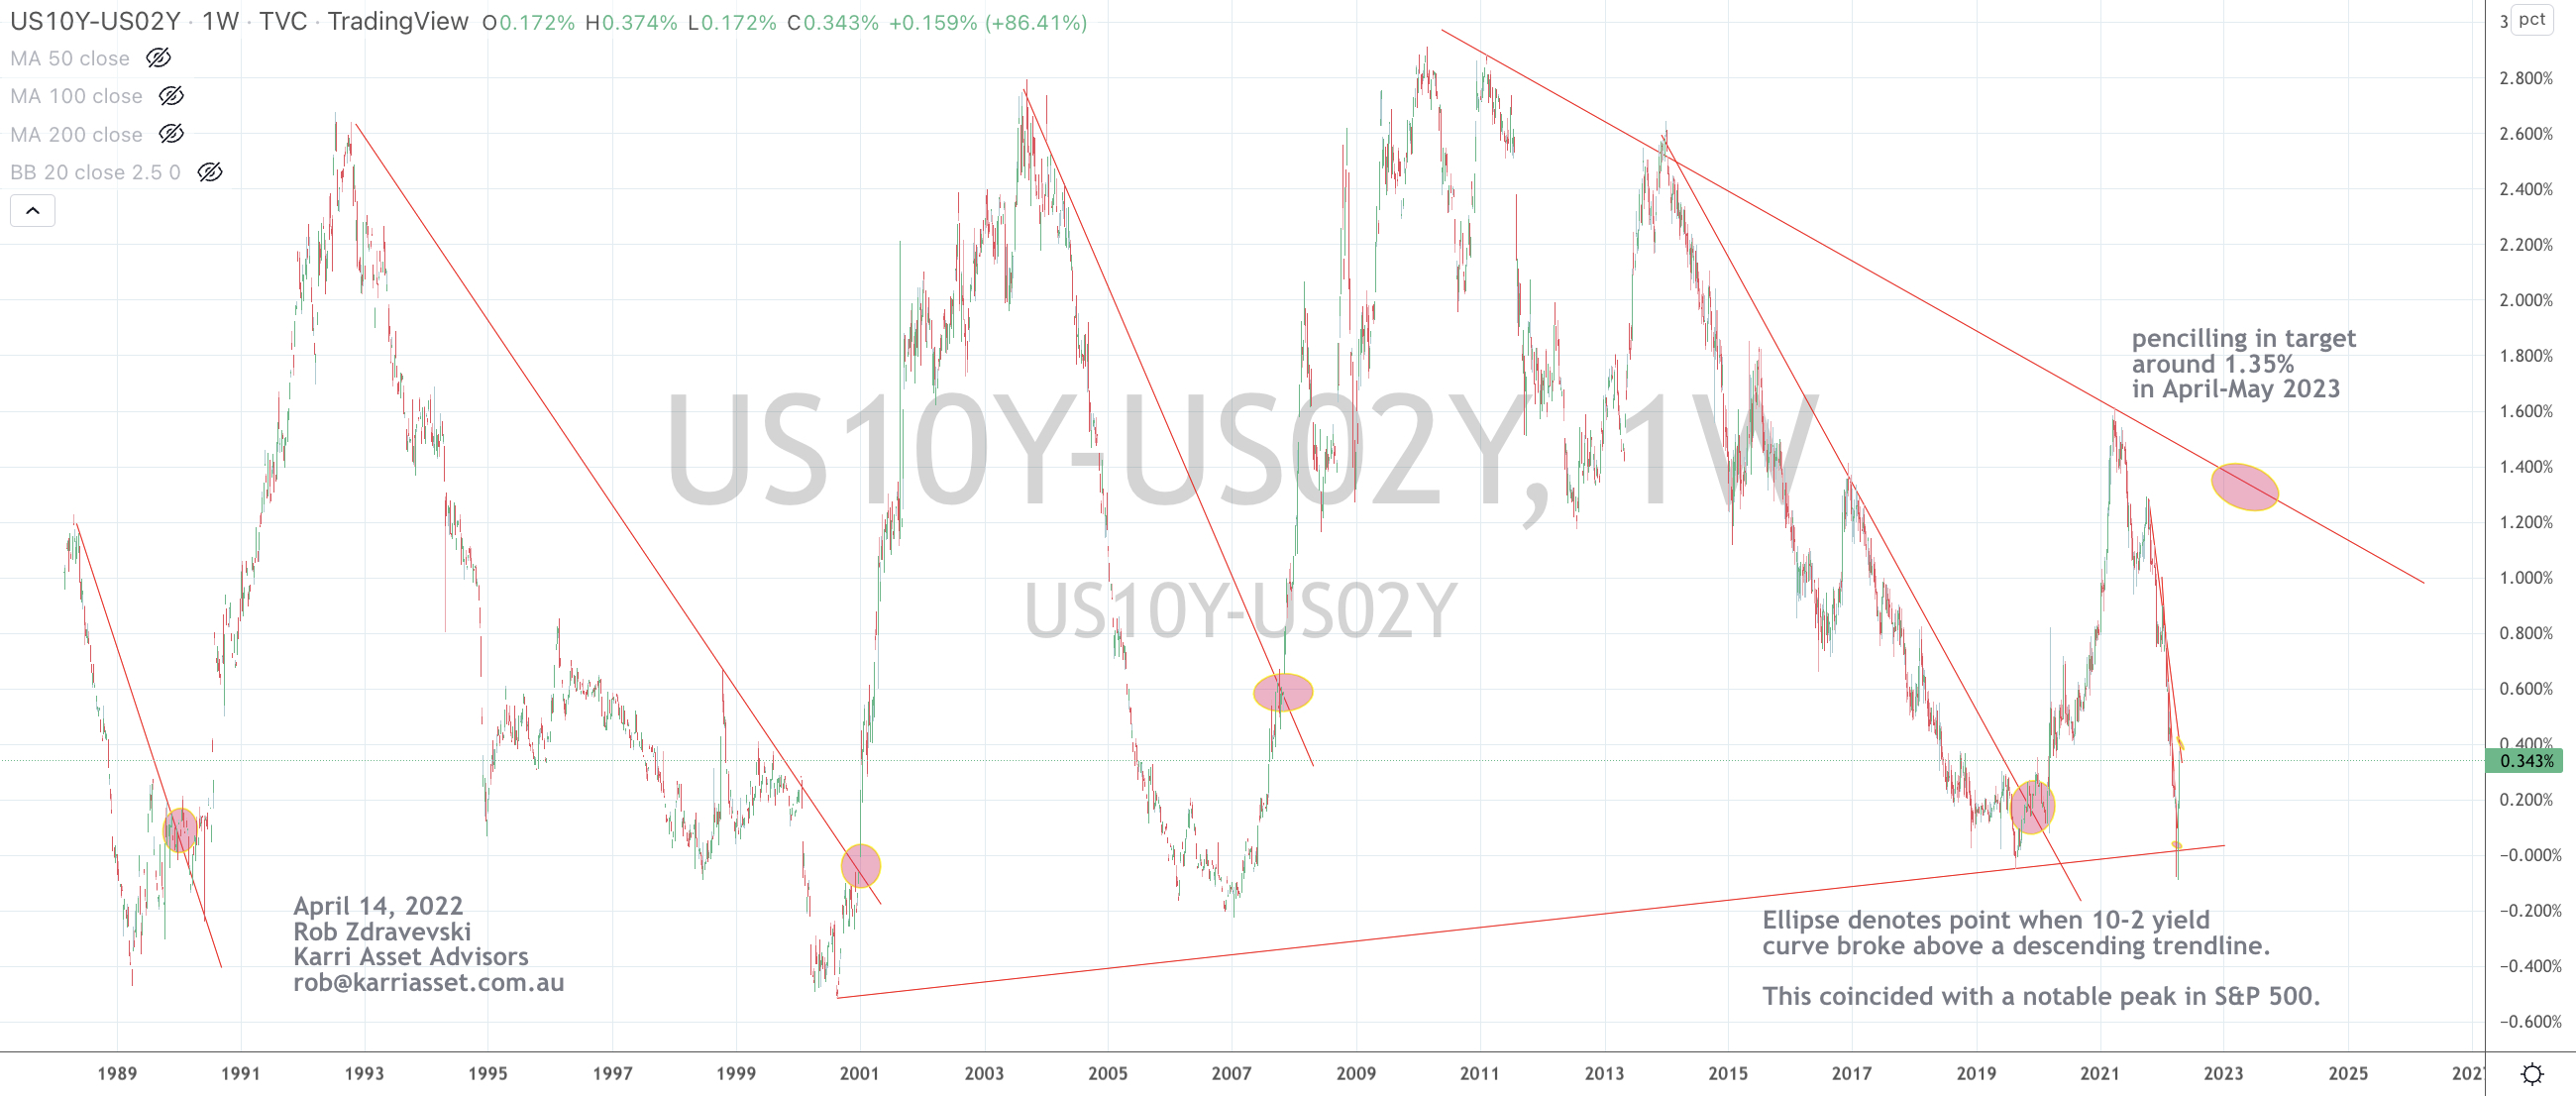
Nonetheless, the chart below of the U.S. yield curve will be good to keep handy.
The circles denote moments when the curve (the spread) broke above a notable downward sloping trendline which happened to coincide with a peak in the S&P 500 occurring within the next month or so.
April 14, 2022
by Rob Zdravevski
rob@karriasset.com.au