The following assets (on a weekly timeframe) registered an Overbought or Oversold reading and/or have traded more than 2.5 standard deviations above or below its rolling mean.
Extremes “above” the Mean (at least 2.5 standard deviations)
Cotton
EUR/GBP
Overbought (RSI > 70)
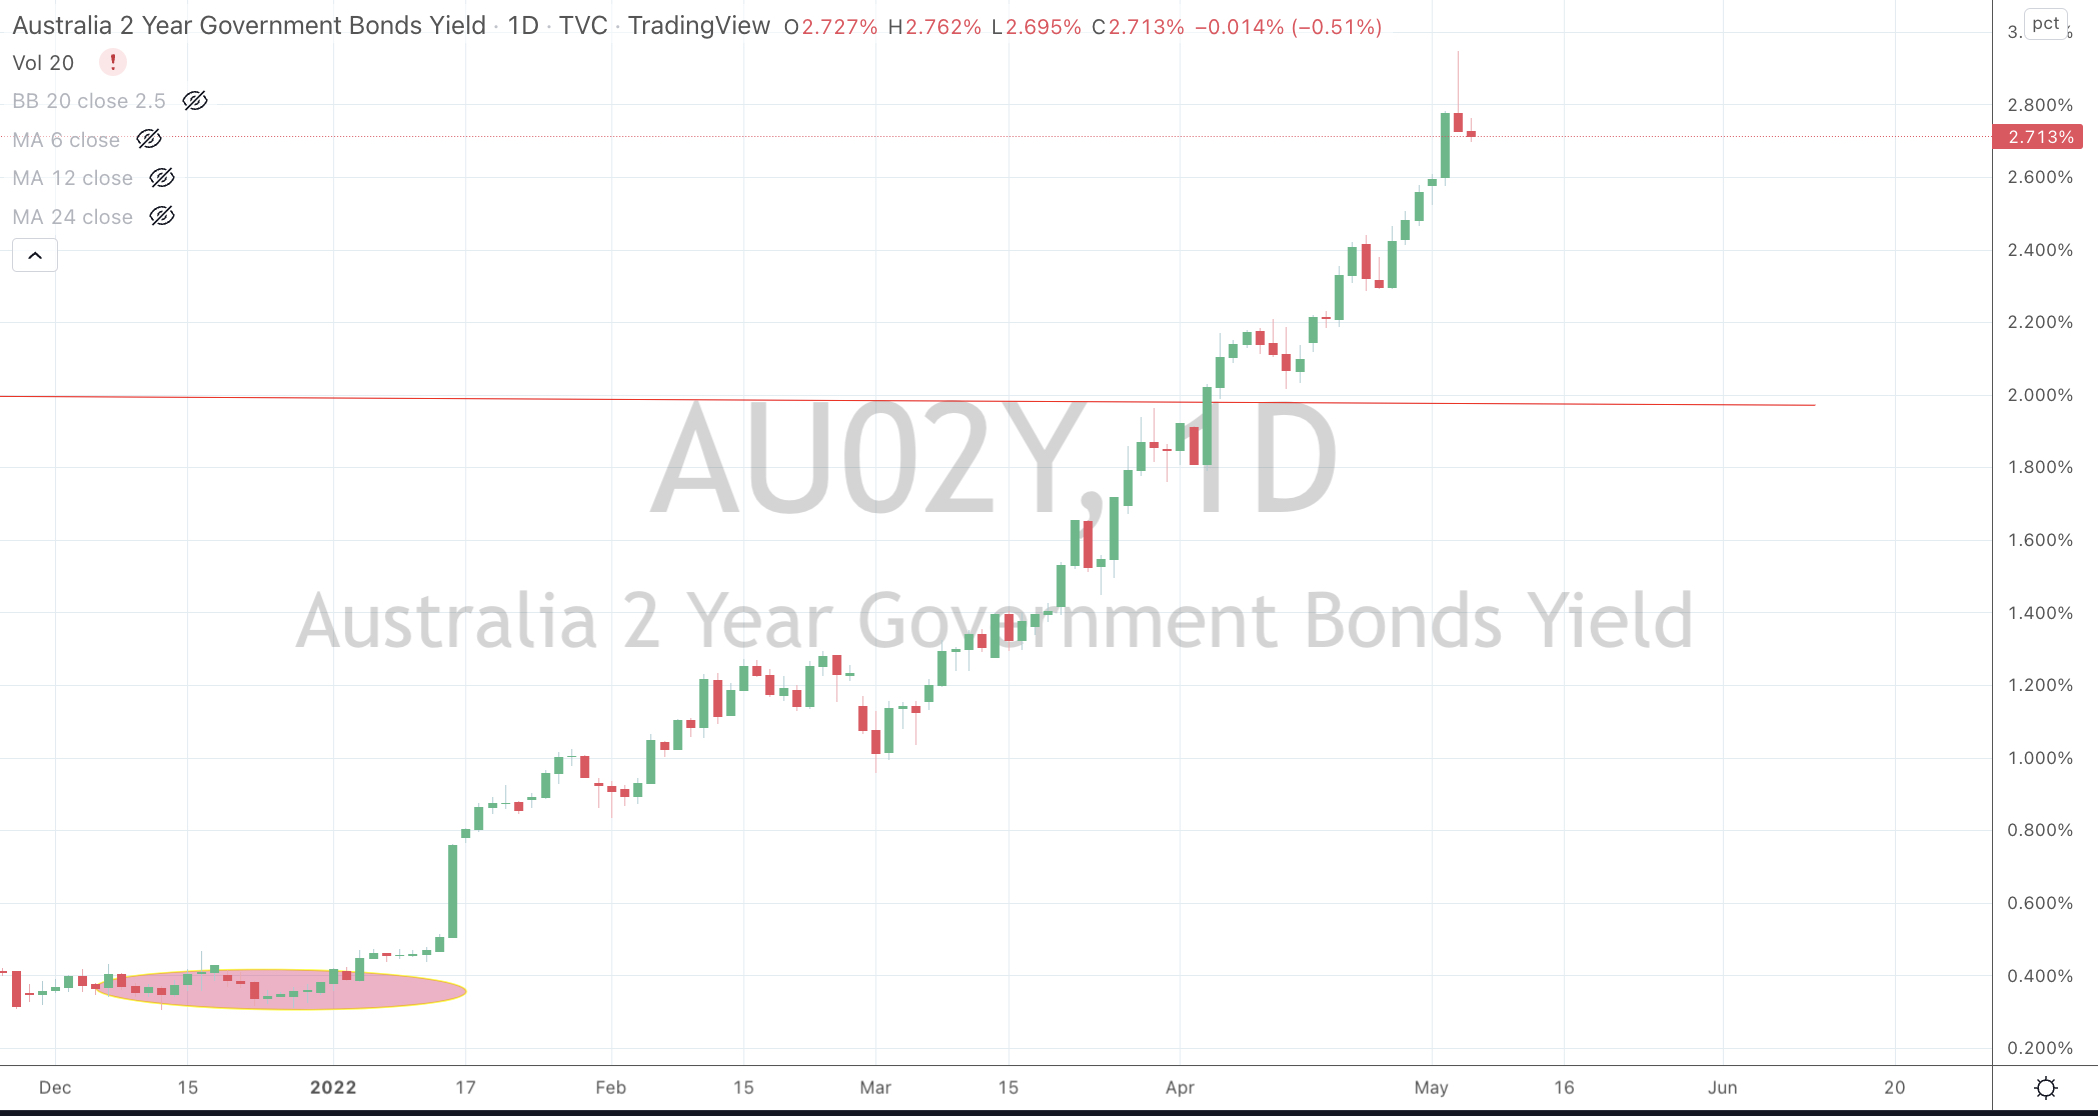
Australian 2, 3, 5 & 10 year government bond yields
Canadian, Spanish, French, Greek, British, Italian, Korean, Swedish, Portuguese and New Zealand 10 year government bond yields
German 2, 5 and 10 year yields
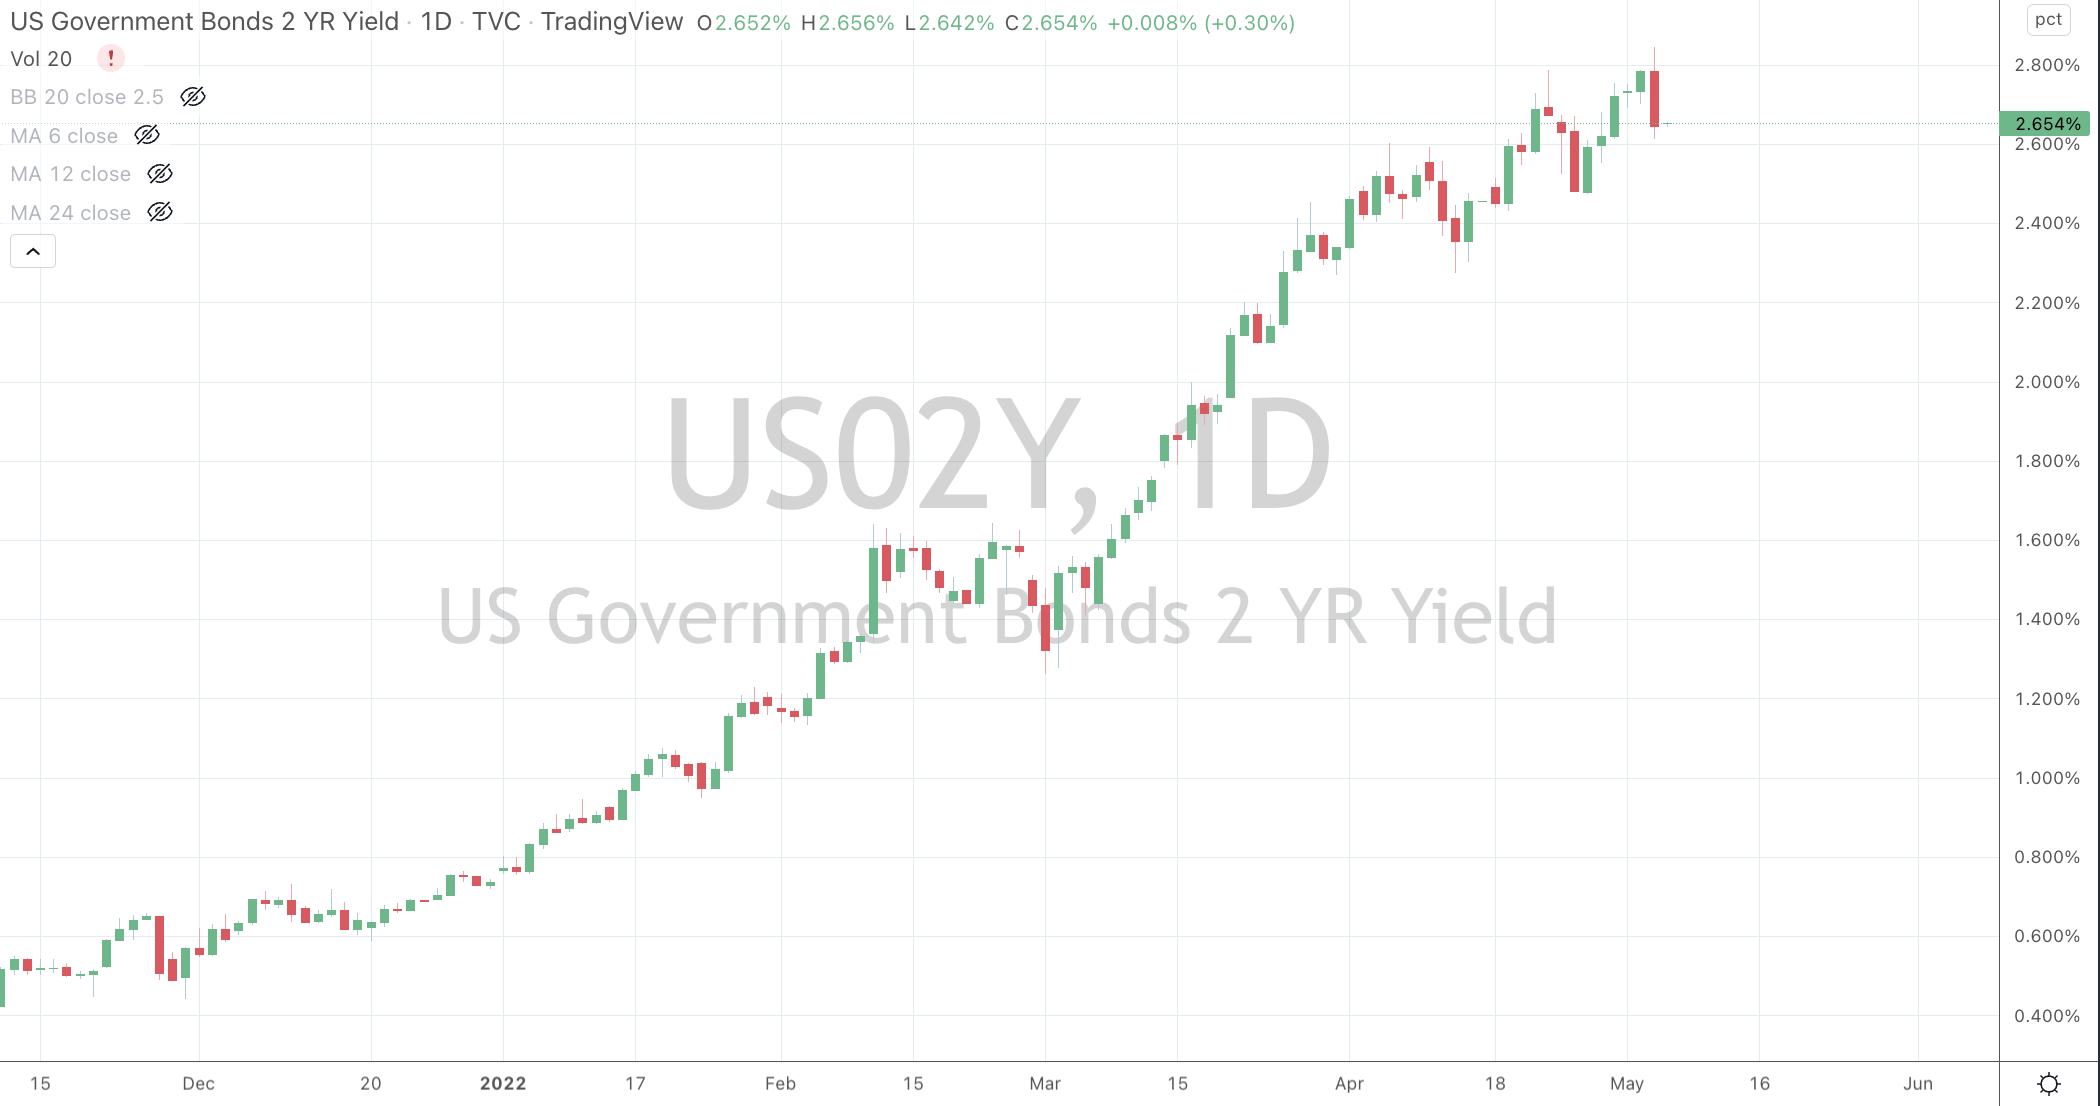
U.S. 2, 5 & 10 year yields
TBX
CRB (Commodities) Index and Bloomberg Commodities Index
U.S. Dollar (DXY) Index
Gasoline
The Overbought Quinella – Both Overbought and Traded at > 2.5 standard deviations above the weekly mean)
TBT
Natural Gas
Extremes “below” the Mean (at least 2.5 standard deviations)
Gold/Copper Ratio
U.S. 10 year yield minus Australian 10 year yield
Taiwan’s TAEIX index
Oversold (RSI < 30)
TLT
IEF
China’s CSI 300
Shanghai Composite
Russia’s MOEX Index
JPY/USD
EUR/USD
SGD/USD
DKK/USD
CNH/USD
HKD/USD
FXE
The Oversold Quinella – Both Overbought and Traded at > 2.5 standard deviations above the weekly mean)
GBP/USD
KRW/USD
Notes & Ideas:
This past week’s big news was bond yields new highs. Which means bond prices hit new, recent lows…..but not in Japan.
The Aussie yield curve is nearly oversold, but not inverted. More on this in a future note.
The U.S. spread is back at 0.40%, a target I’ve mentioned some weeks ago (see bull steepeners).
U.S. Bond ETF’s (TLT & IEF) have never been oversold (on a monthly basis) before…..
The Gold/Copper ratio has made a new appearance in the ‘extreme list’. It’s encroaching of an important support line was mentioned in last week’s edition. Old notes of mine have discussed this ratio’s correlation to the economy’s health and interest rates.
Other observations include;
Bitcoin has fallen 10% since breaking last week’s mentioned support line.
Aluminium has declined 27% in the past 9 weeks.
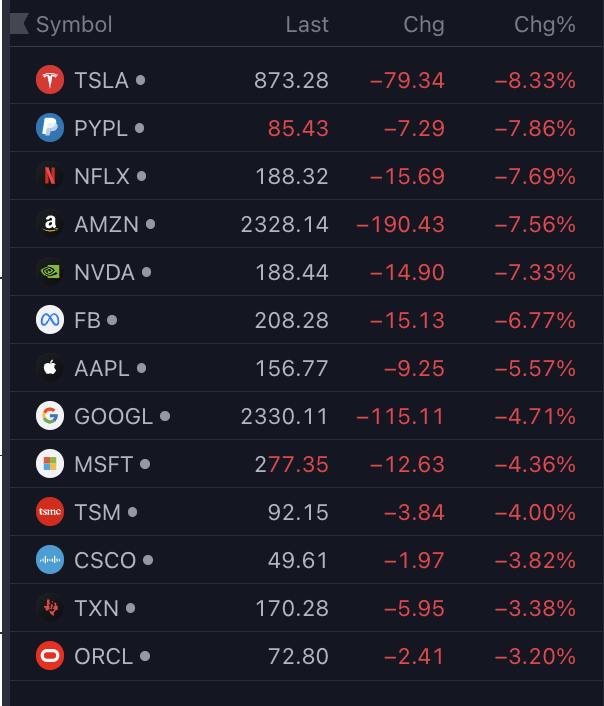
The S&P 500 has posted 5 consecutive weekly declines, not seen for quite a while.
Although, it only fell 0.2% this past week, as did the Dow Jones Industrials.
There is an ‘image misnomer’ in the past week’s action. While there was continued carnage in selected stocks, U.S. indices posted a surprisingly mild week.
In fact, North American bourses rode out the week quite well. Most of the declines were seen in Europe with the Nordic’s taking the larger brunt, continued weakness in Asia and Australia posted its largest weekly decline since the February 24th, 2022 Ukrainian invasion.
More so, many indices are yet to make ‘lower lows’ than those seen in March 2022.
The Dow Jones Transports rose 0.2% for the week, the MidCap 400 only fell 0.8%, the Nasdaq 100 surprisingly only declined 1.3% as did the Russell 2000.
The latter is nearing its 200 week moving average and an oversold reading. ETF buyers prepare !
The weakness in the Yen versus the AUD in no longer at 7 years lows but the JPY/USD saw more weakness, its lowest price in 20 years (April 2002).
This obviously makes Japanese products and services more competitive.
There was a divergence amongst the energy complex. Heating Oil., Distillate (Gasoil) & Coal slid while Crude Oil, Gasoline and Natural gas rose decently.
Interestingly, Natural Gas rose 11% on the week, even though it fell 8% during Friday’s trade alone.
One thing to watch is that the CRB Index didn’t make a new high, while the U.S. Dollar Index (DXY) did.
Stockholm, Helsinki, Kospi, Bovespa, MIB, DAX and KBW Bank Index are nearing their 200 week moving average.
The IBEX, CSI 300, HSCEI and Hang Seng are below their 200 WMA.
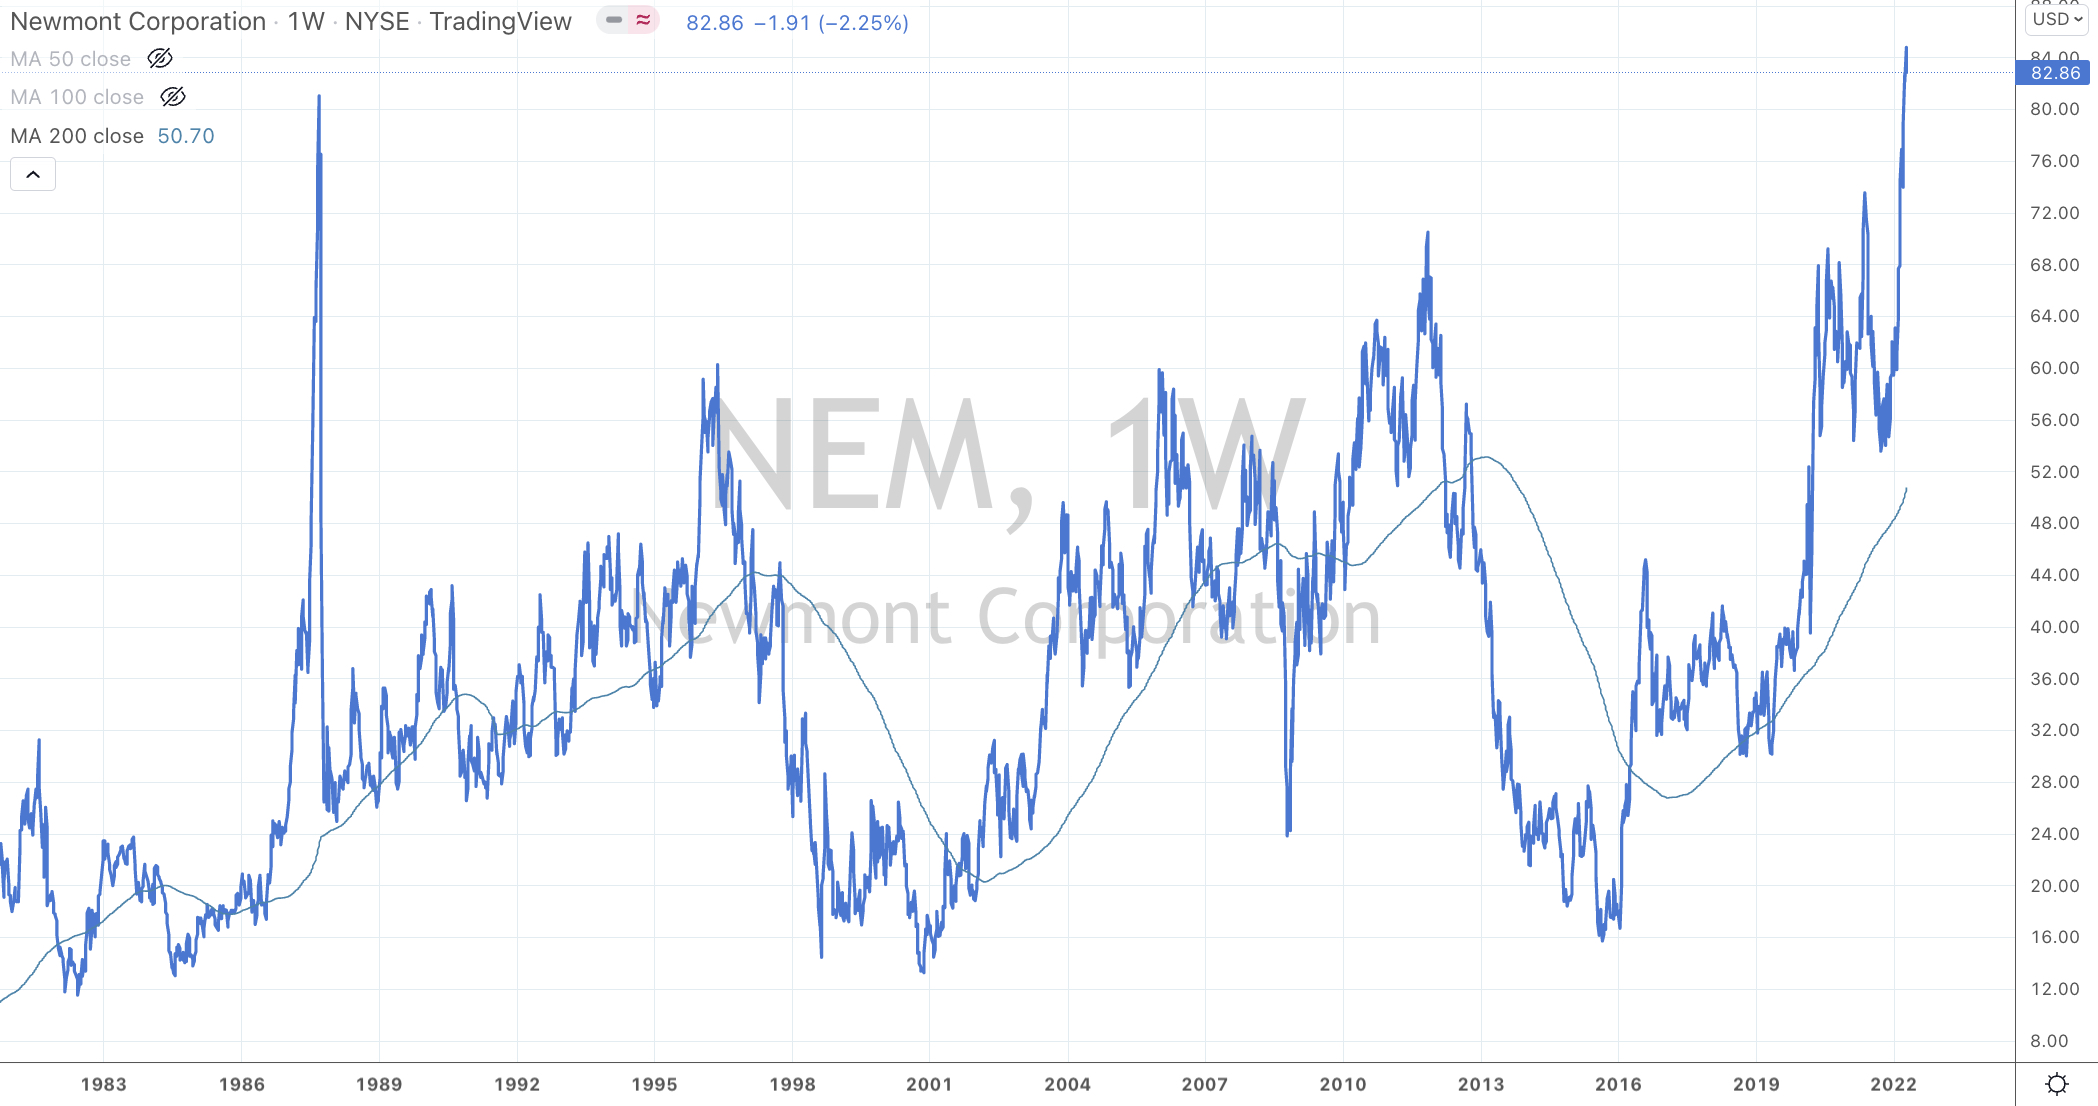
and once again, Precious Metals fell while major equities indices did the same.
The larger advancers over the past week comprised of;
Baltic Dry Index 13.1% (up 25% in 3 weeks), Rotterdam Coal 22.9% (recovering last week’s fall), WTI Crude 4.9%, Natural Gas 11%, Platinum 1.8%, Gasoline 9.2%, Dutch TTF GAs 2.3%, Brent Crude 6.1%, Uranium 3.3%, Wheat 5%, KBW Bank Index 2.2%, SOX 2.1%.
The group of decliners included;
Australian Coal (2.2%), Aluminium (7.2%), Cocoa (3%), China Coal (4.2%), Gasoil (7.2%), Copper (3.2%), Heating Oil (17.3%), JKM (2%), Coffee (5.3%), Lumber (9.6%), LNG (4.1%), Nickel (6%), Orange Juice (2.4%), Palladium (12.3%), Silver (3.1%), Urea (2%), Corn (3.5%), Oats (3.5%), Rice (2.8%), Soybeans (3.7%), Bitcoin (10.3%), Ethereum (10.3%), Cardano (6.6%), AEX (4.1%), CAC (4.2%), CSI 300 (2.7%), DAX (3%), MIB (3.2%), HSCEI (6.7%), Hang Seng (5.2%), IBEX (3.1%), Bovespa (2.5%), Kospi (1.9%), Nasdaq 100 (1.3%), Sensex (1.9%), Oslo (2.1%), Copenhagen (5.8%), Helsinki (3.6%), Stockholm (4.7%), Swiss SMI (3.3%), Singapore’s STI (1.9%), FTSE 100 (2.1%) and the Australia’s ASX 200 fell 3.1%.
May 8, 2022
by Rob Zdravevski
rob@karriasset.com.au