Don’t simply believe that central banks cause or can solve inflation.
The rhetoric, economic policy and legislation of government cause, create and add to rising prices.
Whether they allow energy exploration or development, subsidise housing with taxation free of capital gains, not encouraging longer term residential rental tenancies, not securing internal production supply of key commodities or food stuffs or placing tariffs on imports, government
Don’t be fooled by Joe Biden’s framing of remarks that he ‘respects an independent Fed’ etc etc…..should inflation not decline prior to the November 2022 mid-term elections, he is trying to set them up as the ‘fall guy’, when in turn he could have (as can Australian politicians) changed policies to help abate inflation.
Yet, it’s too late for Biden’s vote prospects to do that, so instead, they’ll work on a plan to blame the central bank for any short-comings.
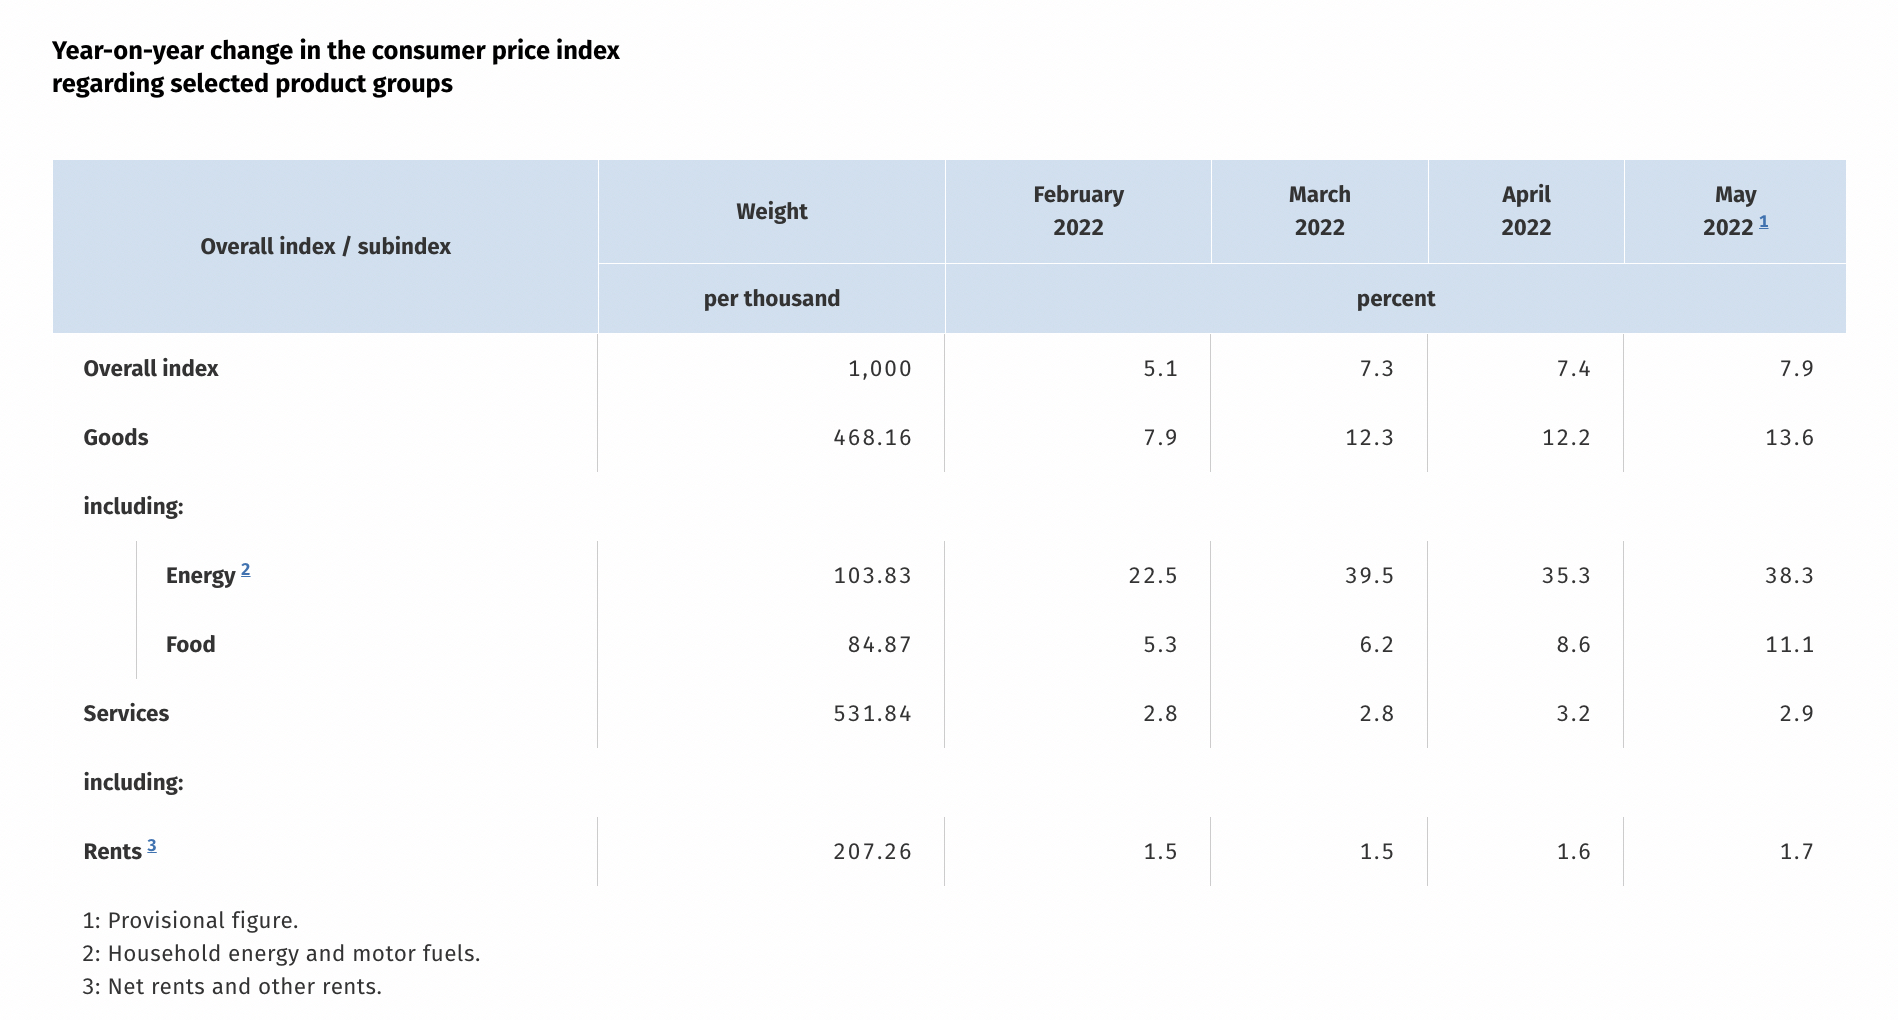
In Germany, where you can lease a house for longer periods of time and where more than half the population rent, they are not seeing notable inflation in the cost of housing. (see graphic below)
It’s understandable that their price of energy is rising sharply, due to another policy error of relying too heavily on a key supplier.
Australia and the United States have energy resources.
Why are these locally sourced costs rising ?
It’s governmental economic policy to blame, not central bank monetary policy.
The following assets (on a weekly timeframe) registered an Overbought or Oversold reading and/or have traded more than 2.5 standard deviations above or below its rolling mean.
Extremes “above” the Mean (at least 2.5 standard deviations)
EUR/GBP
Overbought (RSI > 70)
Australian 2, 3, 5 & 10 year government bond yields
German, Spanish, French, Greek, Italian and Portuguese 10 year government bond yields
U.S. 2 government bond year yields
U.S. Dollar (DXY) Index
Natural Gas
Gasoline
CRB Index
Bloomberg Commodity Index
WTI Crude Oil (September ’22 and December ’22 contracts)
USD/JPY
The Overbought Quinella – Both Overbought and Traded at > 2.5 standard deviations above the weekly mean)
None
Extremes “below” the Mean (at least 2.5 standard deviations)
HKD/USD
CNH/USD
Dow Jones Transports
S&P 400 Mid Cap index
Nasdaq Transports
S&P 600 Small Caps
Oversold (RSI < 30)
JPY/USD
The Oversold Quinella – Both Overbought and Traded at > 2.5 standard deviations above the weekly mean)
None
Notes & Ideas:
The big news for the week was the stunning bounce in global equity indices especially in the United States.
Musings in recent edition of ‘Macro Extremes’ about Oversold moments and a 7th consecutive weekly decline in some indices portended a change of direction.
Calling such a low was highlighted in my newsletter released earlier in the week
Keep in mind that it doesn’t mean a change of trend, but merely a break of a streak.
Incidentally, there is little news in the financial media reporting that last week’s advance added a certain amount of trillions in market capitalisation, while we only hear of the trillions ‘wiped’ or ‘lost’…….and never about the trillions which are ‘found’.
In other news, the 5 and 10 year U.S. government bond yields are not Overbought.
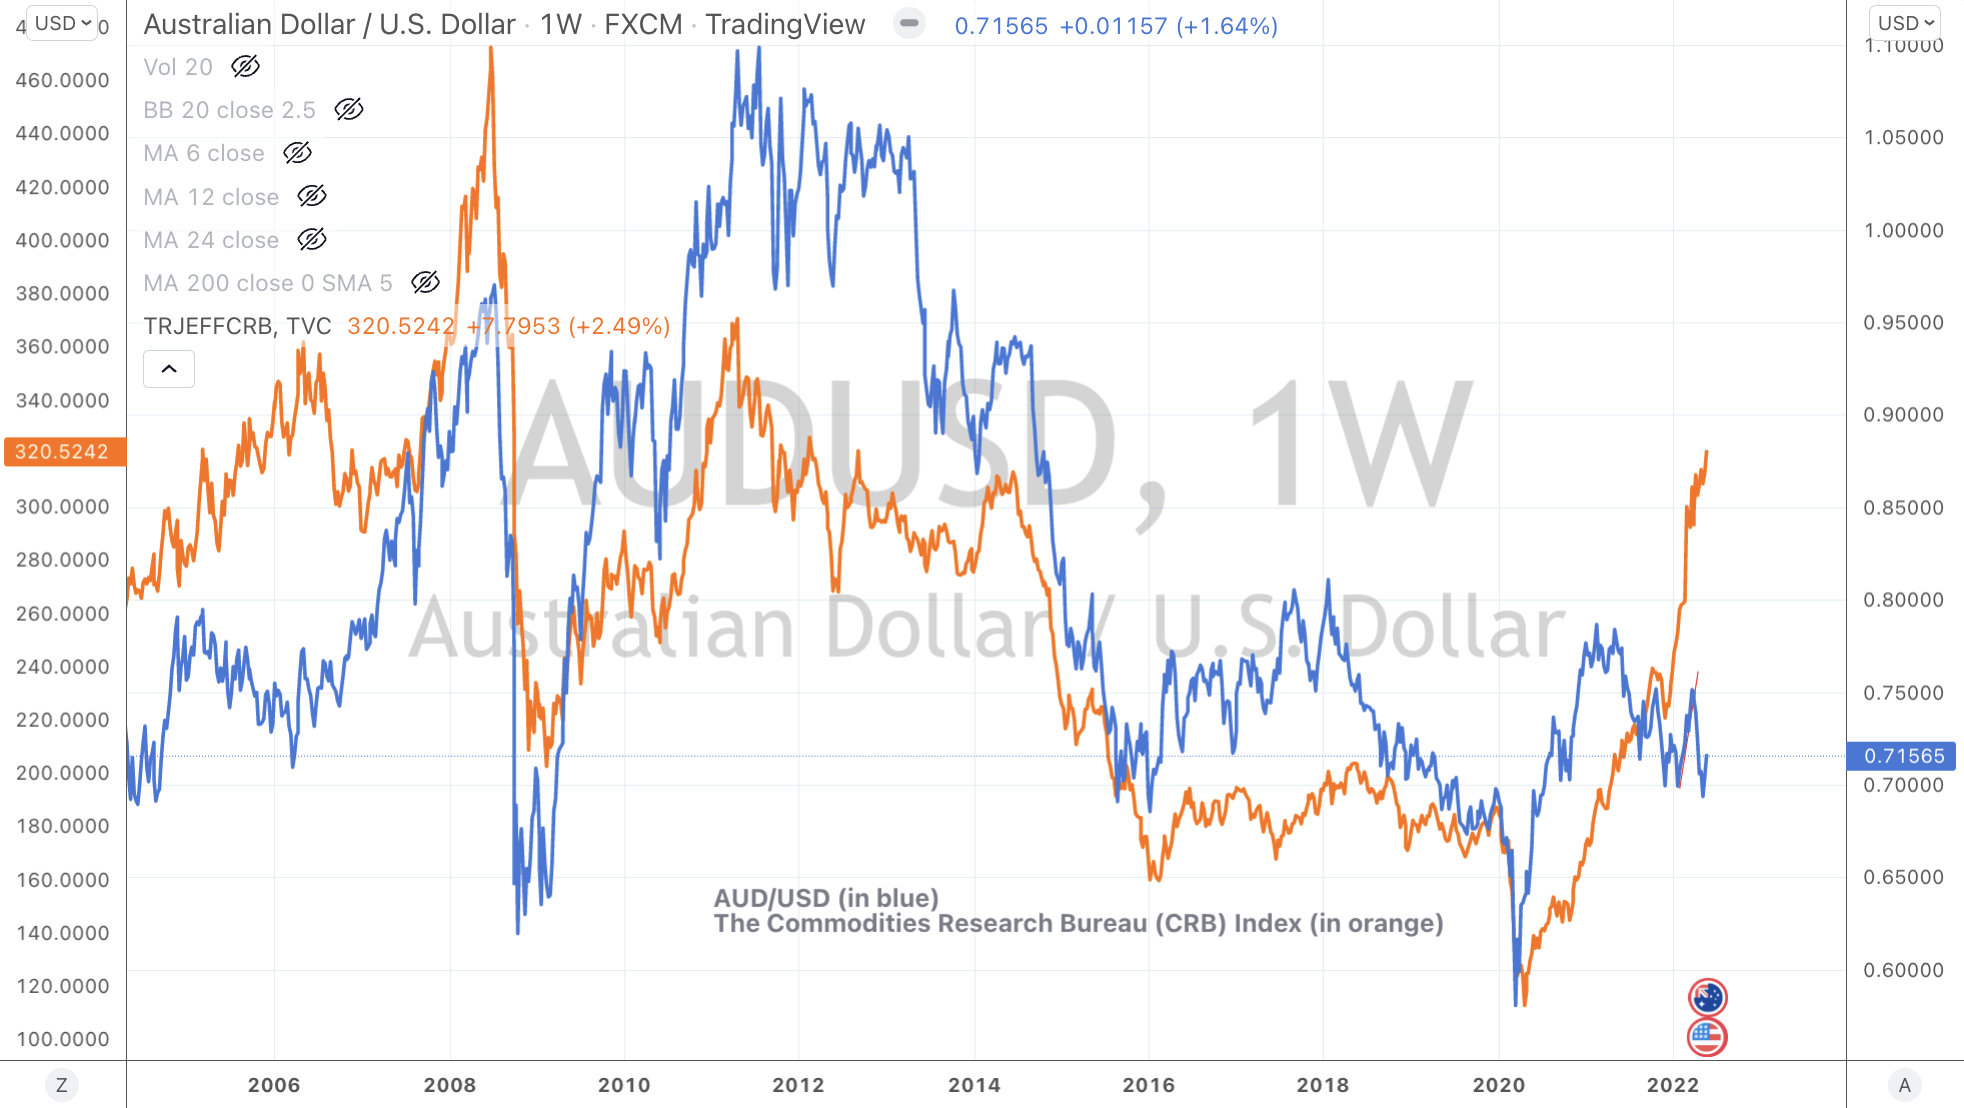
While the CRB (commodities) Index remains overbought, for the 19th consecutive week….the U.S. Dollar Index (DXY) ended 6 consecutive week of ‘overboughtness’.
The chart below shows the recent divergence of the AUD/USD and broader commodity prices.
Probability is increasing of a weaker US dollar as a means of simply retracing the recent bullish move, although there isn’t much talk about commodity prices easing, let alone reverting to any chosen mean.
The Baltic Dry Index (shipping costs) took a break and fell 20% following a 51% advance in the previous 6 weeks.
Bitcoin fell again (another 5%) and has declined 50% over the past 9 weeks.
The larger advancers over the past week comprised of;
Bloomberg Commodity Index 2.5%, China Coal 2.6%, WTI Crude 4.3%, Gasoil 9.4%, Heating Oil 7.1%, JKM LNG 3.7%, Coffee 6.3%, Lumber 4.2%, LNG 3.1%, Tin 3.3%, Natural Gas 8%, Orange Juice 6.2%, Palladium 5.4%, Gasoline 2%, Silver 2%, CRB Index 2.5%, Dutch TTF Gas 4.2%, Brent Crude 5.9%, Oats 14.9%, AEX 2.8%, KBW Banking Index 9.2%, French CAC 3.7%, German DAX 3.4%, Dow Jones Industrials 6.3%, DJ Transports 7.1%, Italy’s MIB 2.3%, Spain’s IBEX 5.3%, Bovespa 3.2%, S&P MidCap 400 6.5%, Nasdaq 100 7.2%, Osloa 3.1%, Helsinki 3.9%, Stockholm 3.2%, Russell 2000 6.5%, Swiss SMI 3%, Philadelphia Semiconductor (SOX) Index 8.1%, S&P 500 6.6%, U.K.’s FTSE 2.7%, Canada’s TSX 2.7%, S&P SmallCap 600 6.7%, Nasdaq Biotech Index 2.8% and Australia’s ASX 200 rose 0.5%.
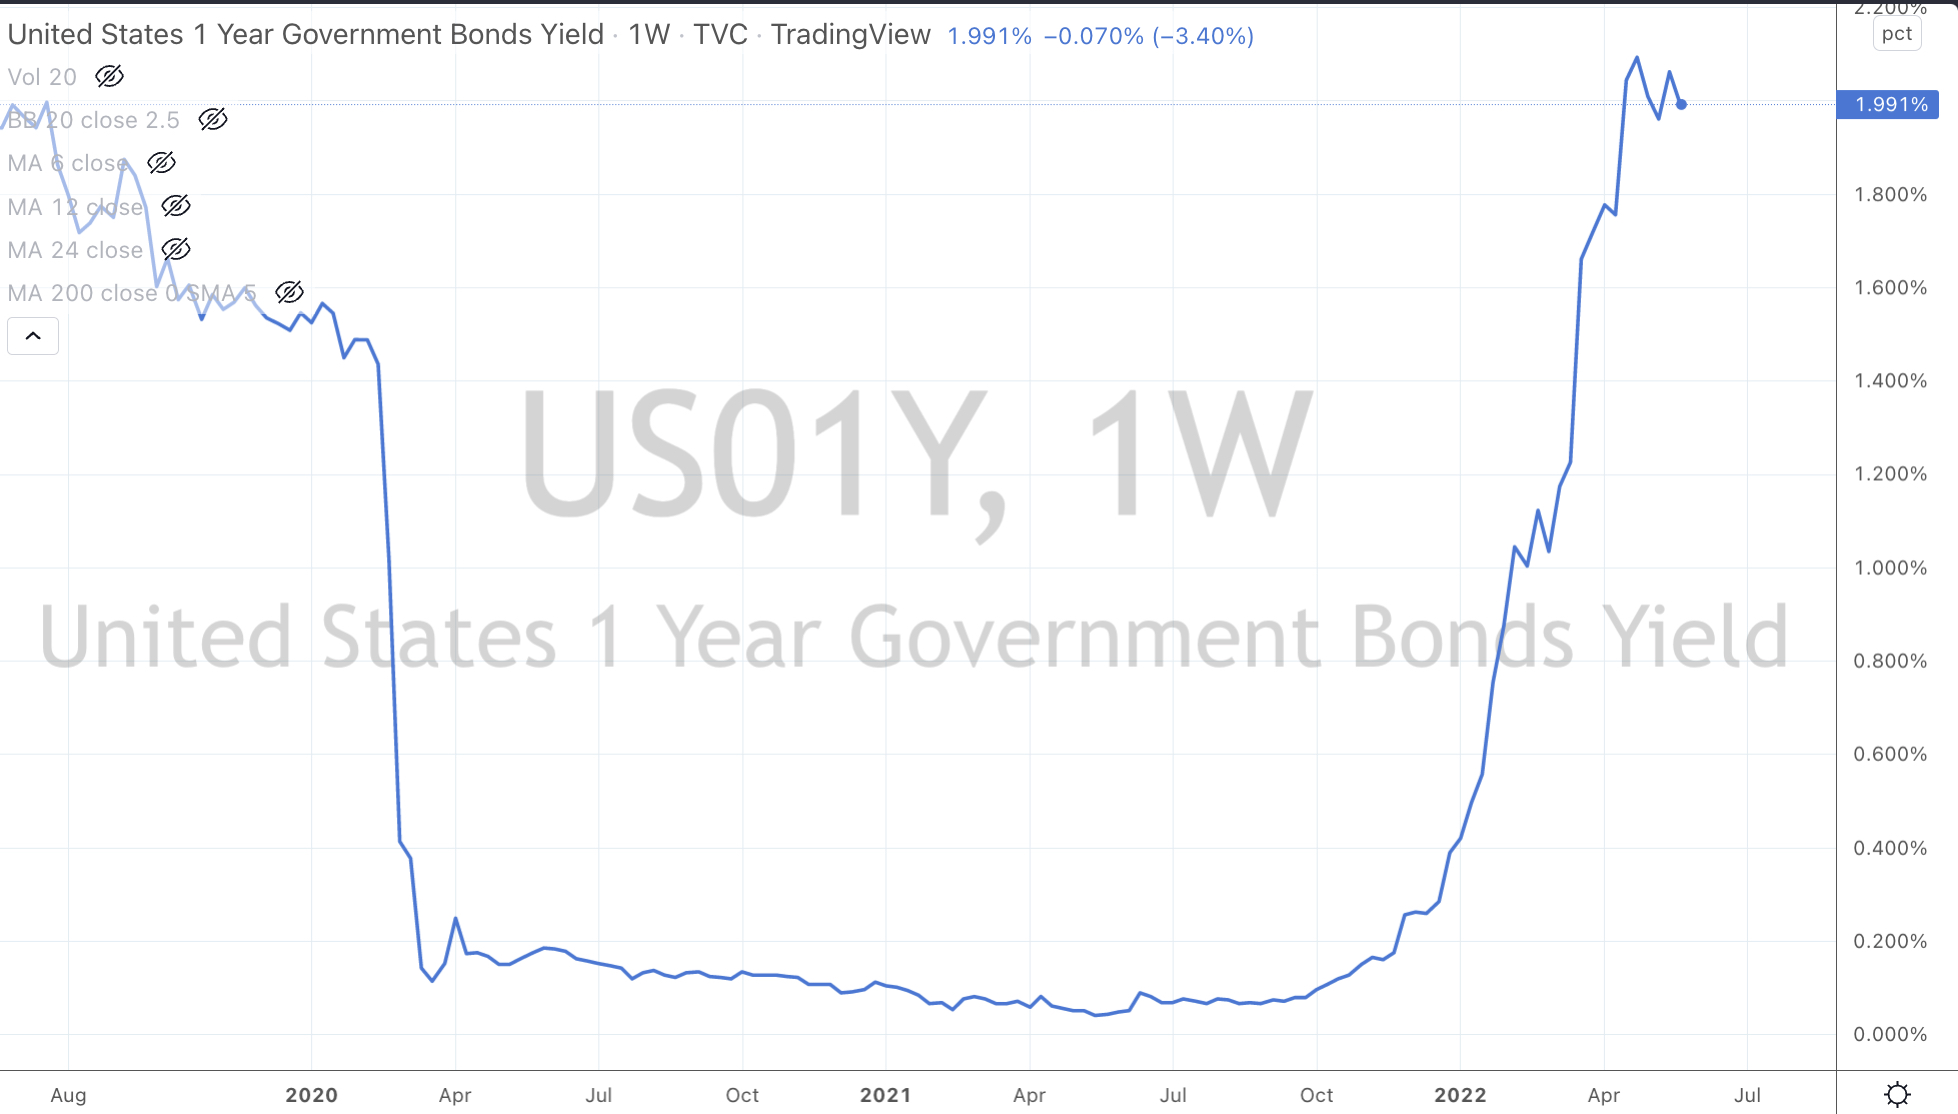
the minutes released overnight hint at 2 rate hikes of 0.5% each in the next consecutive meetings,
the chart below is the U.S. 1 year Treasury Note,
it’s already at 2%,
2 more rate hikes bring the Fed Rate up to 2%,
See how the markets factor in the future………?
My call remains intact, the Fed hikes 3 times and could possibly cut once within 9-18 months.
When you couple hawkish Fed speak with talk amongst the population of recession and slowdowns will, by design, also help simmer inflation.
It’s even more simple…..western central banks can’t hike rates too much because they would derail the great overvalued, leveraged home ownership trade.
While the public financial markets correct and adjust, it’s not as great of consequence compared to central bank policy affecting the retention of your job and being able to service mortgage repayments adequately,
The uncrowded trade is to see inflation peak and abate and same goes for government bond yields.
While the structural imbalances in the uranium industry remains intact and the investment theme has years to run, spot prices and animal spirits get ahead of themselves sometimes.
So, as markets wash-out late comers and ‘unnatural’ participants, I’ll look for a pullback in the uranium spot price to around the $35-$36 level and I’ll correlate that into my preferred equity exposures as my next moment to accumulate.
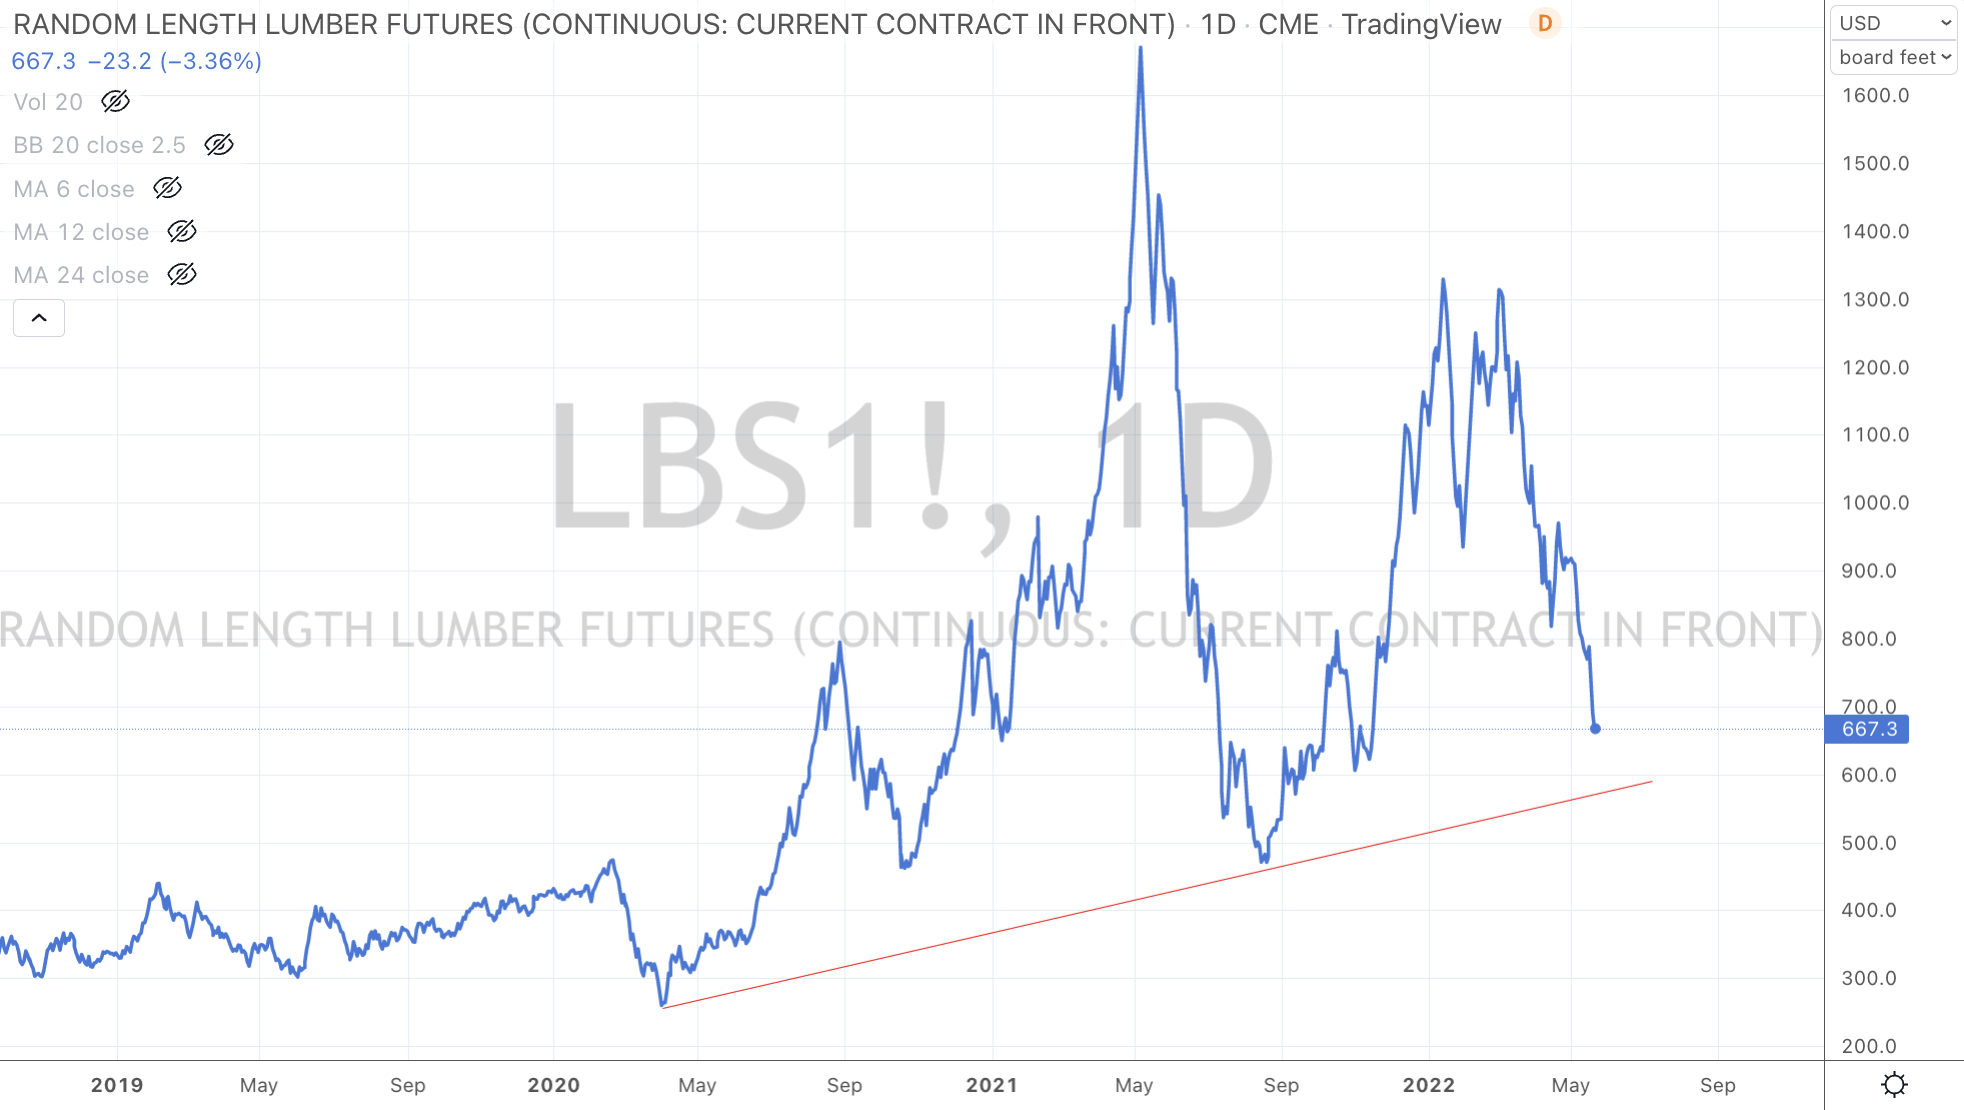
I enjoy watching the price of Lumber. It’s tells a good story.
Currently, it is barrelling towards a $570 support. The trend has been negative as it continues to make ‘lower low’.
Lumber’s price action has also been a good study in mean reversions and fibonacci retracements.
It also tends to lead the S&P 500 in near-term peaks and troughs.
I also think it has been a handy barometer of inflation or at least scarcity of supply.
For those watching inflation, it’ll be interesting to watch how the higher prices of the past several months will affect lumber yards, timber truss manufacturers and homebuilders as they try to pass on higher ‘finished’ prices compared to the more competitive prices buyers of lumber can achieve today?
The following assets (on a weekly timeframe) registered an Overbought or Oversold reading and/or have traded more than 2.5 standard deviations above or below its rolling mean.
Extremes “above” the Mean (at least 2.5 standard deviations)
None
Overbought (RSI > 70)
Australian 2, 3, 5 & 10 year government bond yields
Spanish, French, Greek, Italian, Swedish and Portuguese 10 year government bond yields
U.S. 2 & 5 government bond year yields
U.S. Dollar (DXY) Index
Natural Gas
Gasoline
CRB Index
The Overbought Quinella – Both Overbought and Traded at > 2.5 standard deviations above the weekly mean)
None
Extremes “below” the Mean (at least 2.5 standard deviations)
Tin
NZD/USD
CNH/USD
SGD/USD
Dow Jones Transports
S&P 400 Mid Cap index
Nasdaq Transports
Copenhagen 25 Index
Oversold (RSI < 30)
Russell 2000
NZD/AUD
KRW/USD
JPY/USD
HZD/USD
The Oversold Quinella – Both Overbought and Traded at > 2.5 standard deviations above the weekly mean)
Dow Jones Industrial Average
Nasdaq 100
S&P 500
S&P 600 Small Cap
IDR/USD
Notes & Ideas:
The big news for the week is a competition between many bond yields are no longer at extreme highs and U.S. equity indices hitting Oversold extremes.
The bond yields have taken a break being Overbought and starting to consolidate lower. We’ve seen bond buyers being more aggressive which is FINALLY commensurate with pessimism in the equities universe.
In equities, some are seeing Oversold for the first time in 2 years or more.
News about that yield curve has gone quiet too. Since that spread hit my 0.40% initial target it has since flattened to 0.20% this week.
The CRB (commodities) Index remains overbought, for the 18th consecutive week.
Although the U.S. Dollar Index (DXY) is in its 6th consecutive week of ‘overboughtness’, the trend is waning because there are less currencies in recent weeks registering Oversold readings.
We saw the DXY fall 1.4% and the GBP an EUR rise 2% and 1.4% respectively.
The level of U.S. Dollar strength has been quite interesting to watch, especially as many called the death of the USD for various reasons with many relating to their ‘money printing’ thesis.
We saw strength in Asian and Nordic equity bourses, with the former being out favour for weeks prior when they were spending time being Unloved and Oversold.
Generally, there was less volatility across all asset classes and Crude Oil decline of 0.2% helped with that feeling.
But there are always pockets of movement.
Uranium has fallen 30% in 5 weeks,
The Baltic Dry Index (shipping costs) has soared 51% in the past 6 weeks and
Bitcoin fell again and has declined 45% over the past 8 weeks.
p.s. BTC is getting close to an Oversold extreme.
.
The larger advancers over the past week comprised of;
Baltic Dry Index 7.7%, Australian Coal 2.4%, Aluminium 5.5%, Rotterdam Coal 5.4%, China Coal 10.8%, Iron Ore 2.6%, Gold 1.9%, Hogs 8.1%, Copper 2.4%, Natural Gas 5.5%, Orange Juice 3.2%, Rubber 2.3%, Sugar 4.1%, Silver 3.2%, Soybean 3.6%, Shanghai 2%, CSI 300 2.2%, HSCEI 4.6%, Hang Seng 4.1%, IBEX 1.8%, Sensex 3%, Oslo 1.9%, Copenhagen 4.4%, TAEIX 2% and Australia’s ASX 200 rose 1%
The group of decliners included;
Gasoil (3.5%), Heating Oil (4.6%), Lumber (13.3%), LNG (3.3%), Tin (7.5%), Gasoline (3.1%), Cotton (2.2%), Dutch TTF Gas (9.3%), Uranium (7%), Bitcoin (6.3%), Ethereum (8%), GBTC (4.9%), Cardano (11.9%), DJ Transports (6.7%), Dow Jones Industrials (2.9%), Midcap 400 (1.9%), SMI (2.9%), SOX (3%), S&P 500 (3.1%) and the Nasdaq Transportation Index slumped (5%)
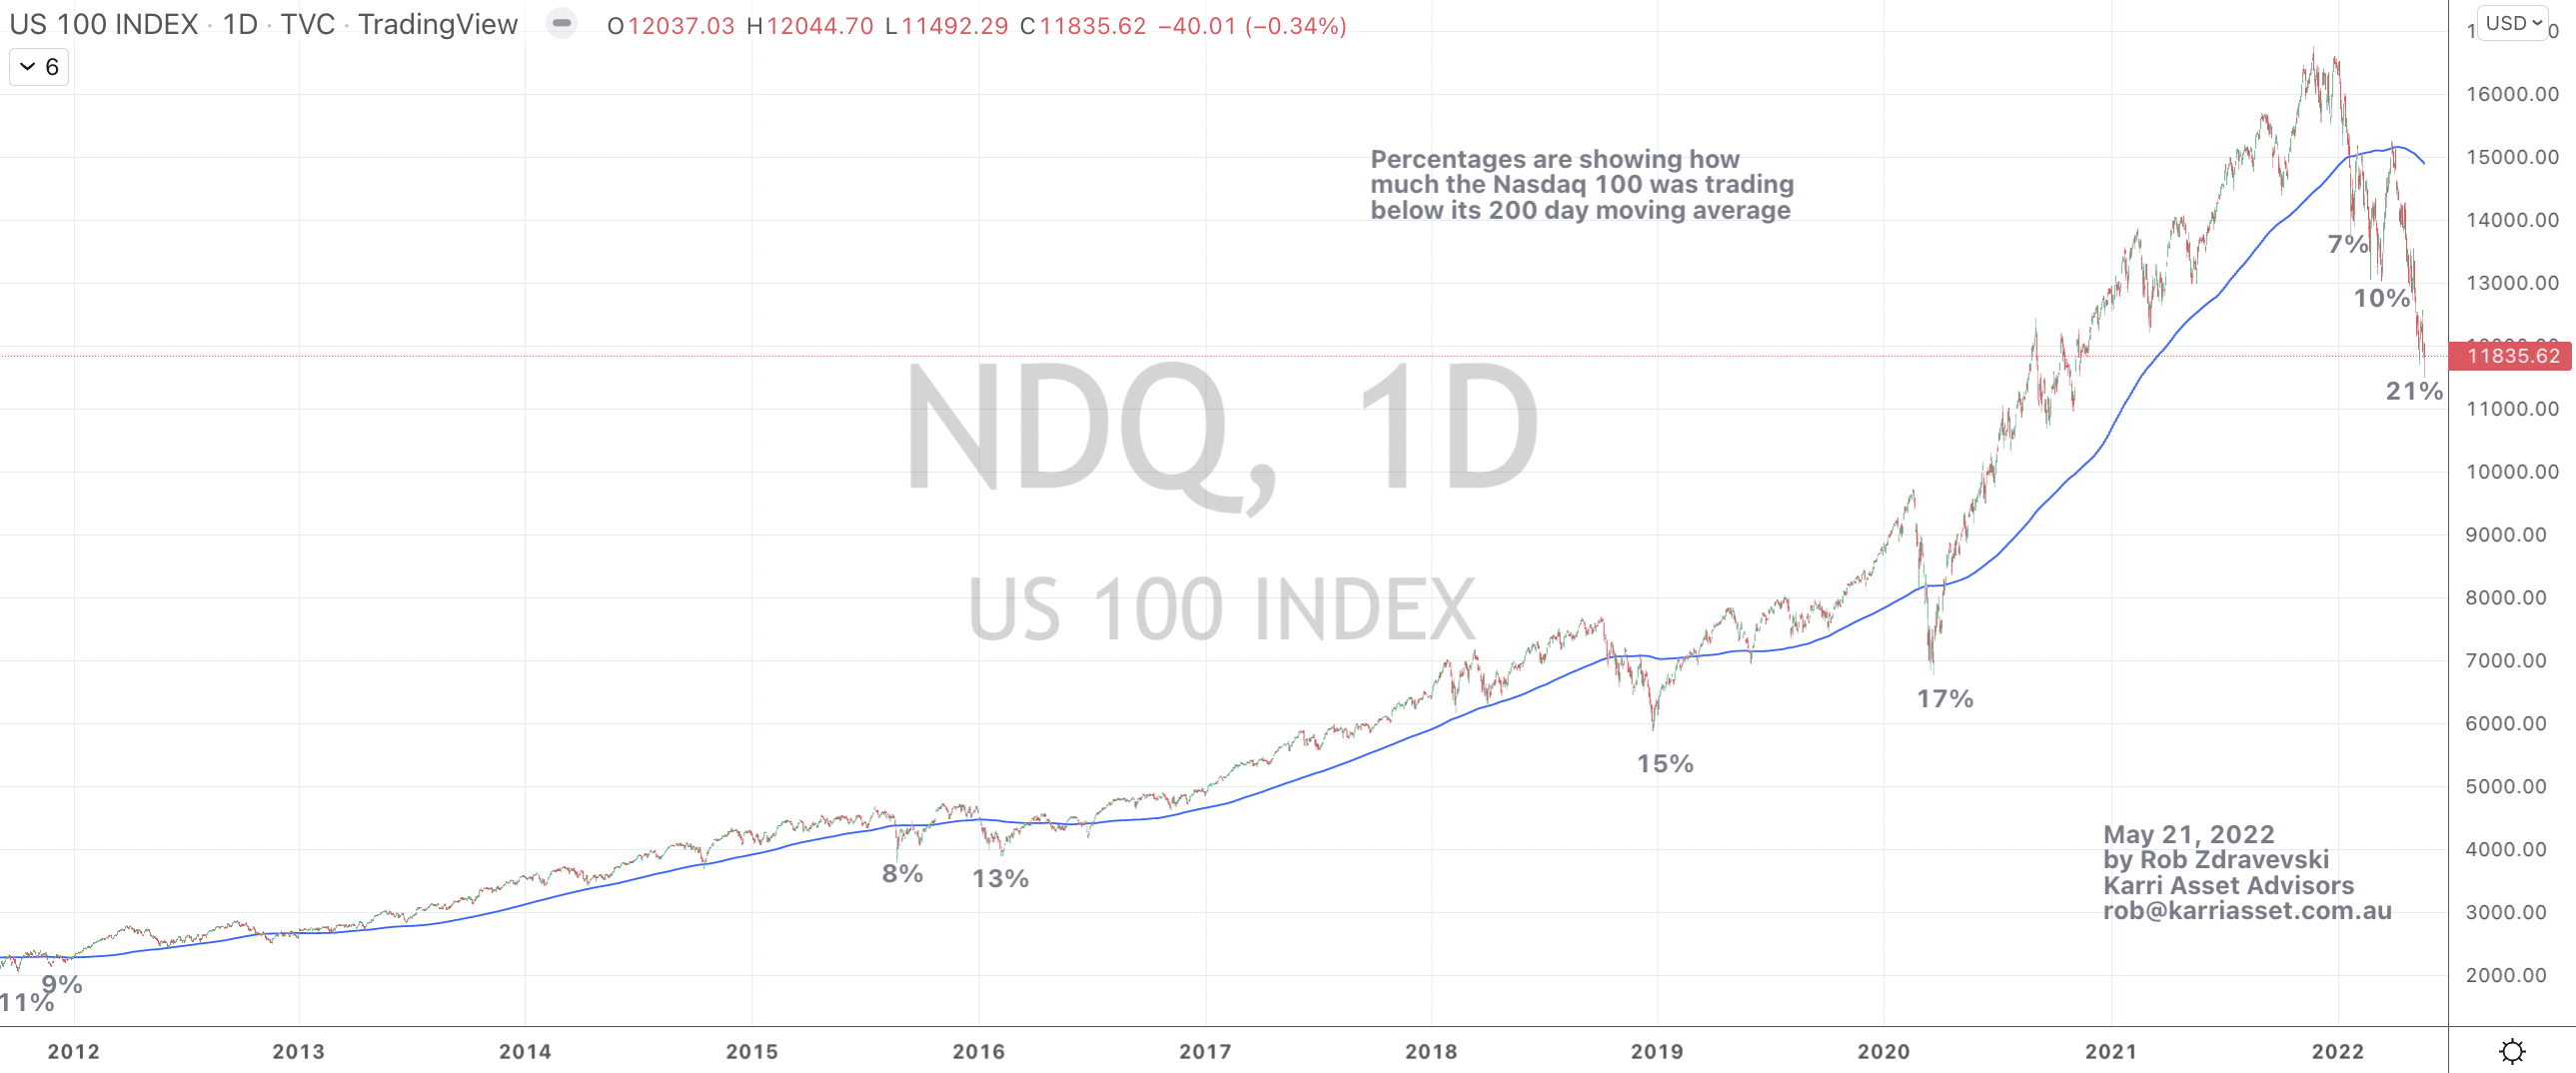
Lately, my posts (see links below) about equity indices hitting weekly Oversold levels has highlighted moments when the Relative Strength Index (RSI) has ventured below the ’30’ mark.
The chart below takes us to a more tactical look using a ‘nearer-term’ daily timeframe rather than my usually ‘mid-term’ weekly outlook.
It illustrates the percentage at which the Nasdaq 100 is trading below its 200 DAY moving average.
I think readers will see the case I am making and where probabilities lie.