The following assets (on a weekly timeframe) registered an Overbought or Oversold reading and/or have traded more than 2.5 standard deviations above or below its rolling mean.
Extremes “above” the Mean (at least 2.5 standard deviations)
TBX
Orange Juice
Overbought (RSI > 70)
U.S. Dollar Index (DXY)
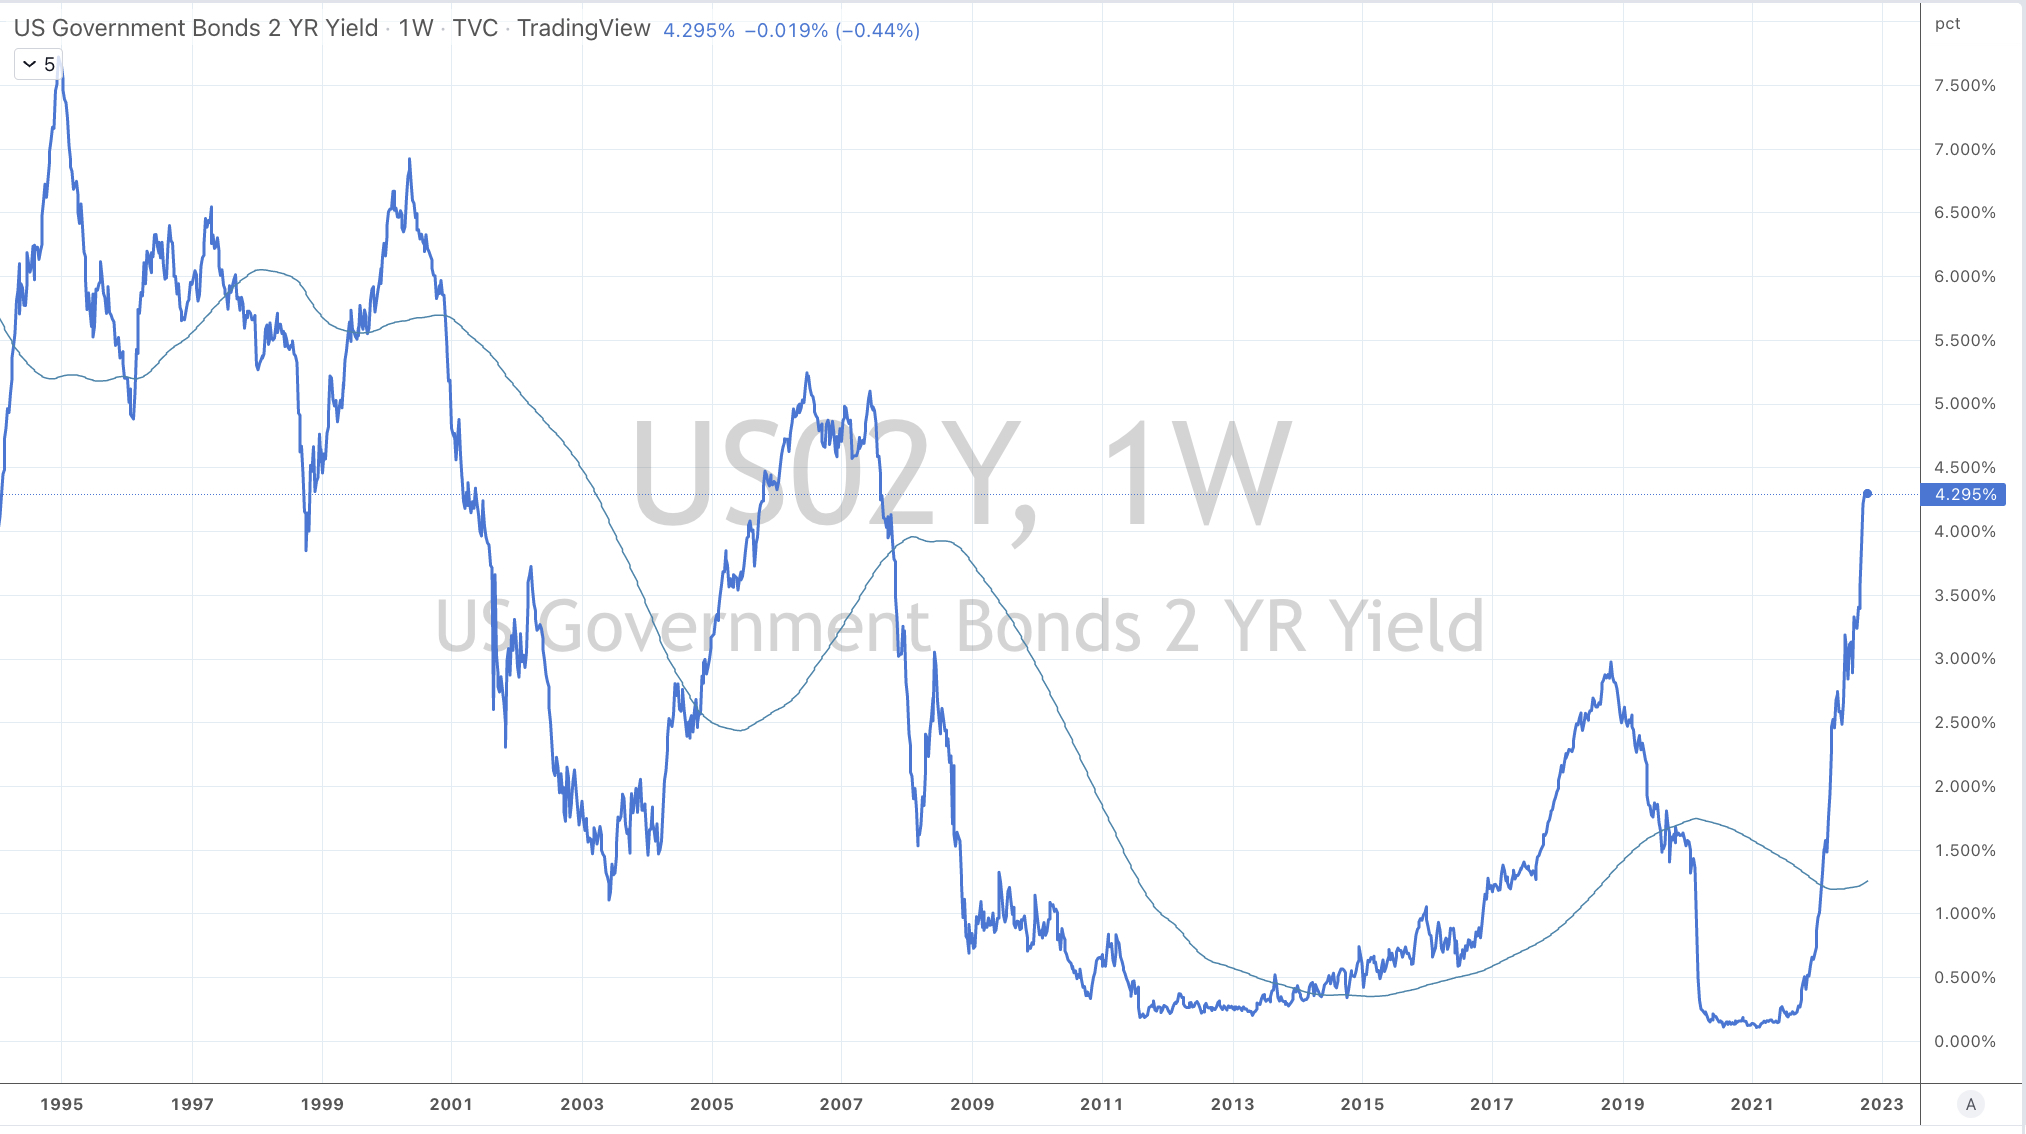
U.S. 2,5, 10, 20 and 30 year government bond yields
German 2, 5 & 10 year government bond yields
British 5 year government bond yields
Spanish, French, British, Greek, Italian, Korean & Portuguese 10 year government bond yields
The Overbought Quinella – Both Overbought and Traded at > 2.5 standard deviations above the weekly mean)
TBT
Extremes “below” the Mean (at least 2.5 standard deviations)
Rotterdam Coal
CAD/USD
AUD/SGD
Oversold (RSI < 30)
Tin
Hot Rolled Coil Steel (HRC)
TLT
IEF & IEI
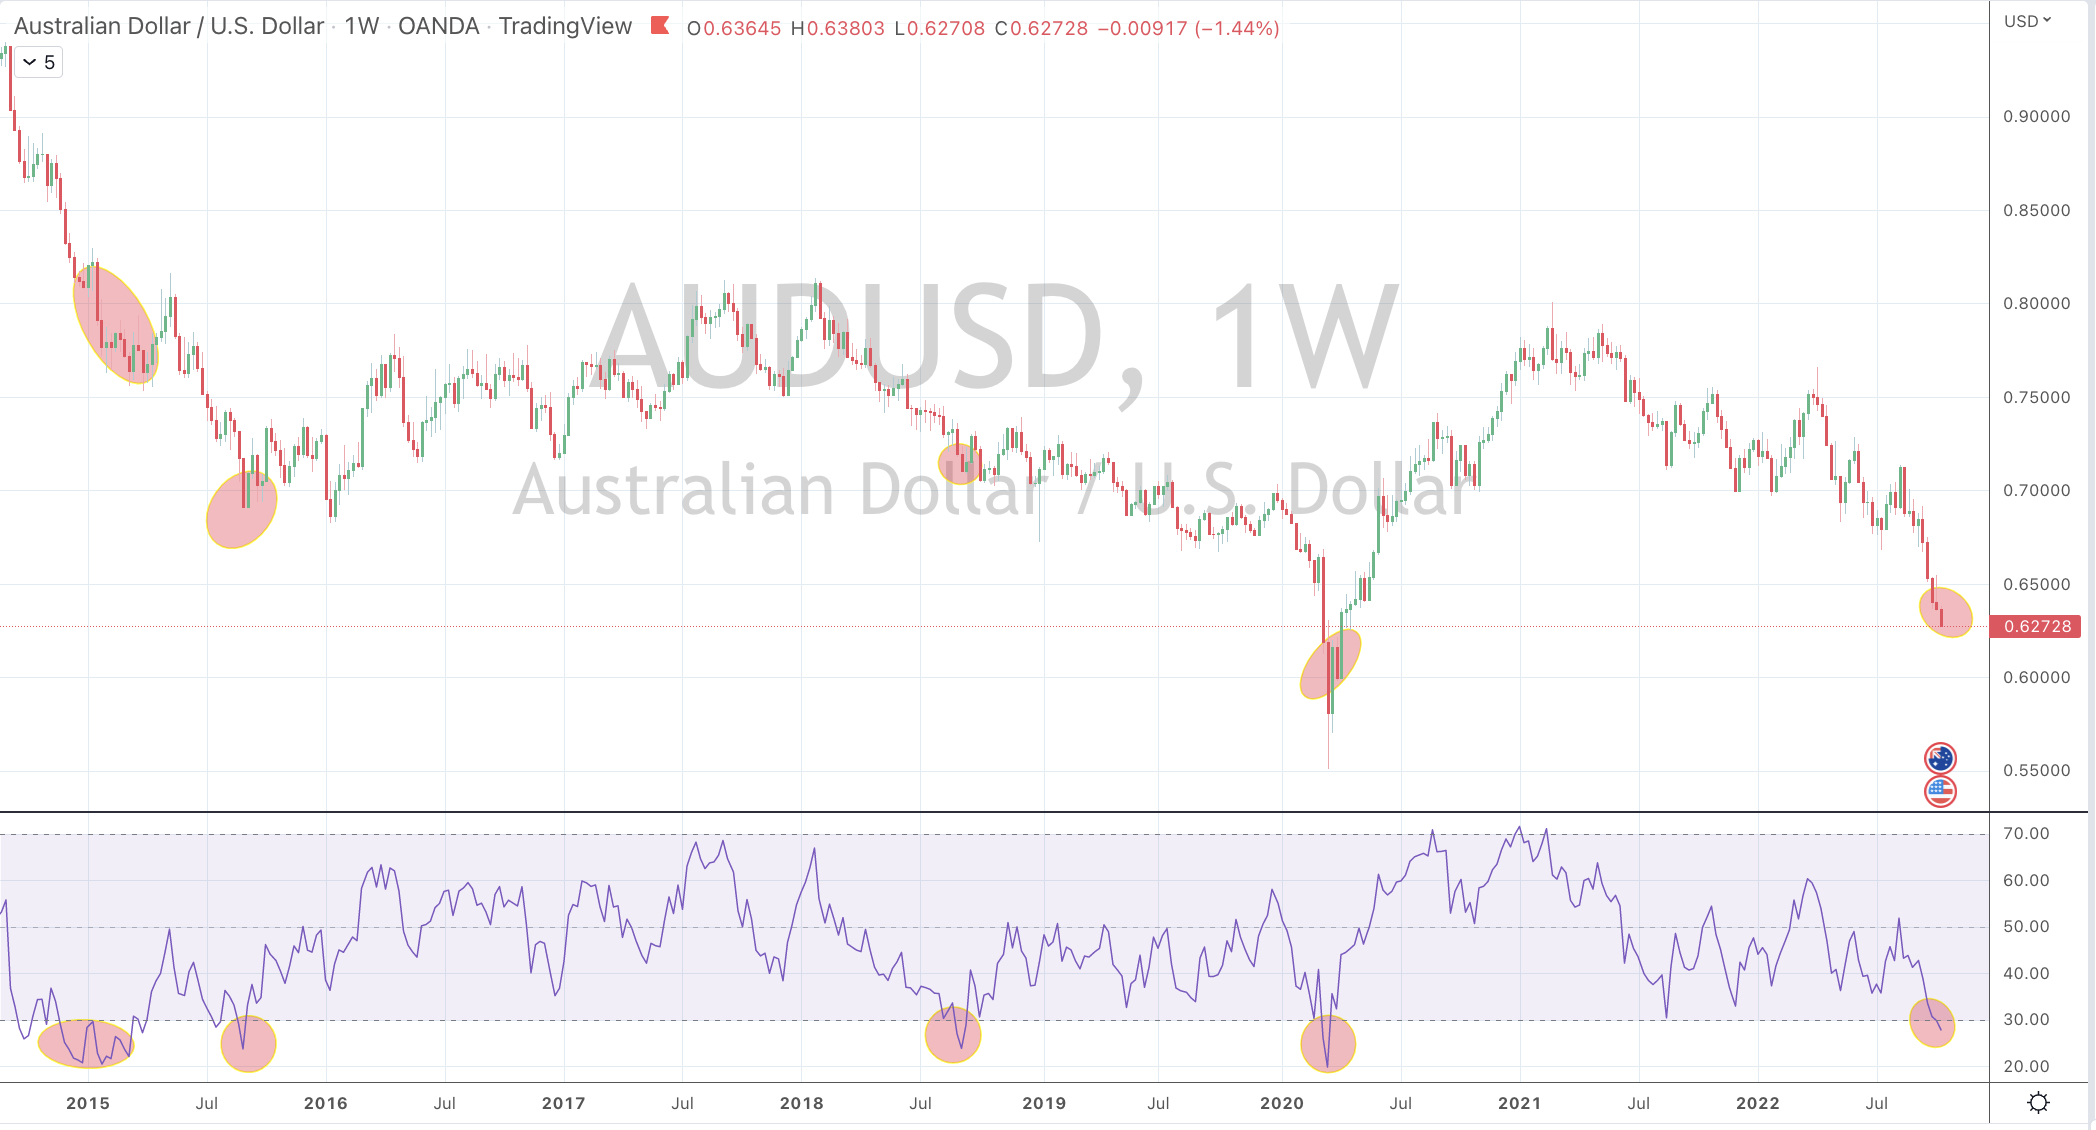
AUD/USD
GBP/USD
EUR/USD
NZD/USD
DKK/USD
SGD/USD
JPY/USD
ZAR/USD
KRW/USD
SEK/USD
IDR/USD
And Taiwan’s TAIEX equity index
The Oversold Quinella – Both Overbought and Traded at > 2.5 standard deviations above the weekly mean)
None
Notes & Ideas:
The big news for the week was that many equity markets posted a reasonable positive return for the week even following Friday’s drubbing.
For example, the Philadelphia Semiconductor Index (SOX) rose 2% for the week even after a 6% plunge in Friday’s trading session alone.
The second biggest news was that most of the energy complex (attributing much to the CRB Index percentages rise) had a cracker of a week with Gasoline, Brent, Heating Oil and Diesel rose somewhere between 15% and 26% in a single week……all except Gas, including Natural Gas which saw an intra-week low of $6.30 and closing in on my $5.00 target.
Dutch TTF Gas and the Japan-Korean LNG Marker have fallen considerably in past weeks.
Rotterdam delivered coal has tanked 34% in the past 5 weeks and now registered a move towards its lower end of the standard deviations pendulum.
Bond yields remain Overbought even though some eased off from last week’s highs (except for Gilts). There still seems there is time to accumulate government bonds, if they are part of your asset allocation.
And the persistent strength of the U.S. Dollar meant that a list of currencies ae trading at notable lows and weakness.
The AUD/USD closed at its lowest price in 2.5 years
The JPY/USD is at it weakest level since August 1998, while the AUD/JPY is 7% weaker from its heights and extremes reported weeks ago.
Hong Kong related/linked equity markets bounced following last week’s Oversold readings
Brazil’s BOVESPA has risen 22% since its July 11 2022, low. All this in the midst of a contentious Presidential election and rising interest rates?
In fact, on September 22nd, 2022, Brazil’s central bank decided to keep its rates unchanged following 12 consecutive increases which commenced in early 2021.
And lastly, the Baltic Dry Index has risen 81% in the past 5 weeks.
The larger advancers over the past week comprised of;
Aluminium 6.4%, Bloomberg Commodity Index 5.1%, Baltic Dry Index 11.4%, Cocoa 1.8%, China Coal 8.1%, WTI Crude 16.4%, Gasoil 26.6%, Lean Hogs 4.2%, Heating Oil 19.3%, Lumber 5.5%, Platinum 6.8%, Gasoline 15.4%, Sugar 5.7%, Silver 6.4%, CRB Index 6.5%, Florida Urea 2%, Brent Crude 15.3%, Middle East Urea 5.7%, Silver in AUD 6.5%, Silver in USD 5.8%, Gold in AUD 2.7%, Gold in USD 2%, KBW Banks 1.8%, CAC 1.8%, DJ Industrials 2%, DJ Transports 3.5%, HSCEI 2.7%, Hang Seng 3%, Bovespa 5.8%, KOSPI 3.6%, S&P Midcap 400 2.9%, Nikkei 4.6%, Oslo 3.1%, Russell 2000 2.3%, SOX 2.2%, TAIEX 2.1%, Istanbul’s BIST 12.1%, S&P SmallCap 600 2.6% and Australia’s ASX 200 4.5% (although I expect 2% of that to be erased during this Monday’s session in reaction to U.S. action seen on Friday).
The group of decliners included;
Rotterdam Coal(17.1%), Hot Rolled Coil Steel ‘HRC’ (3.6%), JKM (11%), Tin (2%), Dutch TTF Gas (17.3%), Oats (2.8%), Rice (2%), Wheat (4.5%), Shanghai Composite fell 2%.
October 8, 2022
By Rob Zdravevski
rob@karriasset.com.au