Extracting ideas from this week’s Macro Extremes
November 21, 2022 Leave a comment
From the edition for the week ending November 18, 2022, these investment ideas could make their way into my portfolio, or at least become worthy of ponder.
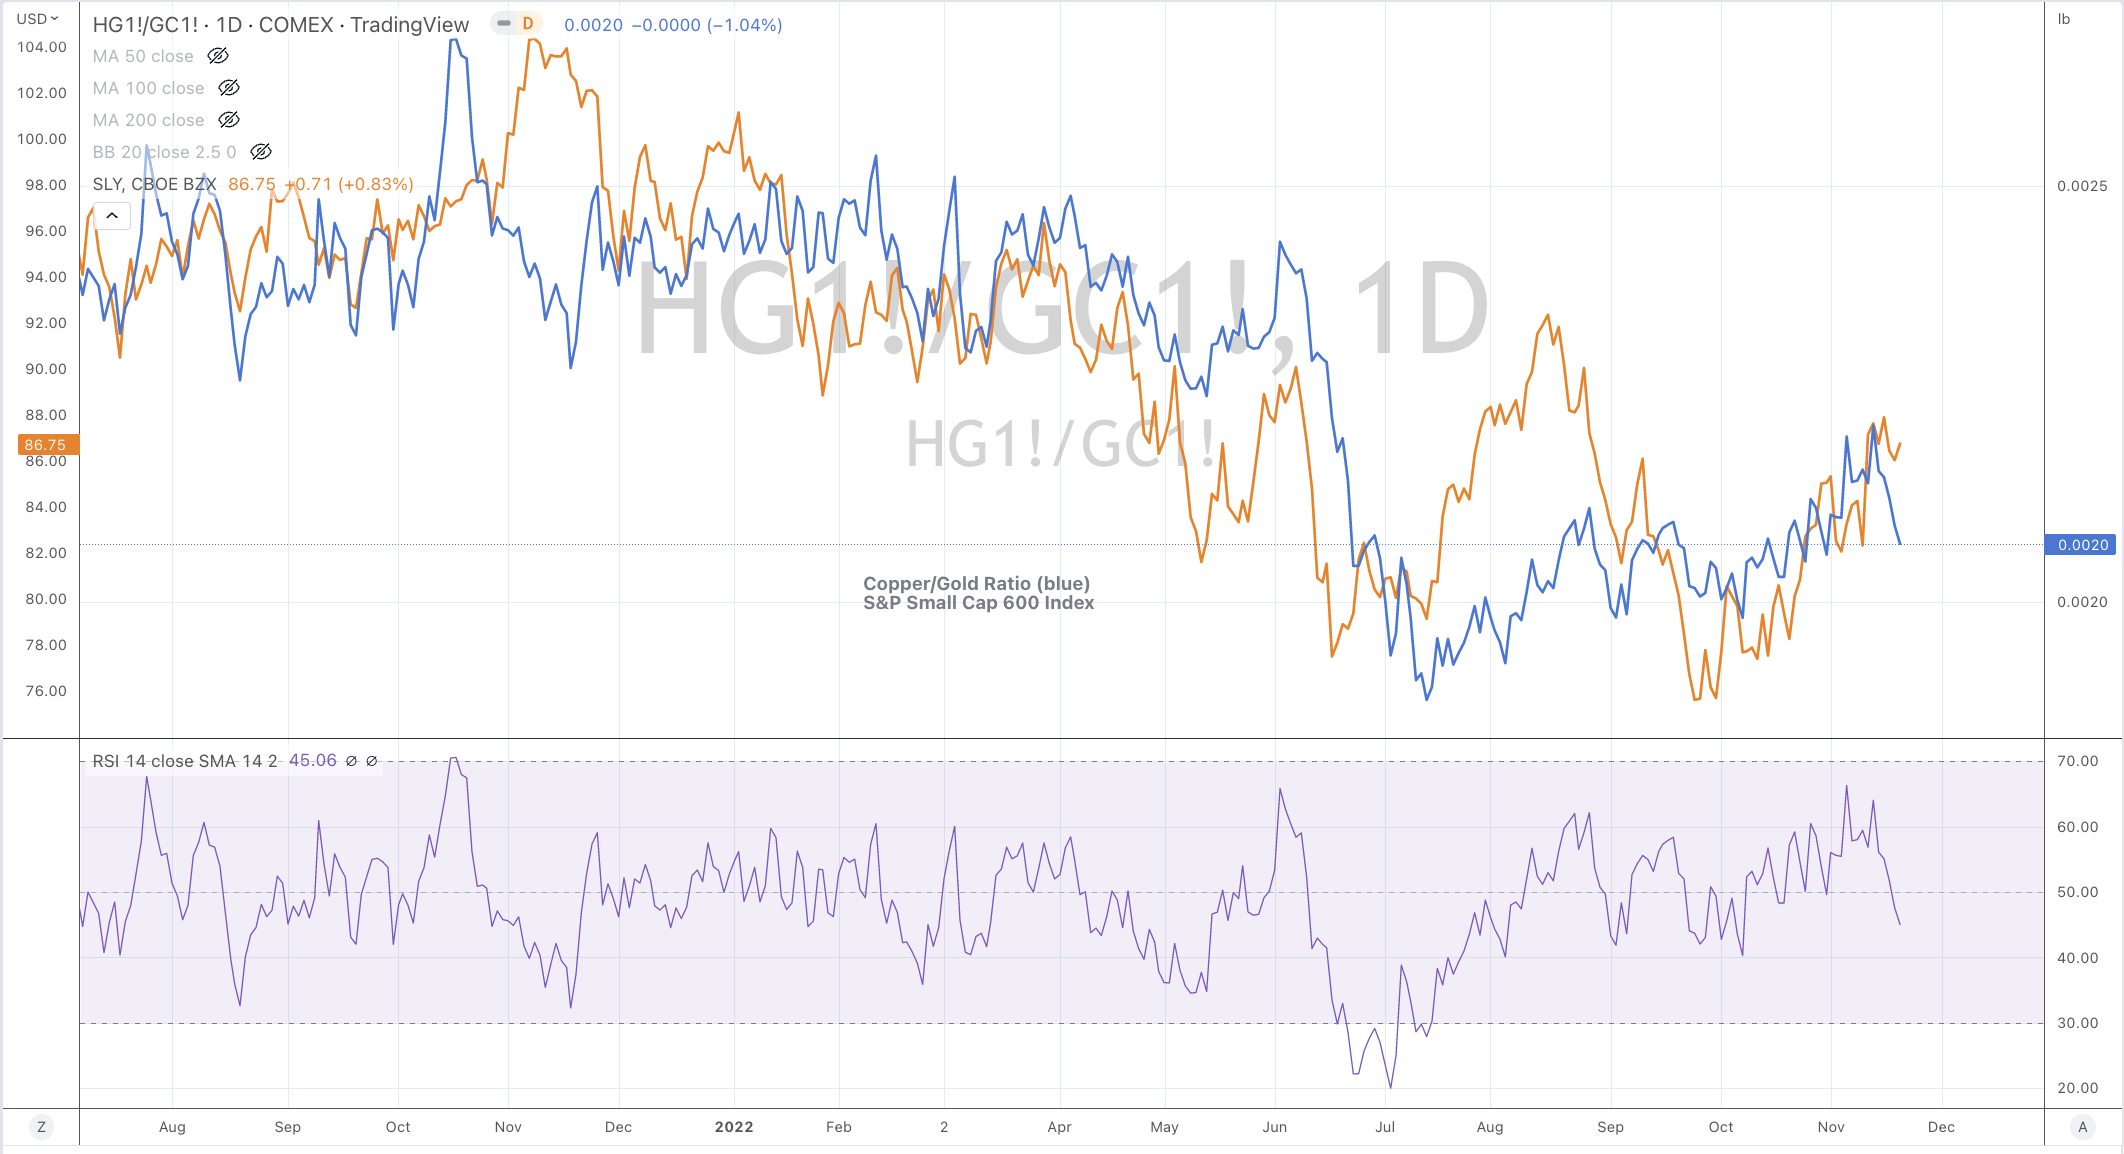
Copper – tactically sell copper from a trading perspective. Inversely, this means don’t buy or chase it at these levels.
This also goes for copper related equities.
Strategically, don’r sell your copper assets and corporate buyers of asset should wait a little longer.
Sugar – farmers should consider locking in selling prices. Equally, higher sugar prices will (slightly) crimp profit margin for the like of Nestle, Lindt, Barry Callebaut and Coca Cola. I say slightly for Cocoa prices (where relevant) are flat to benign over past few years.
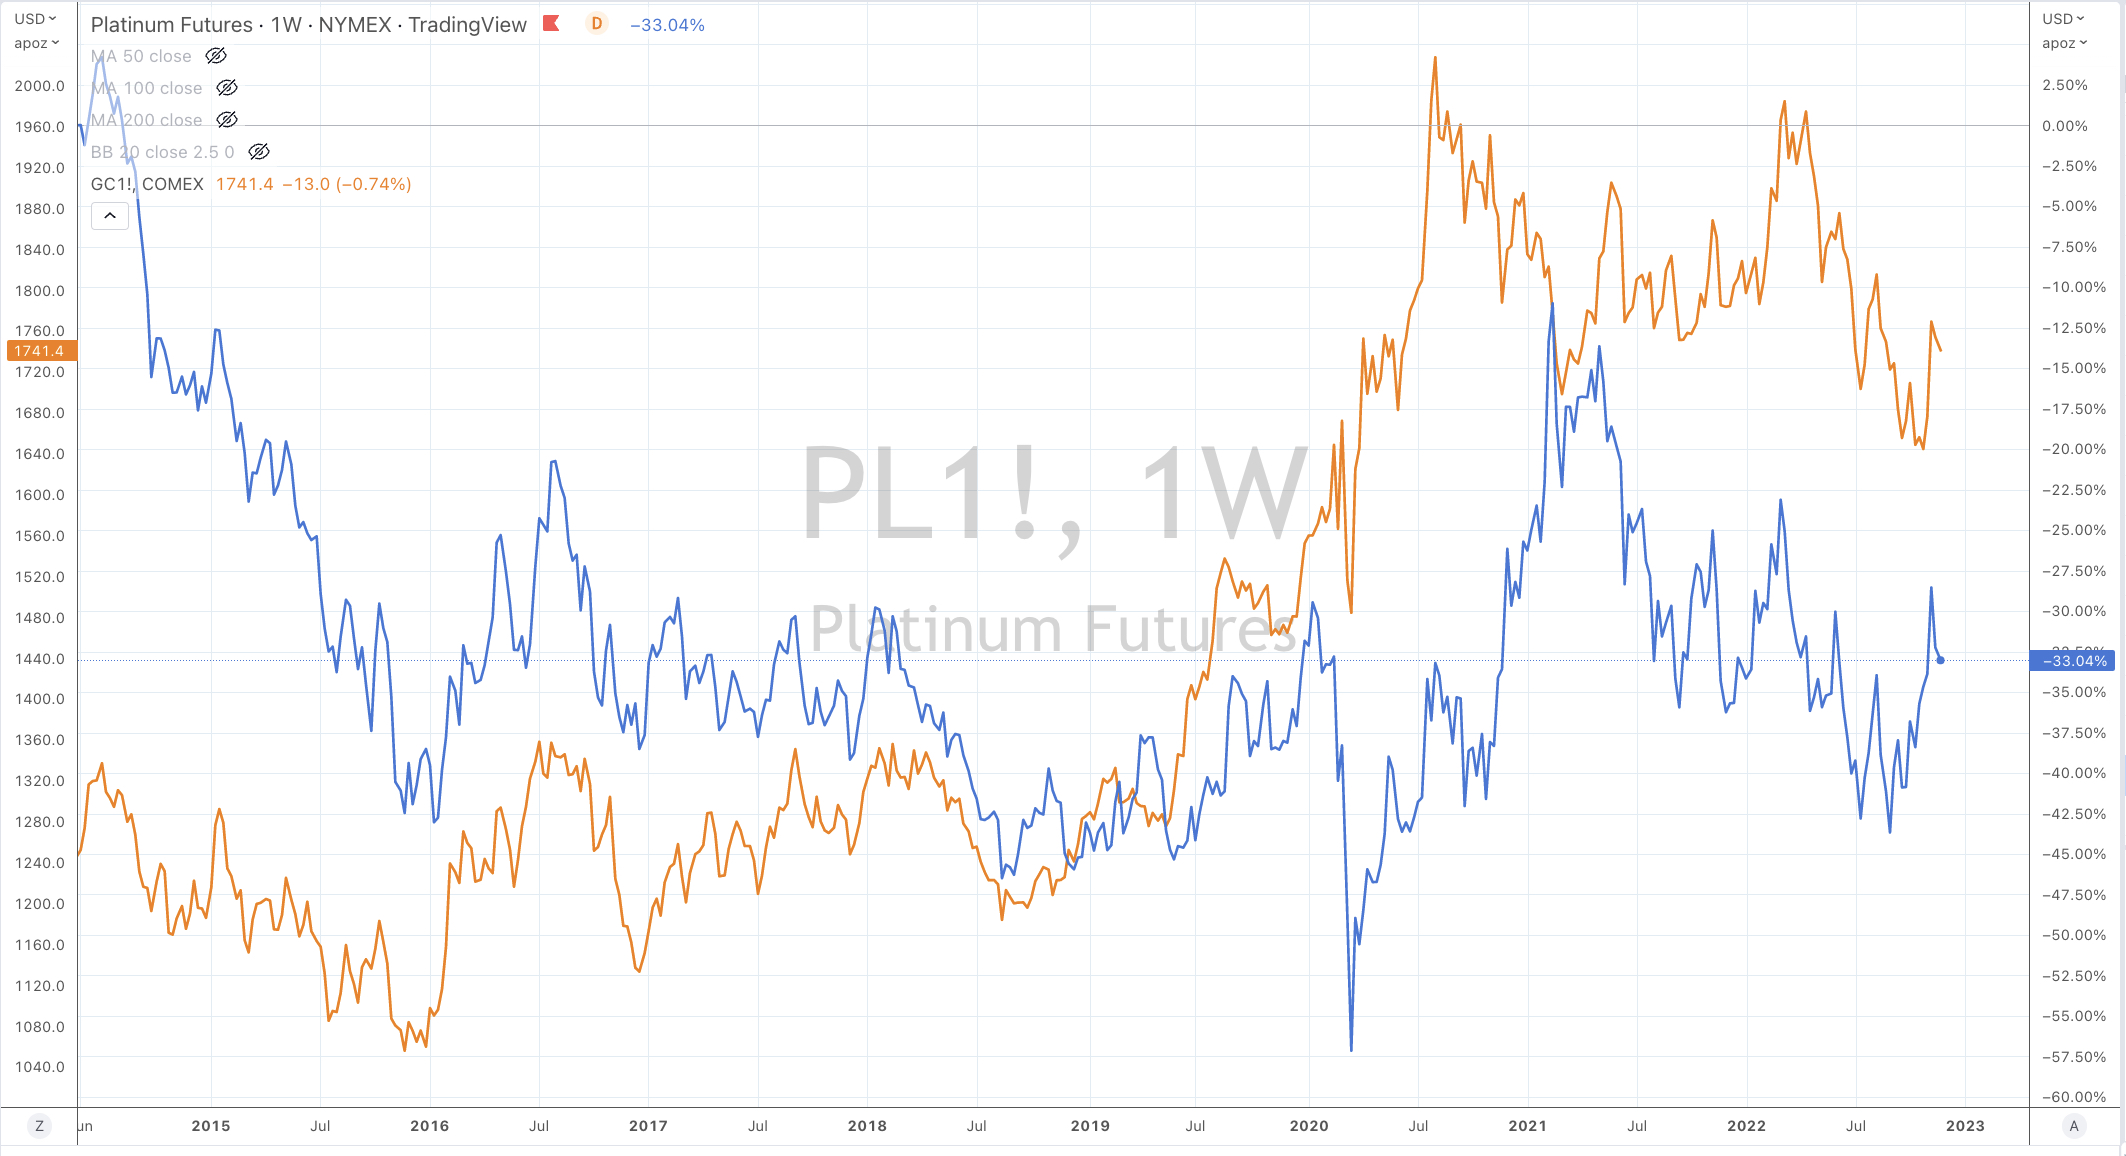
Platinum – touched a 2.5 standard deviation overbought level While I expect it to decline a further 7% from its current price of $973, Platinum often precedes a move lower on its less precious cousin, Gold.
Note, this is a trading view and thus tactical.
Silver also produced the same reading and it too, on a daily basis is expected to pullback a little, although both metals are in bullish trends but their strength is waning. This is something to watch.
I bet on lower prices in the interim.
Cattle – it’s opportune for farmers to accept this high price. Not so good for beer processors such as JBS nor buyers of product such as McDonald’s (the single largest beef purchaser in the United States).
This could make plant based alternatives more attractive. I’m yet to do any work on that angle.
Coffee – the price of Arabica beans are cheap. Oversold, at least. This is good for coffee bean importers and roasters to lock in their prices of their ‘green’ beans. Perhaps beneficial for Starbucks and Olam.
Steel – U.S. Midwest Hot Rolled Coil Steel is in the doldrums. Such a trough in prices is commensurate with the out-of-favour behaviour of equity prices in various steel companies.
November 21, 2022
by Rob Zdravevski
rob@karriasset.com.au