What if bond yields halve?

I think U.S. 2 year bond yields will fall.

I also think that the Australian 2 year bond yields decline.

I think they respectively test (+/- 0.10%) these next levels;

Aussie 2’s

3.5%, 2.85% & 2.30%

U.S. 2’s

4.10%, 3.35% & 2.75%

The trick will be the timeframe, but I’m going to put it somewhere between the next 7 – 15 months.

If this eventuates, the recent decline in yields such as the U.S. 2’s only falling from 5.26% to their current 4.83%. is hardly newsworthy.

Moreover, I’m pondering all of the affects that such a move would have on other assets and businesses.

This note is reprising my October 30, 2023 comments doubting the calls for higher yields, lasting for longer.

November 17, 2023

by Rob Zdravevski

rob@karriasset.com.au

Nickel is back……..down

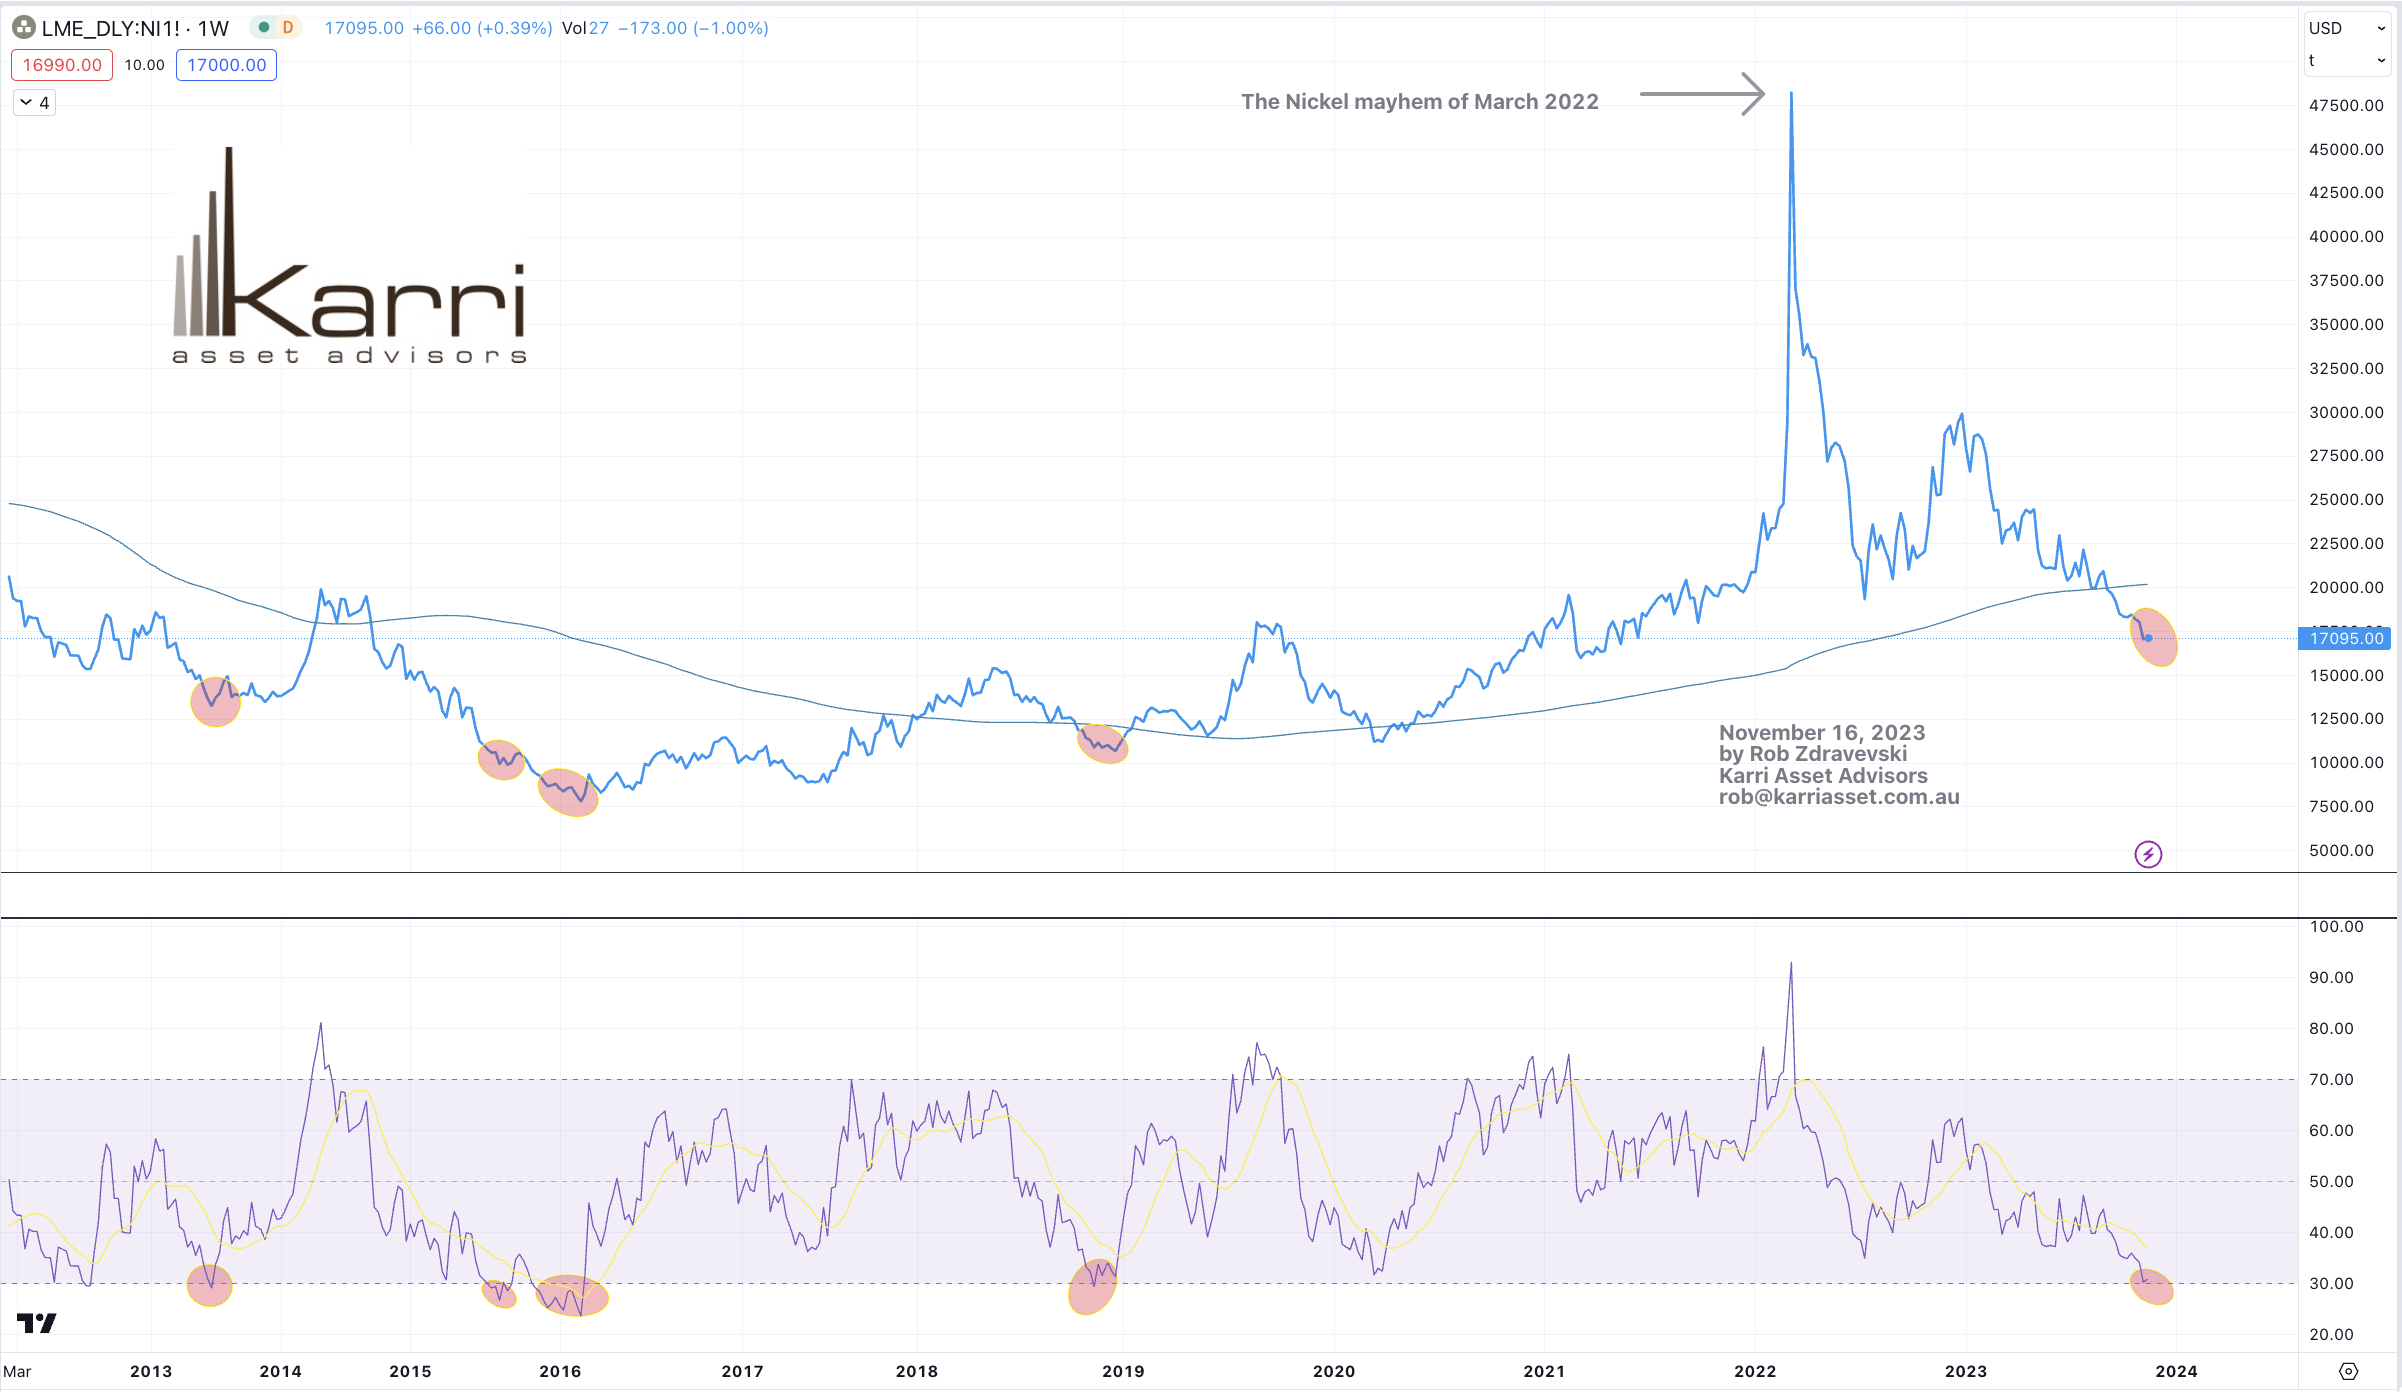
Readers of my weekly Macro Extremes newsletter may have noticed that the Nickel price is appearing in the Oversold category.

It doesn’t happen all that often.

And so how to position for this view may come in the form of owning Nickel mining producers, or those hoarding Nickel reserves, perhaps it’s an opportune for buyers of Nickel (stainless steel) to lower their input costs or just buy Nickel itself.

November 16, 2023

by Rob Zdravevski

rob@karriasset.com.au

Equity markets are making good shapes

A monthly overbought ‘5 year forward real interest rate’ portends a trough in the S&P 500, 3 or 4 months hence.

The circles highlight the overbought 5 year real rate.

The rectangles point to the trough in the S&P 500.

November 16, 2023

by Rob Zdravevski

rob@karriasset.com.au

When inflation is oversold, I buy commodities

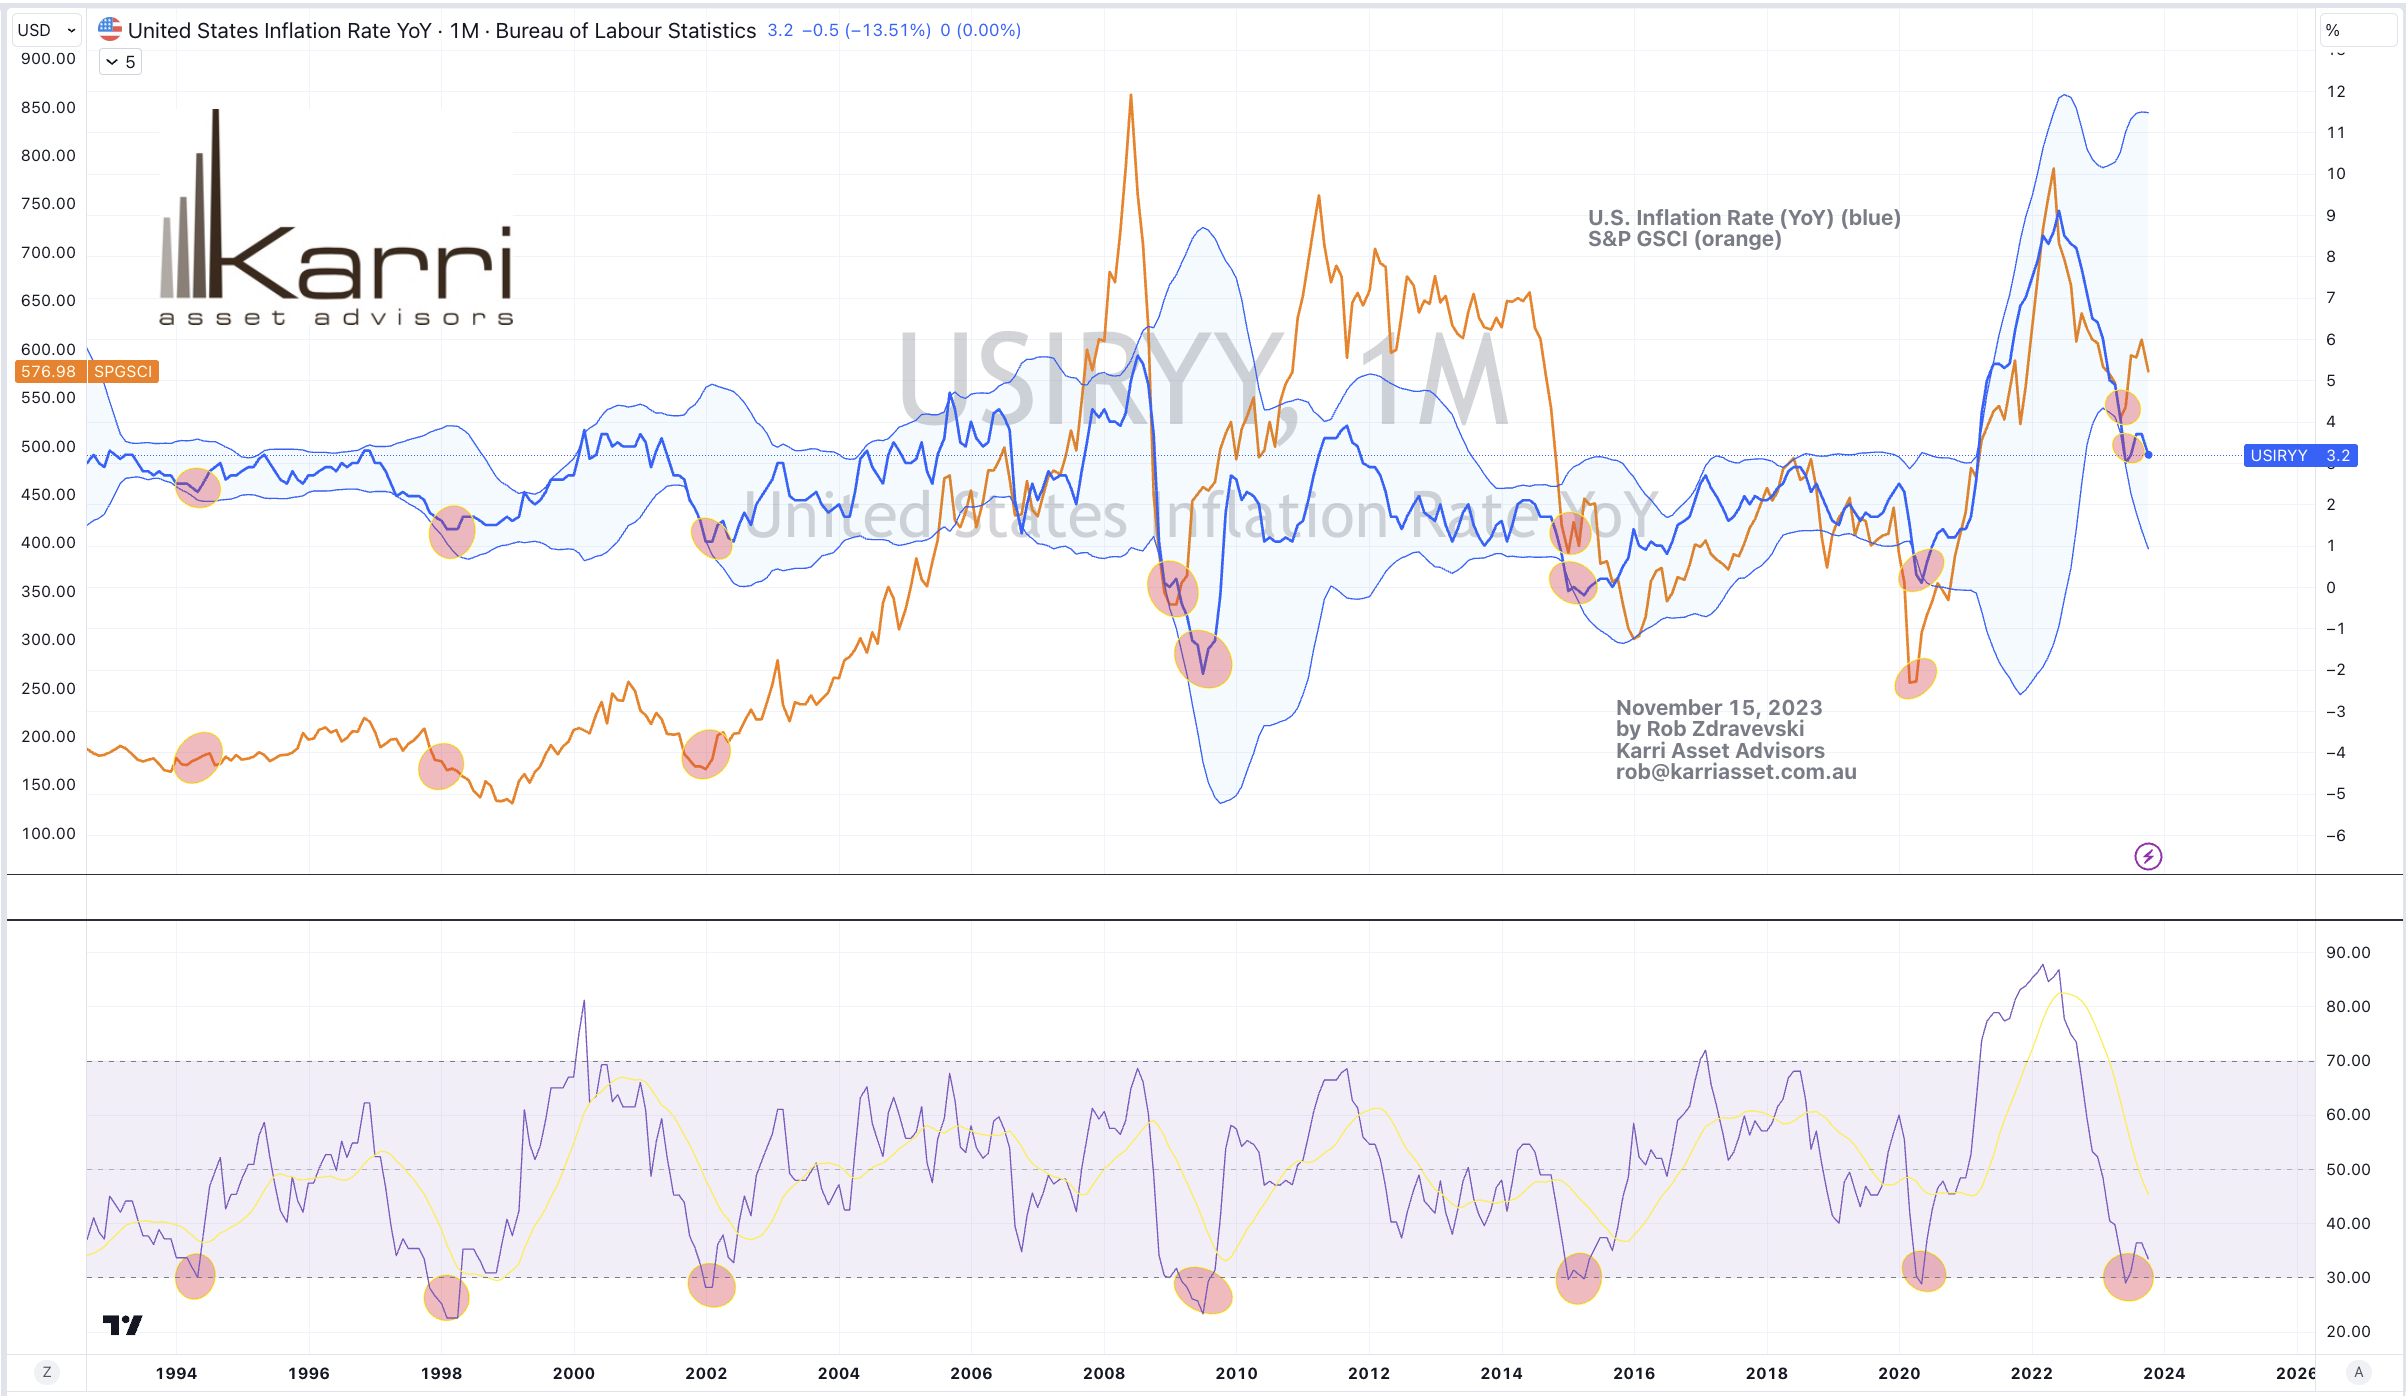
The U.S. Inflation Rate has been oversold (on a monthly basis) 7 times in the past 30 years.

This is represented by the blue line in the study below.

The most recent occurrence was a couple months ago.

Whenever this happens, probability points to a reasonable moment to accumulate commodities.

The orange line plots the S&P Goldman Sachs Commodity Index (SPGSCI).

November 15, 2023

by Rob Zdravevski

rob@karriasset.com.au

Anatomy of a trade – JLL

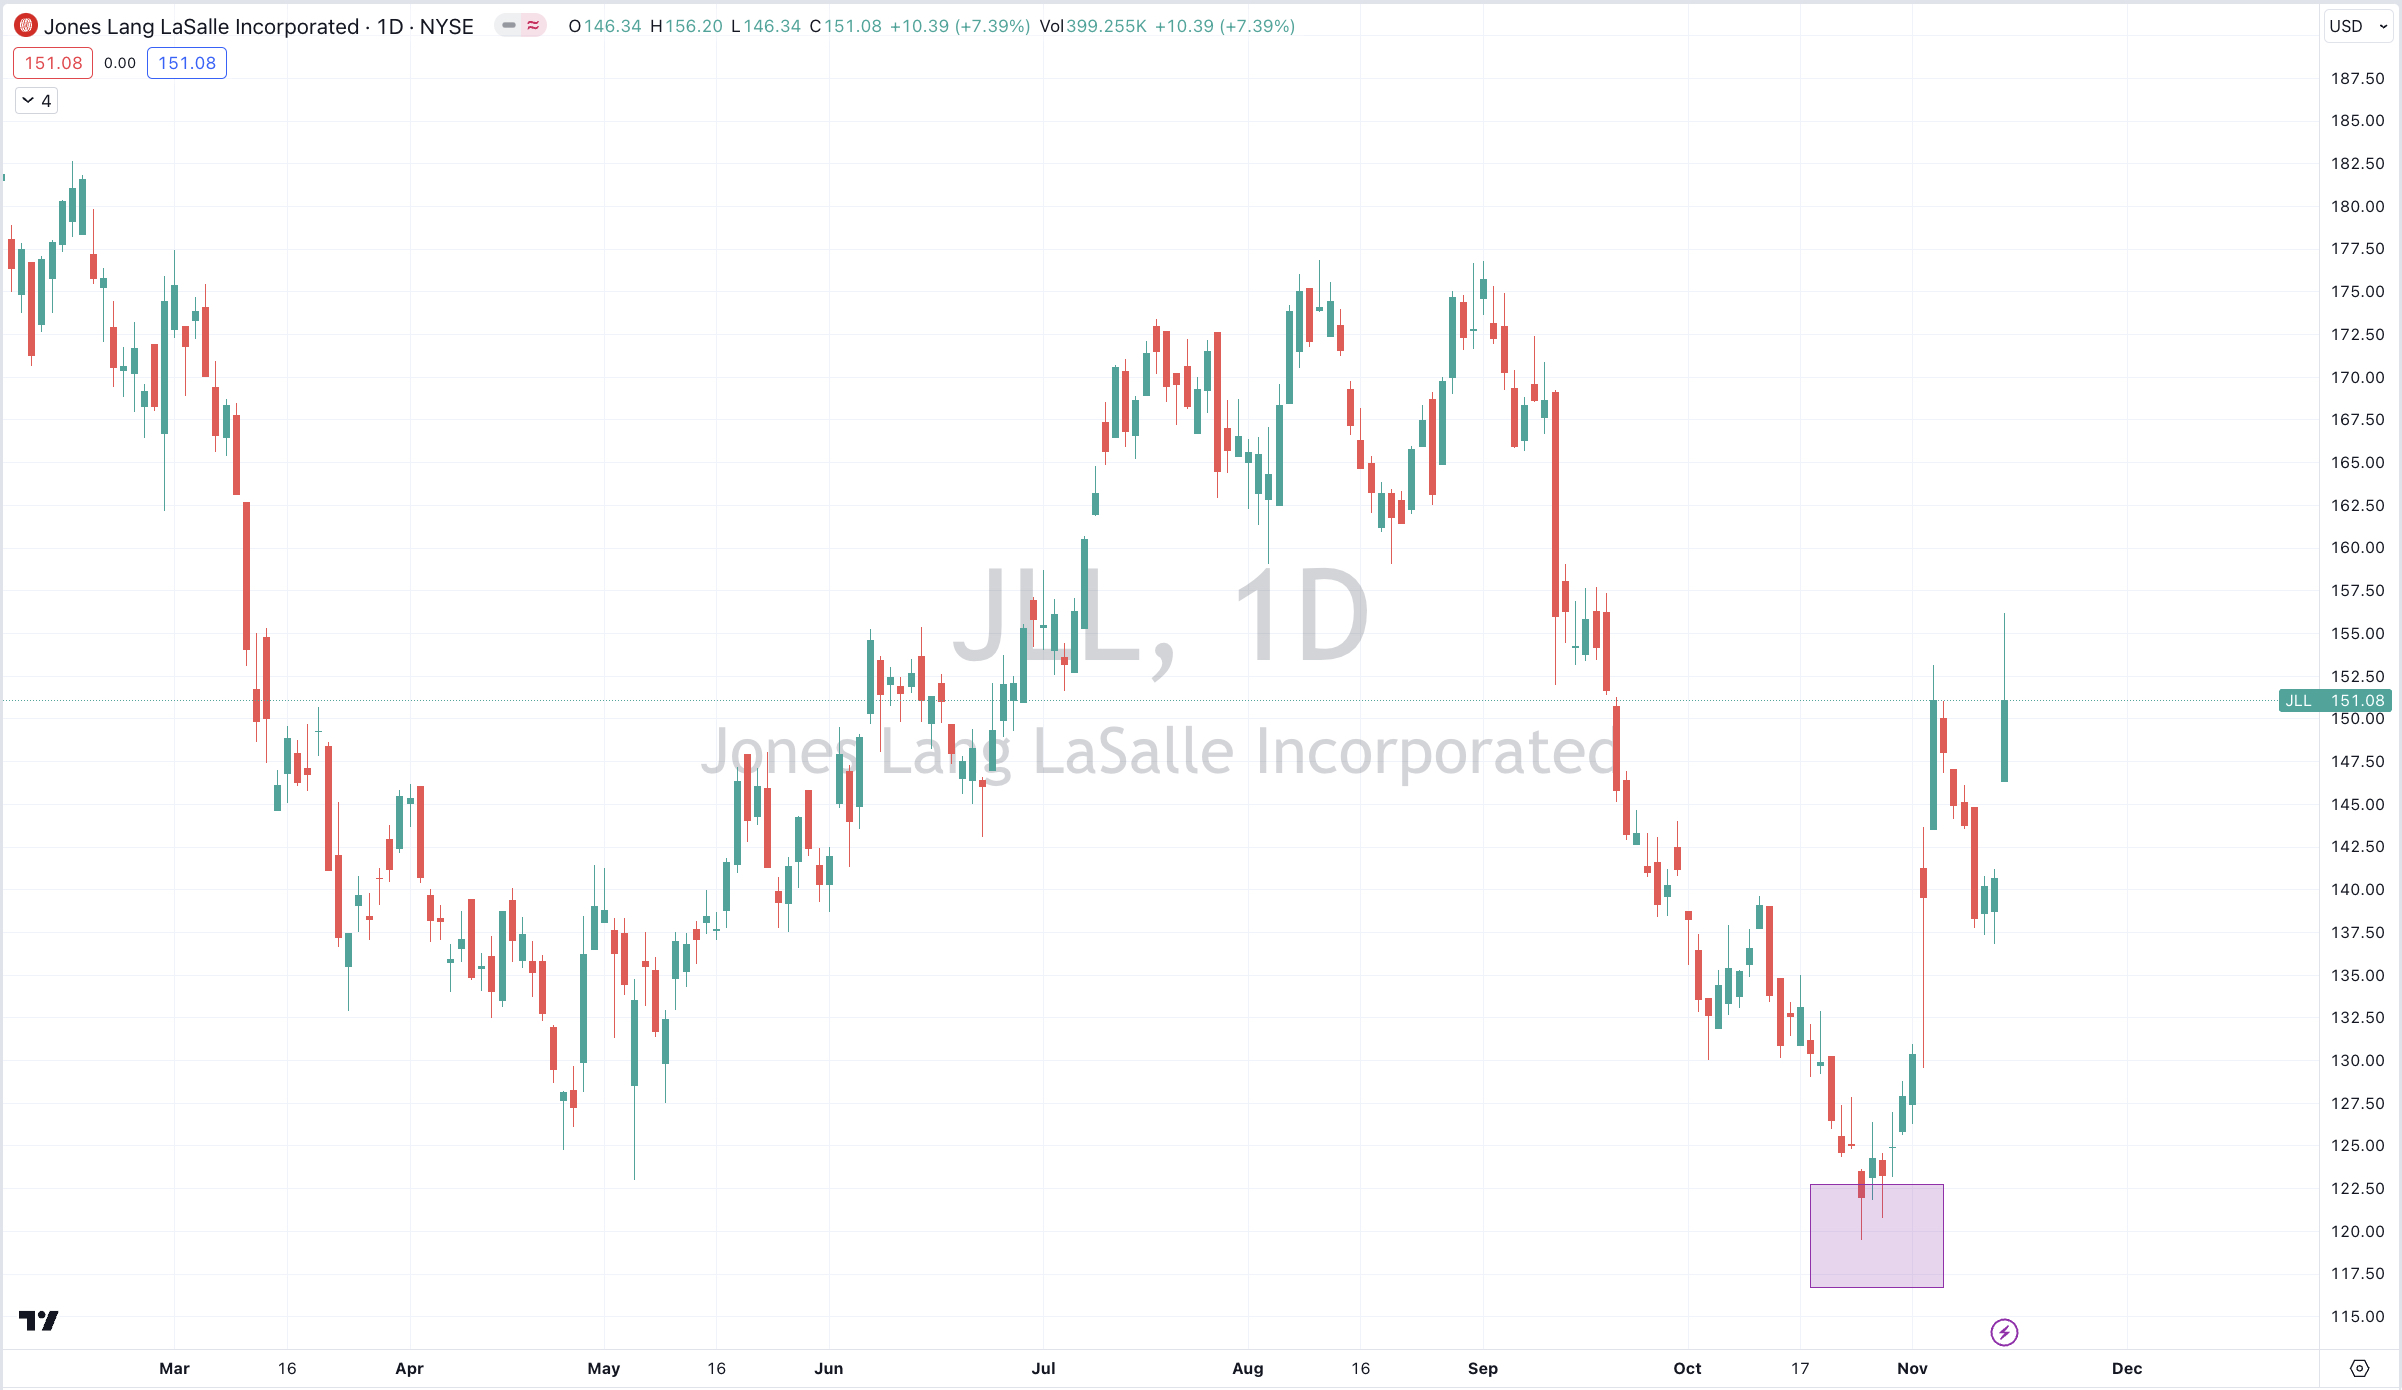
A month ago, I wrote this article eluded to my belief that “Big Cities Won’t Die” and I cited the shares of Jones Lang LaSalle (JLL) as one way I’l express my investment view.

https://robzdravevski.com/2023/10/12/big-cities-wont-die-jll/

The chart within the article featured an area where I wrote “the rectangles are moments to buy and accumulate”

That area was around the $118 – $128 region.

The stock traded down to $119.50. I was a buyer at $124.

Tomorrow (in Wednesday’s U.S. trading session), I am selling.

The stock closed today at $151.

Why am I selling?

It’s a 21% return within 3 weeks.

That’s more than 4 years worth of bank interest, earned under 1 month.

And I’m not a buyer at $151.

And I’m not confusing skill with being fortuitous.

I’m taking the profit, there are gaps below.

November 15, 2023

by Rob Zdravevski

rob@karriasset.com.au

Macro Extremes (week ending November 10, 2023)

A weekly Macro, Cross Asset review of prices trading at extremes which may generate future investment ideas and opportunities.

The following assets (on a weekly timeframe) either registered an Overbought or Oversold reading and/or have traded more than 2.5 standard deviations above or below its rolling mean.

Extremes “above” the Mean (at least 2.5 standard deviations

Swiss 10 year government bond yields 

Coffee

Overbought (RSI > 70)

Turkish 10 year government bond yields 

USD/JPY

Uranium 

And Rubber

The Overbought Quinella – Both Overbought and Traded at > 2.5 standard deviations above the weekly mean)

Cocoa

EUR/JPY

Extremes “below” the Mean (at least 2.5 standard deviations)

Cotton

Coffee

Cattle

Newcastle Coal

Platinum 

Oats 

AUD/JPY

Oversold (RSI < 30)

Lithium Hydroxide

Nickel 

JPY/USD

The Oversold Quinella – Both Oversold and Traded at < 2.5 standard deviations below the weekly mean)

Palladium

JPY/EUR

Notes & Ideas:

Government bond yields were mixed. The European and U.S. government bond yields were higher, although on a week to week closing basis, the advance wasn’t as much as the financial media would’ve led you to believe.

Furthermore, the U.S. bond yields still aren’t as high as those seen 3 or 4 weeks ago, which is evident in the 30 yer bond yield, which were actually lower this week.

Australian yields were flat to lower. Short duration British yields were lower.

Japanese bond yields fell and took a break from being overbought. 

In fact, readers may find it interesting to look back the past 4-5 editions of ‘Macro Extremes’ to note those bond yields which were overbought then…..and are no longer so, today.

And I need to look at the U.S. 10 year minus German 10 year yield spread as it’s nearing overbought territory.

Equities were subdued and mixed, with a slight bias for weakness.

The ones that bucked the weakness appear below mainly led by the Nasdaq.

The ASX 200 closed unchanged. Technically, it fell 0.02%.

The largest advancers for the week are listed at the end of this note.

And, all of the indices which appeared as oversold in the past week’s, are no longer so. 

Commodities were weaker, again. 

The weakness amongst energy contracts (for the 3rd consecutive week) weighed heavily on commodity indices. 

WTI Crude has closed at its lowest point since late July 2023. It has fallen 13% over the past 3 weeks.

Heating Oil is in a 4 week losing streak and has declined 16% in the past 4 weeks.

Gasoline was flat for the week although it’s interesting to note its 25% slump since August 2023.

Natural Gas fell 14% this week and as a result isn’t overbought.

This week sees Cotton, Coffee and Cattle return to being oversold.

Baltic Dry Index rallied 12%, making up half of the past fortnights decline.

Uranium remains overbought for an 13th consecutive week.

while Lithium Hydroxide declining streak extends to 18 consecutive weeks.

It looks like a change of trend approaching for the price of Corn.

Precious Metals are in a downdraft with Palladium and Platinum getting a hiding.

And I reflected on the recent overbought nature of Canadian Dollar priced Gold.

Amongst currencies, the Australian Dollar was weaker while the U.S. Dollar and Euro we’re stronger.

The AUD/EUR had an outside bearish week as did the AUD/IDR.

The BRL/USD fell a mere 0.10%, taking a break from its 4 week rising streak.

And as pre-empted in last week’s edition, the Japanese Yen is now registering extremes against the USD and the Euro.

The larger advancers over the past week comprised of;

Baltic Dry Index 12.4%, Cocoa 3%, Hot Rolled Coil Steel 2.3%, Tin 2.8%, Newcastle Coal 3%, Orange Juice 6.4%, Rice 5.6%, Bovespa 2%, Nasdaq Composite 2.4%, KOSPI 1.7%, Nasdaq 100 2.9%, Nikkei 225 1.9%, SOX 4% and the S&P 500 rose 1.3%.

The group of decliners included;

Australian Coking Coal (4.6%), Aluminium (1.8%), Bloomberg Commodity Index (3.4%), China Coking Coal (7.2%), WTI Crude (4.2%), Cotton (2.9%), Gasoil (10.7%), Copper (2.6%), Heating Oil (6.2%), Cattle (5.3%), Natural Gas (13.7%),  Palladium (13.3%), Platinum (10.5%), Sugar (1.7%), S&P GSCI (3.4%), CRB Index (3%), Dutch TTF Gas (3%), Brent Crude (4.1%), Silver in AUD (1.8%), Silver in USD (4.1%), Gold in CAD (1.7%), Gold in USD (2.7%), Corn (2.8%), Oats (6.8%), JKM LNG (2.2%), KBW Banking Index (2.1%), HSCEI (2.5%), Hang Seng (2.6%), S&P SmallCap 600 (3%), KRE Regional Bank Index (5.2%), S&P MidCap 400 (1.6%), Nasdaq Biotechs (4.3%), Russel 2000 (3.1%), SET (2.1%) and the S&P SmallCap Value Index fell 3.5%.

November 12, 2023

by Rob Zdravevski

rob@karriasset.com.au

More than 100% of Albemarle’s stock has turned over

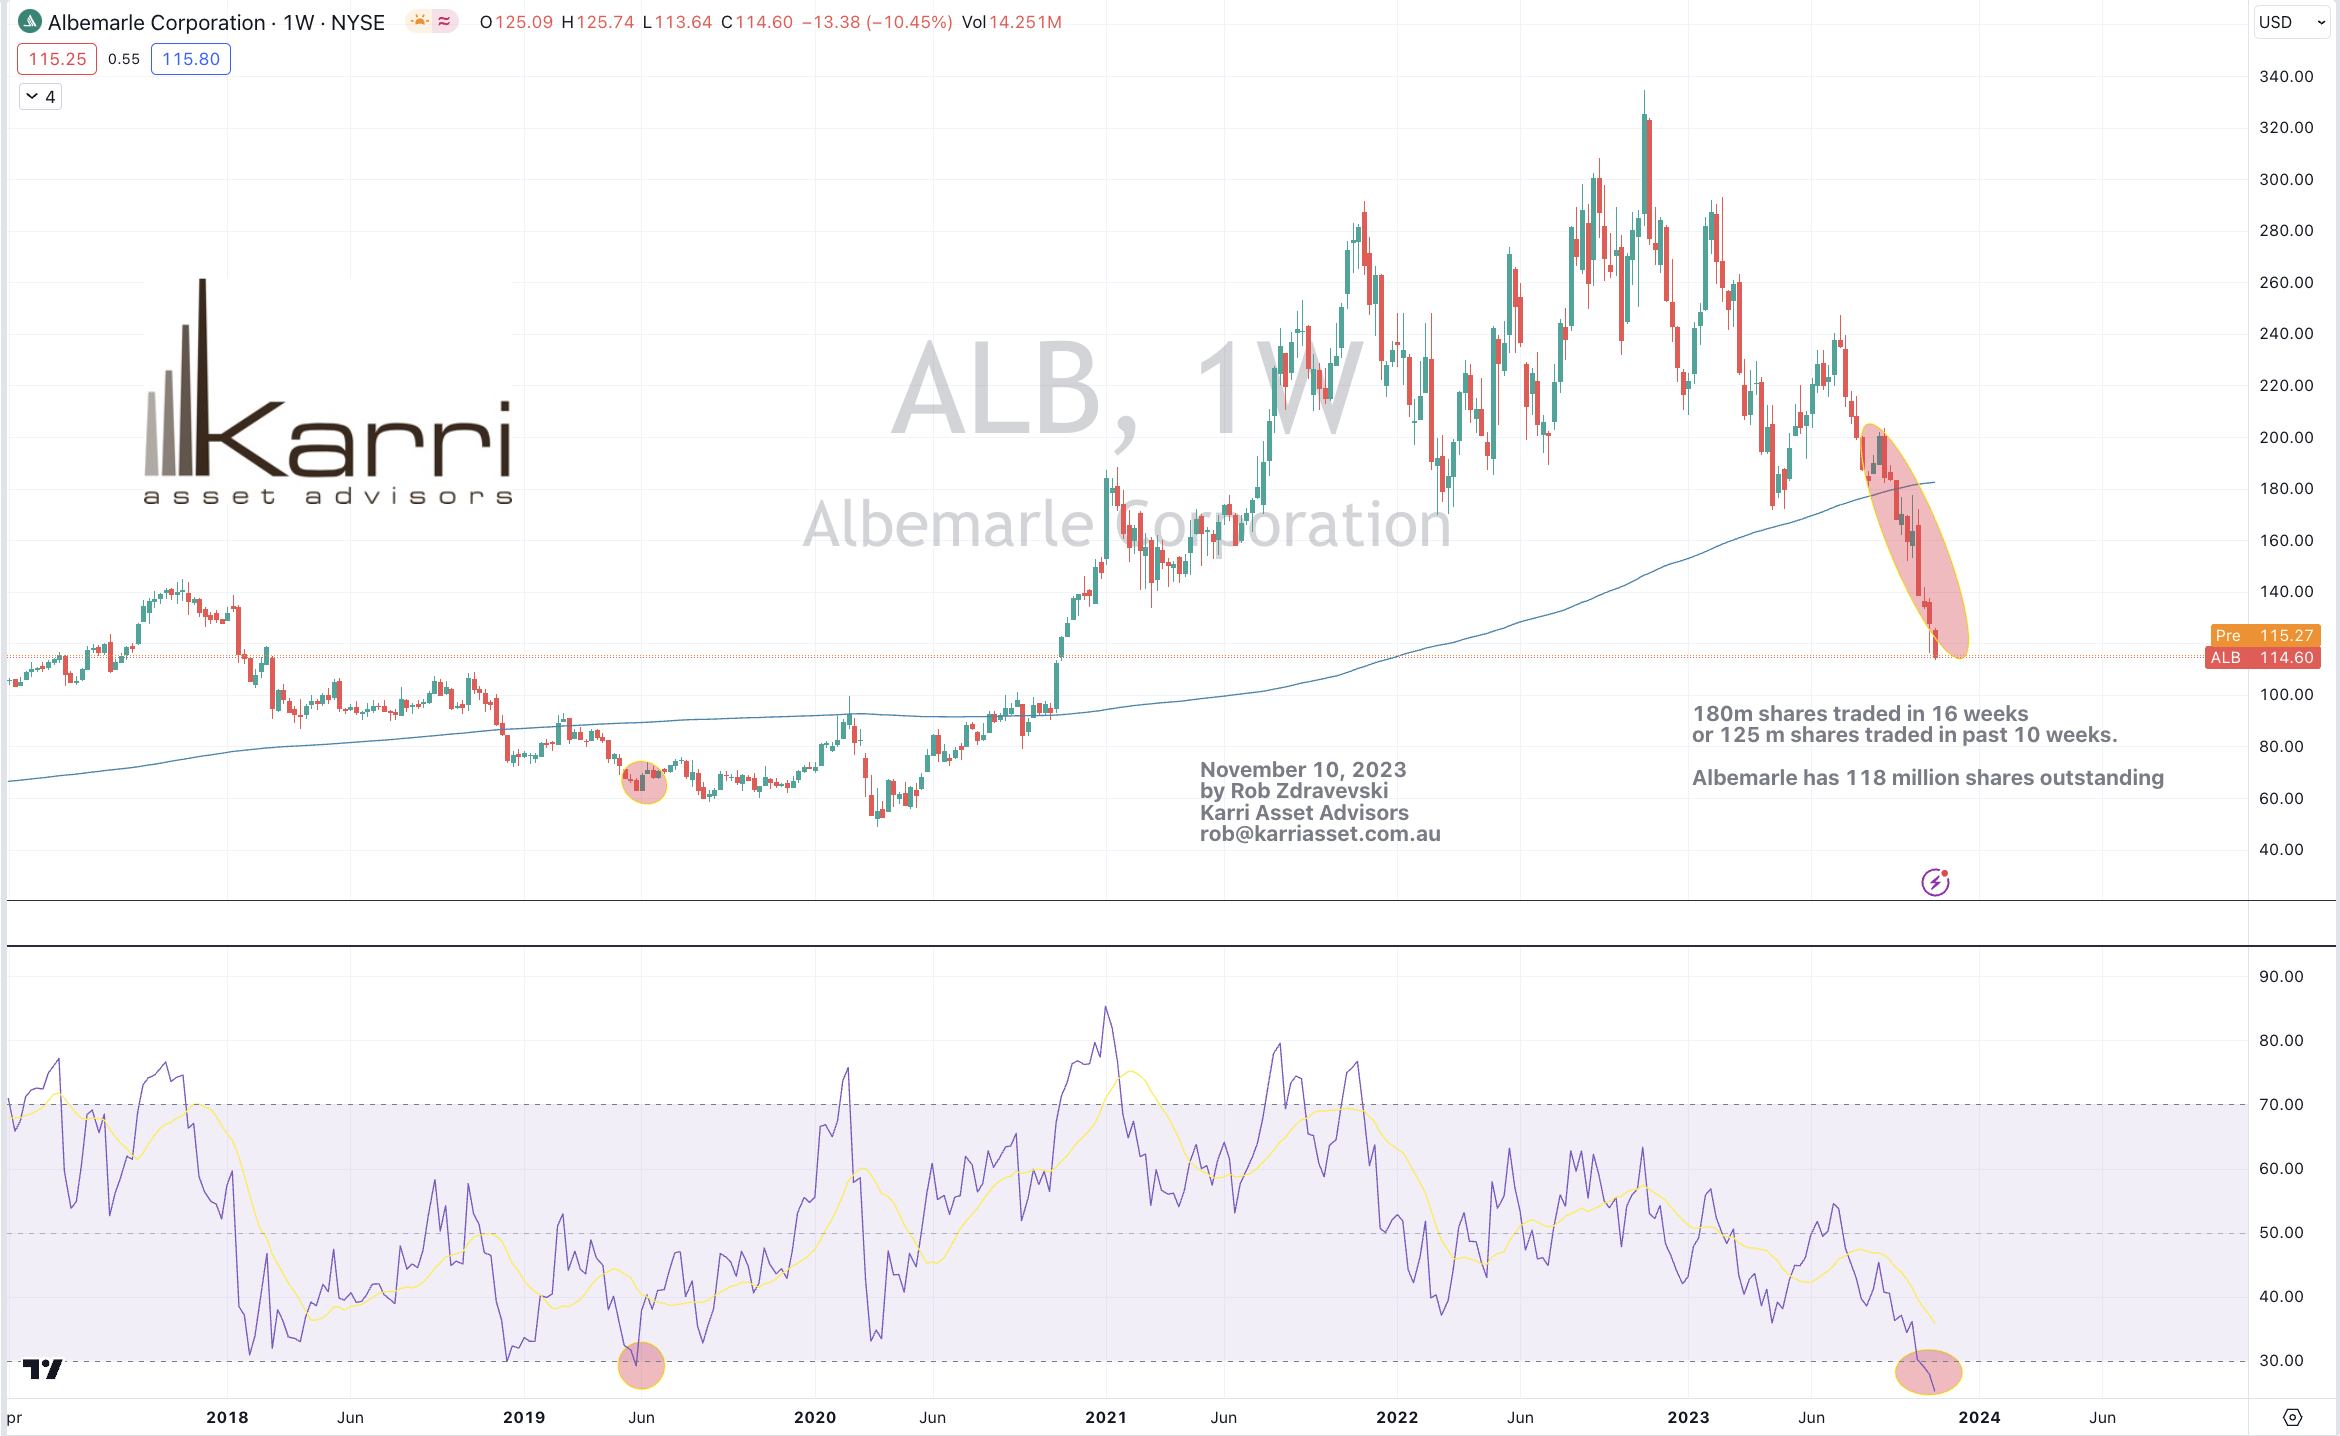
The stock price of Bromine and Lithium company, Albemarle (ALB:US) has not been this ‘oversold’ on a ‘weekly’ basis since May 2019.

That’s 4.5 years ago.

The stock price has halved in the past 4 months.

Absent of any fundamental analysis;

over the past 3 months, 180 million of its shares have traded;

and over the past 10 weeks, 125 million of its shares have turned over.

Albemarle has 118 million shares on issue.

More than 100% of the company’s shares outstanding, have traded over those mentioned periods.

This is one possible example of where weaker hands (the un-natural owners?) have passed on their shares to ‘stronger hands’ or perhaps the ‘natural’ owners.

November 10, 2023

by Rob Zdravevski

rob@karriasset.com.au

Don’t root for the Phillies

Once again, we need not worry about a recession.

Throw away of your inverted yield curves based analysis and everything else.

The Major League Baseball season has concluded.

During the playoffs, the Philadelphia Phillies baseball Club was (personally sadly) eliminated.

When the Phillies won the World Series in 1980, the following year a recession in the United States of America was officially announced by the National Bureau of Economic Research (NBER).

Then when the Phillies, again, won the World Series in 2008, the NBER declared an official recession the following year.

As a result of the Phillies not winning the World Series, we won’t see a recession in the U.S. in 2024.

It’s that simple.

November 8, 2023

by Rob Zdravevski

rob@karriasset.com.au
An oversold {inflation minus commodity prices} ratio is good for equities.

Below is a study where I compare the ratio of the U.S. Inflation Rate (YoY) minus the S&P GSCI (Goldman Sachs Commodity Index) represented by the blue line, and when it trades to 2.5 standard deviations below its rolling monthly mean while its Monthly RSI also registered a reading of below 32.

The vertical lines show 8 moments over the past 40 years when that has occurred.

The most recent was only a few months ago.

Those moments also correspond to a longer term advance in the S&P 500, which is illustrated by the orange line.

November 7, 2023

by Rob Zdravevski

rob@karriasset.com.au

The de-equitisation of the ASX

The Australian Stock Exchange (ASX) has 2300 entities listed on it,

of which, 220 are ETF’s (Exchange Traded Funds) and a further 80 are LIC’s (Listed Investment Companies).

If we subtract those, we are back now to 2,000 ‘companies’.

Less the 90 companies which are are suspended,

takes us down to 1,910.

Dissecting those remaining 1,910 companies……

767 of them have market capitalisations below $25 million,

a further 256 are trading with a market cap between $25-$50 million,

and another 209 have market caps between $50m – $100m.

That’s a total of 1,230 companies (of the 1,910 left ‘trading’) having market caps of $100 million or less

And 170 companies have market caps between $100m and $200m.

Of that group, we have a total of 1,300 companies with a market cap below $200m.

Arguably, 68% of the companies listed on the ASX hardly matter, and less so to global investors.

Perhaps 40% of the total listed companies, shouldn’t be listed, at all.

Of the 600 companies remaining, 200 companies are trading with market caps between $200 and $686 million.

The 400th largest company has a market cap of $686 million.

The Australian equity market is shrinking and thus “de-equitising”.

The silver lining is…that being a public company allows investors to sift through a company’s particulars freely.

The de-equitisation of the ASX is a positive for the shareholders as feasible investment opportunities are becoming scarce.

It’s not good for the Australian Stock Exchange per se.

Scarcity and tension is also increasing as pension (superannuation) and private equity funds are seeking to deploy more of their ‘idle’ capital.

An added ’squeeze’ is that Australian companies are ‘cheap’ on a U.S. Dollar basis.

With a currency trading at an USD/AUD exchange rate of 0.6400…..buying an Australian business which has a market cap of A$400 million, doesn’t seem to much when you consider the price tag to an American buyer is only US$256 million.

The other ‘bullish’ reference I’ll leave readers with is that in 2003, there were nearly 8,000 securities listed on U.S. equity exchanges.

Today, it’s close to 5,000 securities.

That is the picture of de-equitisation and scarcity.

November 6, 2023

by Rob Zdravevski

rob@karriasset.com.au