ASX 200 – Still Boring & Sideways
May 8, 2023 Leave a comment
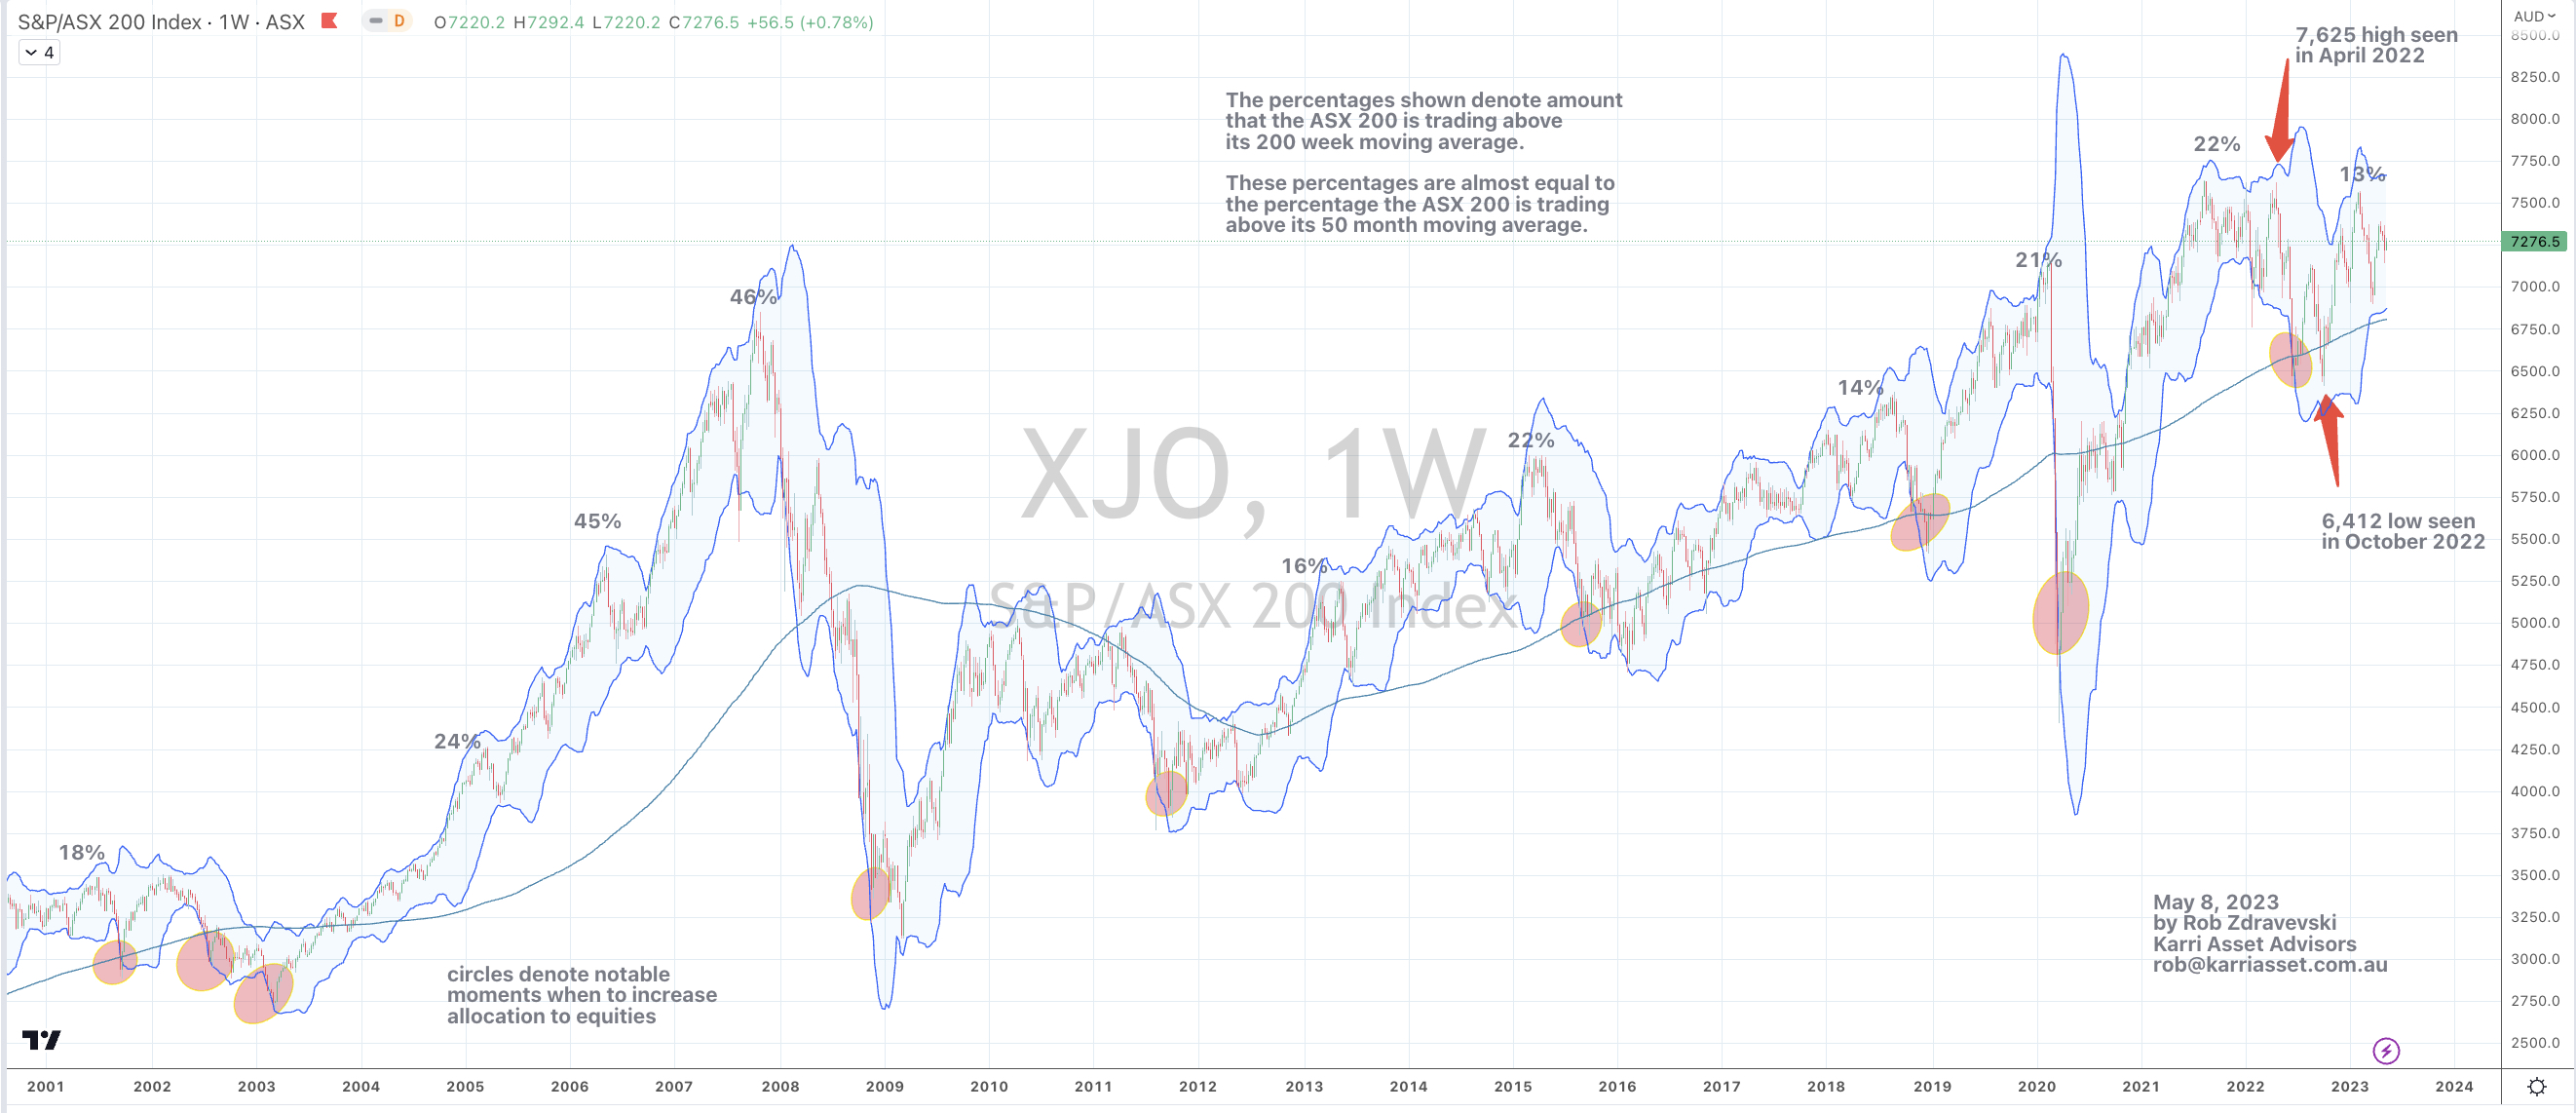
In the ASX 200 equity index chart attached below;
the percentages shown denote amount that the ASX 200 is trading above its 200 week moving average and…….
these percentages are almost equal to the percentage the ASX 200 is trading above its 50 month moving average.
The index remains in sideways travel for the past 2 years while investors and their capital watch for a break either side of the recent high and low marked on the chart.
This study also tells me in the absence of an obvious buy signal from an ‘extreme low moment’ along with the index unable to make a new ‘higher high’, my bias is for lower prices.
Other studies also inform me that the current upward trend is weak.
May 8, 2023
by Rob Zdravevski
rob@karriasset.com.au