I’m forever blowing bubbles

On August 31, 2022, I wrote this note that cited ‘bubbles I saw in Coal, LNG, Coal and Gas prices.

9 months later, they have deflated.

I have attached charts showing how those prices have travelled since that last week of August in 2022.

The 200 week moving average appears in each chart which formed part of the thesis for mean reversion and price declines.

Today, these commodities are trading at the other end of their pendulum and extremes.

June 14, 2023

by Rob Zdravevski

rob@karriasset.com.au

Selling AUD / Buying USD at 0.6805

In last night’s trading AUD/USD traded to a high of 0.6807, which was within my 0.6805 (+/- 10 bps) call as written in this note, a few days ago.

For now, it is yet to break above the 0.6818 level also mentioned.

Should the AUD/USD not breach 0.6818, probability increases of further leg lower in commodity prices as measured by the CRB Index and S&P Goldman Sachs Commodity Index (SPGSCI) along with a strengthening of their current downtrends.

June 14, 2023

by Rob Zdravevski

rob@karriasset.com.au

A low in Natural Gas means a lot of things

Natural Gas is trading at a price where it’s flirting around historical percentages below its 200 week moving average.

Coupled with entering weekly oversold territory, my interest is heightened.

Prior to initiating a long position, I’ll need to combine a few other studies and allow some variance on the price entry.

note: a bottoming Natural Gas price could also end the abatement seen in inflation along with a few other correlated prices and measures.

June 12, 2023

by Rob Zdravevski

rob@karriasset.com.au

Cocoa is trading in rarefied air

It was 9 years when the price of Cocoa last registered a Monthly overbought reading.

This is the 5th time this has occurred over the past 45 years.

While Cocoa also appears in my recent edition of Macro Extremes which observes ‘weekly’ timelines, this Monthly moment is something to note.

This doesn’t mean speculators necessarily initiate ‘short’ positions but it should motivate growers and wholesalers to lock in forward pricing and it’s a warning flag for long side momentum traders and industry buyers.

But when such an event occurs, it soon after bodes well for the accumulation of securities in those who make chocolate such as Nestle, Barry Callebaut and Lindt & Sprungli.

Inversely, you’d think that the rising price of Cocoa would crimp the margins of confectioners and it may have, although higher costs (aided by shrinkflation) do get passed on.

After all, chocolate is an addition.

At such a juncture, investors and companies now begin to anticipate that the cost of such a major input will peak.

Incidentally, 6 weeks ago, I wrote this note about Sugar (the other major input) which was/is also trading at simultaneous weekly and monthly extremes.

June 12, 2023

by Rob Zdravevski

rob@karriasset.com.au

Macro Extremes (week ending June 9, 2023)

A weekly Macro, Cross Asset review of prices trading at extremes which may generate future investment ideas and opportunities.

The following assets (on a weekly timeframe) either registered an Overbought or Oversold reading and/or have traded more than 2.5 standard deviations above or below its rolling mean.

Extremes “above” the Mean (at least 2.5 standard deviations)
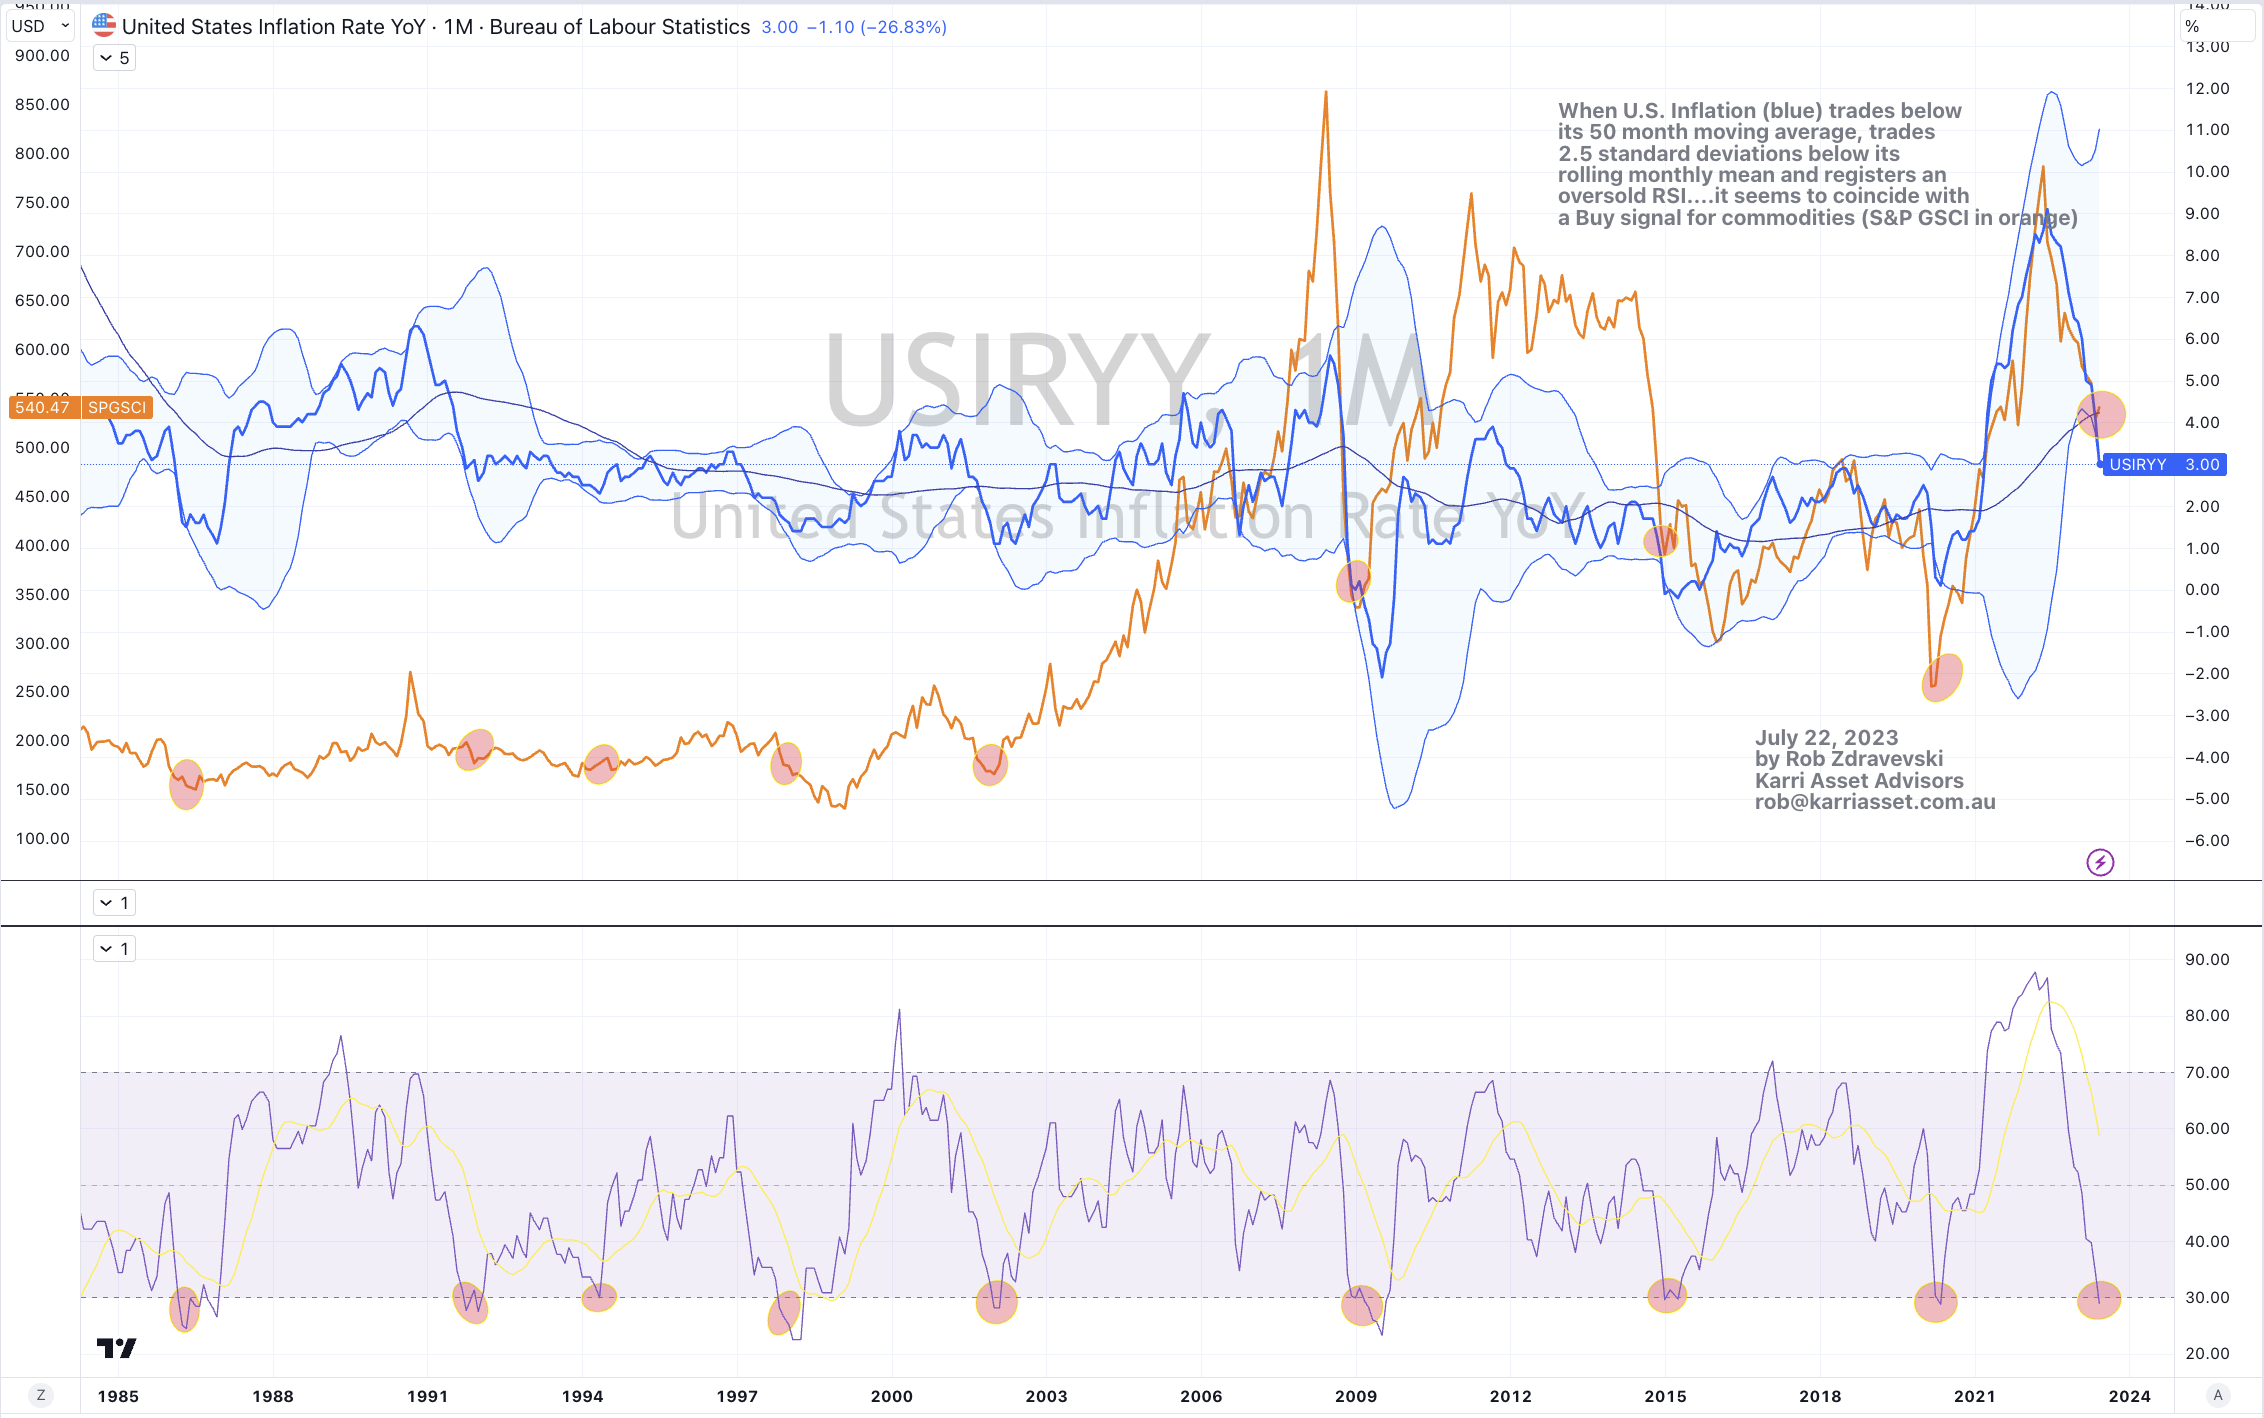
Australian 2 year government bond yields

Russian and Turkish 10 year government bond yields 

Australian 10 year yield minus U.S. 10 year yield

Rice

Istanbul equity index

Philadelphia Semiconductor Index (SOX)

Overbought (RSI > 70)

U.S. 3 month government bond yield

Russia’s MOEX index

Nasdaq 100

Cocoa

The Overbought Quinella – Both Overbought and Traded at > 2.5 standard deviations above the weekly mean)

British 2 year government bond yields

Taiwan’s TAEIX Index

Nikkei 225

Uranium

Cattle

Extremes “below” the Mean (at least 2.5 standard deviations)

U.S. 10 year bond yield minus Australian 2 year bond yield

U.S. 10 year bond yield divided by Australian 2 year bond yield

Shanghai equity index

CSI 300 equity index

EUR/GBP

Oversold (RSI < 30)

LNG Japan Korea Marker (JKM)

Lithium Hydroxide 

Newcastle Coal 

Urea (both U.S. Gulf and Middle East prices)

The Oversold Quinella – Both Oversold and Traded at < 2.5 standard deviations below the weekly mean)

Australian 10 year minus 2 year bond yield spread

Notes & Ideas:

Equities were generally higher. We saw some rotation towards mid and smaller caps although major indices didn’t perform as much as was portrayed in the media.

For instance, the Dow Jones Industrials firmed 0.4%, the S&P 500 climbed 0.4%, DJ Transports advanced 0.7%, Nasdaq Composite eeked 0.1% higher while the S&P MidCap 400 and SmallCap 600 both rose 1.4%.

While the Nasdaq 100 eased 0.1%, Toronto’s TSX fell 0.7% and the ASX 200 and ASX Small Caps fells 0.3% and 1.2% respectively.

Incidentally, the Russell 2000 has risen 5.1% in the past 2 weeks.

In other observations, Brazil’s Bovespa and South Korea’s Kospi are nearing overbought levels, the Nasdaq 100 broke its 6 weeks winning streak, Japan’s Nikkei 225 extends its consecutive weekly rising streak to 9 weeks.

Government bond yields rose except for Brazil and Greece, both whose yields are approaching oversold readings.

In this week’s list, we are seeing some obscure bond yield spreads feature.

The Australian 2 year and 3 year bond yields are enjoying a 6 week winning streak while they are also making ‘higher highs’. Government bond yields in the U.S. and Europe are not.

The Australian 10 year minus 2 year bond yield spread continued being oversold. This week was its lowest close since August 2008.

The U.S. 3 month yield closed a little lower at 5.27% taking a breather from a 6 week run which saw the yield climb from 4.47% to 5.38%.

Commodities were mixed but I’ll say mostly contained as prices seem to be consolidating and Bollinger Bands narrowing and converging.

The bigger moves were amongst those bouncing off extremes such as some of the gas contracts.

 Rotterdam delivered Coal (rose 15%), Dutch TTF Gas (soared 35%) and Soybeans are no longer oversold.

While Cocoa and Cattle are trading in rarefied air. The latter is trading at all-time highs.

Rice bubbled 11% higher over the past 2 weeks.

Most of the softs were stronger while Crude Oil eased 2%.

The JKM LNG contract remains close at its lowest point in 3 years.

The Baltic Dry Index rose 15% making make some of the 49% lost over the past 4 weeks and breaking a similar losing streak. 

Sugar broke its 5 week losing streak with an outside bullish reversal, Uranium racks up 8 straight weeks of gains and Palladium is nearly oversold.

In Currencies the AUD was firmer again, rising nearly an average of 1.5% against all FX crosses. The offshore Chinese renminbi (vs USD) is nearing oversold levels as it completes its 6th consecutive losing week.

The South African Rand has rallied 5% over the past 2 weeks and is no longer oversold.

The larger advancers over the past week comprised of;

Rotterdam Coal 14.8%, Baltic Dry Index 14.8%, Cocoa 4.9%, Coffee 3.5% (though dropped 4.2% on Friday), Lumber 6.1%, Newcastle Coal 3.6%, Natural Gas 3.9% (after Friday’s decline of 4.2% halved the weeks gains), Gasoline 3.7%, Sugar 2.6%, Lithium 2.8%, Dutch TTF Gas 35.3% (rising 19% on Friday alone), Uranium 2.6%, Silver in USD 2.8%, Oats 6.2%, Rice 7.6%, Soybean 2.5%, Wheat 1.8%, KBW Bank Index 2.3%, HSCEI 2.5%, Hang Seng 2.3%, BOVESPA 4%, KOSPI 1.5%, Nikkei 225 2.3%, Russell 2000 1.9%, Istanbul 10.7%, Jakarta 3.2%, Mexico 2.4% and KRE Regional Bank Index rose 3% making its 4 week return reach 18%.

The group of decliners included;

Aluminium (3.1%), WTI Crude Oil (2.1%), Iron Ore (3.2%), Orange Juice (7.8%), Palladium (7.4%), Cotton (2.3%), Brent Crude Oil (1.7%), Corn (2.1%) and Switzerland’s SMI Index declined 1.7%.

June 11, 2023

by Rob Zdravevski

rob@karriasset.com.au 

I ain’t got no beef

An old joke goes…”I went to the butcher shop and bet him $20 that he can’t reach the meat from the top shelf….the butcher replied by saying I can’t take that bet. When I asked him why not, he said the steaks were too high”.

That resonated.

Yesterday, I noticed beef eye fillet was selling for $80 per kilogram.

Cattle prices are at an all-time high.

The attached monthly chart notes the percentages which Cattle prices were trading above its 50 month moving average. The circles also highlight moments when Cattle registered a monthly overbought reading. This has only occurred 7 times over the past 50 years.

Combined with other observations, I think opening a speculative ‘long’ Cattle position is a terrible bet.

It’s worthy to note that since the Russia/Ukraine War commenced, grains prices have halved which has improved the margins for many farmers.

But now, we have an inflection point where the price of grains (used in pastures and feedlots) are making oversold lows and live cattle prices are at the upper end of their pendulum.

With these prices, farmers should consider selling a greater percentage of their stock than they normally do before mean reversion eventuates.

In fact, it is a sellers market and that includes selling the whole enterprise, ranch or cattle station.

Buyers romanced by owning a cattle business can take their chance, but it’ll be best to focus on rearing rather than buying weaners or yearlings.

Speaking of margins, also watch if the CME increases the maintenance margins of its live cattle futures contract.

June 11, 2023

by Rob Zdravevski

rob@karriasset.com.au

Time to watch the AUD again

There is more to this analysis, but the chart and notations below are keeping simple.

Today, the AUD/USD needs to break that most immediate previous high of 0.6818, but I think it’ll peak and exhaust itself at 0.6805 (+/- 10bps)

Watching this currency cross along with the AUD/JPY could provide an interesting analog and correlation to ‘risk’ and a queue on the Nasdaq 100.

June 10, 2023

by Rob Zdravevski

Karri Asset Advisors

rob@karriasset.com.au

Why equities will rip higher

Amongst a host of perverse reasons, this study is one that assists making the case why I can see equity markets could move higher.

The red vertical lines show moments when the Australian 10 year – 2 year bond yield spread (orange line) is trading at 2.5 standard  deviations below its rolling weekly mean and is also registering a weekly oversold reading.

This event coincides and signals the beginning of or continuation of a rally in the ASX 200 (blue line), with the exception being the green vertical line in Nov 2007.

Note that this study is not used to identify a peak in equities markets.

It’s important to note this observation is around the continuation or extension of a rally and not a signal of a major trough where one would ‘pile-in’.

Not all rallies and bull markets smell the same.

June 8, 2023

by Rob Zdravevski

rob@karriasset.com.au

Reading the VIX and its RSI

The VIX is now trading at 14. Whilst this is towards the lower end of its 30 history, it has spent plenty of time around this price.

I find the current RSI reading of 37.50 much more interesting, as shown in the lower chart.

37.50 seems to be around where it extends itself while the circles denote 2 occasions where it traded to 33 in May 2003 and 34.8 in July 2009.

Note that the VIX has never been oversold on a weekly basis

Hmmmm…..

June 7, 2023

by Rob Zdravevski

rob@karriasset.com.au

It hasn’t been sunny for passive ETF index investing

I have created two separate charts depicting the stock performance of the SPY (the well-known index ETF that tracks the S&P 500) compared to Nvidia and Microsoft.

One chart covers a 12-month period, while the other spans 24 months.

It is important to consider the starting date and whether one buys, sells, or trades during the given period. However, the main point I want to convey is this:

If you are a dedicated ETF indexer, you somewhat relinquish the right to aspire to, or claim, the returns that a stockpicker might have achieved.

There are times when passive indexing is favorable, but the past two years have not been one of them, as many major indices have remained relatively flat.

Over the past 12 months, the SPY (including dividends) yielded a 6% return, while Microsoft (MSFT) saw a 26% increase and Nvidia (NVDA) recorded an impressive 109% growth.

During a 24-month period starting from June 5, 2021, the SPY generated a total return of 4%, while Microsoft experienced a 36% surge and Nvidia soared by 123%.

Once again, we can manipulate our story and statistics to suit our narrative, but if I had adopted a “buy and hold” and “don’t time the market” approach, Microsoft’s outperformance by a factor of 4-8 times is significant, not to mention the gains one could have made by holding Nvidia.

Interestingly, I have noticed that many ETF enthusiasts often quote and admire investors like Warren Buffett, David Tepper, Ken Griffin, and others. However, it’s worth noting that these individuals are stockpickers, not ETF investors.

Just some food for thought amidst the hypocrisy that I frequently come across.

June 6, 2023

by Rob Zdravevski

rob@karriasset.com.au