Platinum Asset Management Global Outlook – Nov 2017
November 29, 2017 Leave a comment
Kerr Nielsen and Andrew Clifford present their views to investors
Trying to hear what's not being said
November 29, 2017 Leave a comment
Kerr Nielsen and Andrew Clifford present their views to investors
October 30, 2017 Leave a comment
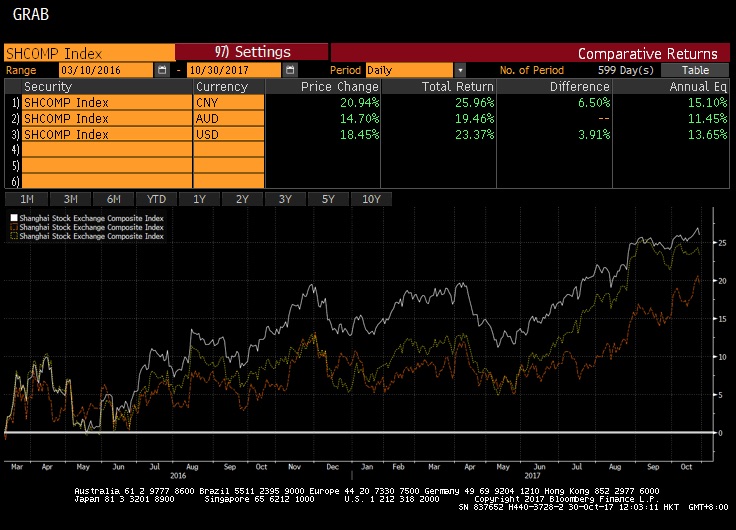
In March 2016, we made a suggestion that making an investment in the Shanghai equity index had attractive probabilities and was an equally such proposition.
Since then, its total return has been between 19% – 25% (depending on the currency of measure) as displayed in the image below. This means an average of more than 1% per month for the past 18 months.
We think this has been a more than adequate return when considering the amount of risk we were taking and when comparing it to other alternatives including investing in cash or fixed income.
Furthermore, the Shanghai Composite Index was trading at an “oversold” levels which we hadn’t seen for many years.
Interestingly, whilst many major equity markets power on to new all-time heights, the Shanghai Composite is still 50% below its peak of 10 years ago.
I would like investors to ponder what the Chinese stock market will look like in 20 years time. 
September 11, 2017 Leave a comment
https://switzersuperreport.com.au/video/hamish-douglass/
Courtesy of the 2017 Switzer Listed Investment Conference, held on August 31, 2017.
September 11, 2017 Leave a comment
June 9, 2017 Leave a comment
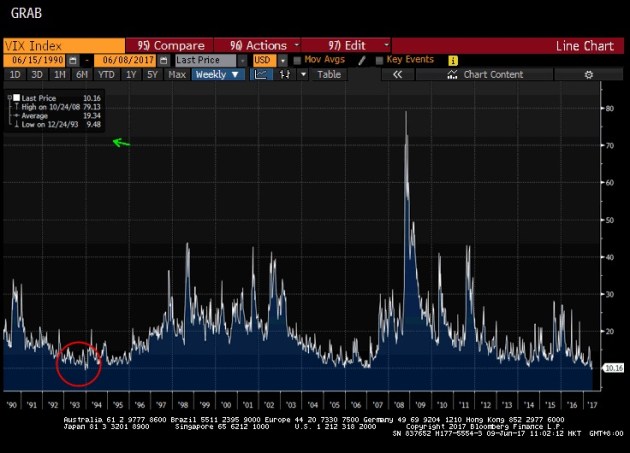
A low reading in the VIX suggests little or less equity market volatility. It could mean that the world is OK and perhaps there is ‘smooth sailing’ ahead.
To the contrarian, a low VIX could be a signal of an expected reversal, whereby the VIX rises and investor fear increases. Often, such fear translates into declining asset prices.
23 years ago (December 1993) the VIX was trading at the same level which it is today.
Over the next 6 years, the VIX quadrupled. This tells us that volatility has increased but back then I don’t recall an overwhelming sentiment of fear.
How we read the VIX Index is not always the same.
How did the equity market react to a rising VIX?
Commencing in 1993 (with subdued trading volumes) up until 1999, the S&P 500 Index (see chart below) trebled in value.
In 1993, the markets were 6 years into recovery following the 1987 stock market crash and Bill Clinton was a year into his presidency. Incidentally, in December ’93, the S&P 500 was trading 43% higher than its 1987 pre-crash peak.
And it wasn’t until another 3 years (Dec ’96) until Alan Greenspan made his “irrational exuberance” speech.
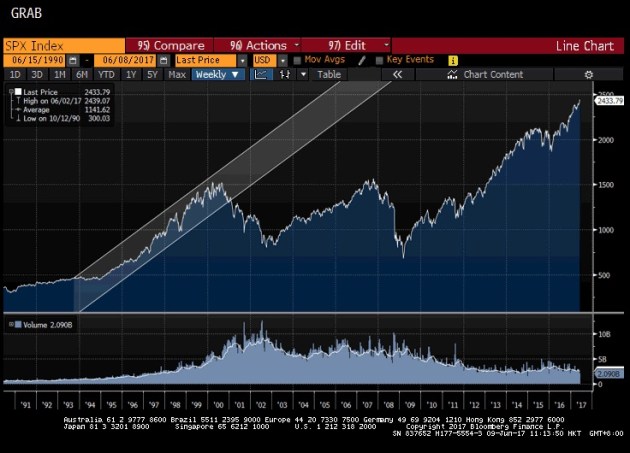
Unlike, the 2008 -2009 spike in the VIX which resulted in a sizeable decline in equity prices, the 1993-1999 period was prosperous for equity investors, even though volatility was rising or at least it was according to the VIX Index.
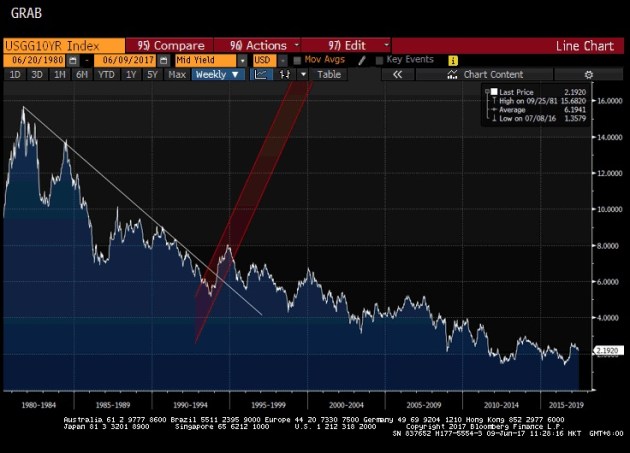
On the interest rate front, even though the yield in the U.S. Treasury 10 year bond (see chart below) shows a spike in interest rates from 5.3% up to 8% between late ’93 and late ’94, interest rates resumed their downtrend trend down reaching 4.3% in 1998. While we saw fluctuations (volatility) in interest rates, it was interesting to note that the average yield over this period was 6.2%.
Even more so, the average interest rate over this 37 year chart is also 6.2%, as displayed in the data box in the top right hand corner of the image.
So, between 1993 – 1999, the VIX (volatility) increased, equity prices also rose and interest rates stayed low.
Today, the VIX is at historically low levels, we have subdued trading volumes (arguably with low investor participation), the S&P 500 is 8 years into a recovery following the 2008-2009 “crash” and its trading at levels 54% higher than the pre “crash” high.
It is plausible that interest rates continue to stay low, that the VIX rises from its 23 year low and equity prices climb.
After all, no one has made an ‘irrational exuberance’ speech.
May 25, 2017 Leave a comment
“. . . information generally follows the well-known 80/20 rule: the first 80 percent of the available information is gathered in the first 20 percent of the time spent. The value of in-depth fundamental analysis is subject to diminishing marginal returns.”
“Most investors strive fruitlessly for certainty and precision, avoiding situations in which information is difficult to obtain. Yet high uncertainty is frequently accompanied by low prices. By the time the uncertainty is resolved, prices are likely to have risen. Investors frequently benefit from making investment decisions with less than perfect knowledge and are well rewarded for bearing the risk of uncertainty. The time other investors spend delving into the last unanswered detail may cost them the chance to buy in at prices so low that they offer a margin of safety despite the incomplete information.”
Source: Margin of Safety, Seth Klarman, 2007
May 25, 2017 Leave a comment
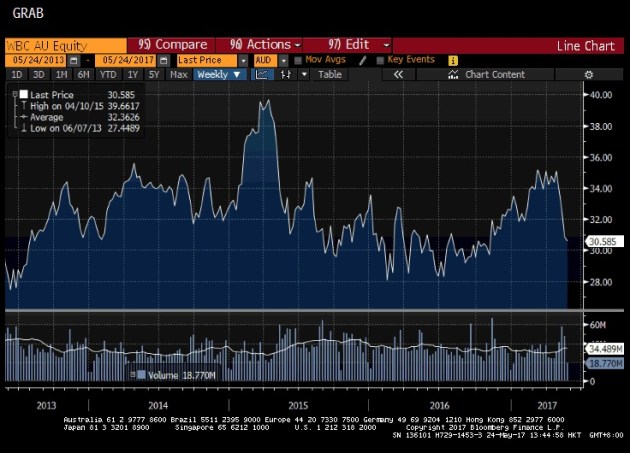
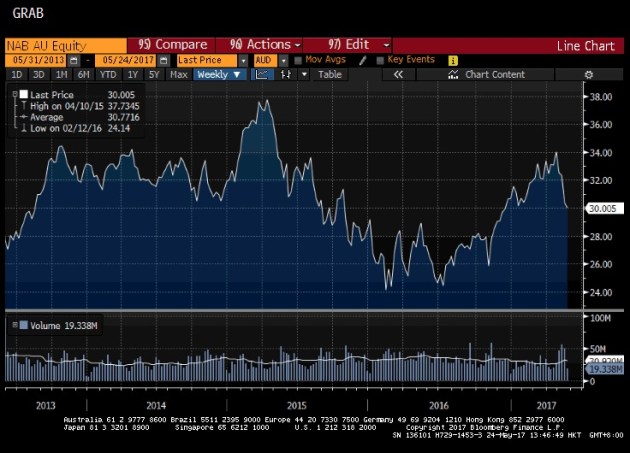
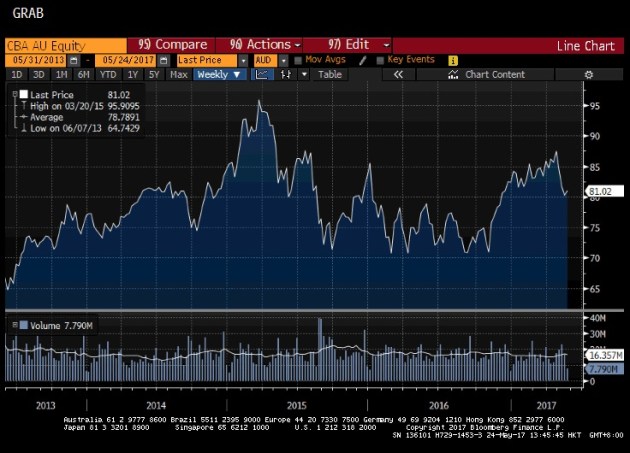
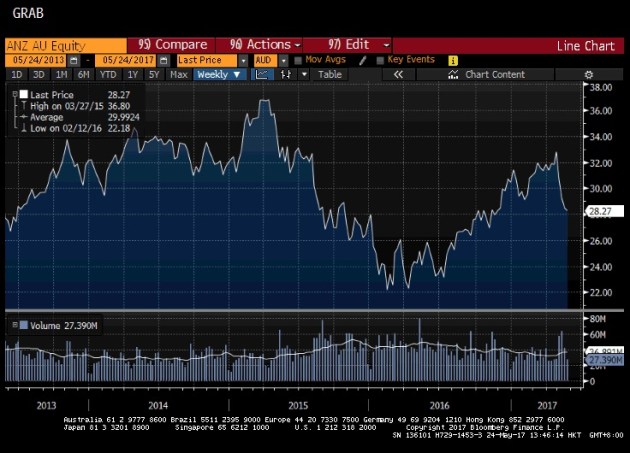
For investors in Australian banks, the stock charts (below) of the four major Australian banks (ANZ, Commonwealth, NAB and Westpac) show that over the past 4 years it has been possible to have either lost money or currently show a capital loss.
It all depends when you bought them.
It is concerning that retail investors often elbow their mates in the ribs and re-affirm that “you can’t go wrong owning bank shares”.
Well, yes you can.
As an extension of my recent post about the misnomer of “blue chips” being the major qualifier of asset quality and safety, these charts shows without any reference for fundamental valuation analysis that investors can do themselves a disservice by not being intellectually honest.


May 9, 2017 Leave a comment
When I meet people and get talking about my business of being an investment advisor, it is a natural progression in the conversation that they ask about my investing and analysis style.
I start by telling them that I am a value investor. “Oh, like Warren Buffet!”, they respond. Well, “no” I say, because I’m not Warren Buffet for all the obvious reasons. I have a style and philosophy based on analysing a company, its business, their management, its products or services, the balance sheet, income statement, cash flows etc etc.
This helps me to build a basis for whether I investigate and analyse the company any further, let alone try to determine whether it’s current stock price is attractive enough to become a shareholder.
The listener, then usually responds with, “So, you just stick with buying the blue chips, don’t you”.
Here lies the shortcomings of many amateur investors. They think that buying “blue chips” circumvents the need to perform analysis. Many amateur investors just don’t do enough “work” prior to making investment decisions. This type of investor thinks that if you “just buy blue chips”, then you are safe and OK.
I can tell you that this is simply not the case.
In short, if you don’t buy your assets cheap enough leaving you with a margin of safety or error, then your capital is always vulnerable to a loss.
Being an investor who looks for bargains, means that you look for assets of any kind which present value. The asset or security doesn’t come with a pre-determined label of “blue-chip” or any other descriptor.
You can buy a house in a “dress circle” part of town, but if you pay too much, you can lose money.
Buying “Blue Chip” is not the saving grace when investing, if you pay the wrong price.
March 18, 2017 Leave a comment
I read a newspaper article which cited that borrowers in Western Australia may be disadvantaged by the interest rate policy being set by the Reserve Bank of Australia.
It was written that the RBA may be concerned about the rising property prices in Sydney & Melbourne and (in order to temper housing affordability issues) may influence an increase in interest rates.
The article then quoted a Western Australian property “expert” who expressed concern that any rate rise will hurt an already lagging and subdued Perth property market.
I think the author should have either asked the question or argued the point, “should Australia have more than one official Central Bank lending rate”?
Perhaps an even lower borrowing interest rate for those living west of the 130th meridian?
The (my) answer is no!
I do hope that the Reserve Bank of Australia isn’t placing too high of a weighting on eastern seaboard property prices when formulating interest rate policy.
After all, banking lending practices remain quite tight and I think alternative Australian lenders aren’t engaging in the worrisome practices of 10 years ago.
Credit may be historically cheap but lending isn’t loose yet. The RBA would be looking at status of the lending and banking markets rather than whether people are engaged in the greater fool theory in Sydney or Melbourne real estate.