Don’t Believe The Hype

Isn’t it funny how the business media frames the things which they want you to hear?

Recent examples include;

when Bitcoin was falling below $30,000 the headline news was about a ‘death cross’ (when the 50 day moving average moves below its 200 day MA) suggesting lower prices. No news lately since Bitcoin bounced 50%….

and then there was Robinhood shares doubling in 1 day from $40 to $85. No news lately that they have halved again back to $44…..

Between March and May everyone suddenly knew that Lumber doubled in price from $800 to $1,700…..do they know that it has fallen 75% to $470 since then?……

and a host of “hot” IPO’s are no longer being reported on or about…..

Take Bumble and Latitude Financial for example, both are down 30% from their opening print, U.S. BNPL stock Affirm is down 55% from its peak and a host of others.

There is merit avoiding or questioning the consensus and some skill required to filter the noise, whilst there isn’t a substitute to doing your research and analysis.

August 20, 2021

by Rob Zdravevski

rob@karriasset.com.au

Time for Nickel (and IGO) to pullback

Here is the stock price of ASX listed, Independence Group (IGO:ASX) 

(orange line)overlaid with the Nickel price. (blue line)

A fairly good correlation I’d say.

With Nickel flirting with weekly Overbought levels and exhibiting 

a historical stretch above its 100 and 200 week moving averages, 

mean reversion is calling. 

IGO’s timing and strategy of using its stock to acquire fellow Nickel 

miner, Western Areas is perfect.

In turn, IGO’s stock price has now broken below an important support level.

I’m looking for it to trade down to $7.67 by August 31, 2021.

August 19, 2021

by Rob Zdravevski

rob@karriasset.com.au

#nickel #IGO

IGO’s clever use of equity

Here is a chart illustrating the percentages which Independence Group (IGO:ASX) has traded at either above or below its 200 week moving average.

The company has cleverly issued shares and made acquisitions at many of those peaks.

Examples include;
2008 Karlawinda
2011 Jabiru
2015 Sirius
2016 Windward
2018 Southern Hills
2021 Western Areas, Silver Knight & Tianqi,

This is an example of how to strategically use your extended stock price as effective currency.

August 10, 2021
by Rob Zdravevski
rob@karriasset.com.au

Copper on verge of breaking lower

Carrying on from my May 2021 call and reiteration in June 2021, Copper continues its laddered decline closer to its longer term mean.

Today, Copper is perilously poised.

It is trading at $4.24 on the front Comex contract and a break below $4.17 could see a swift decline to the $3.65-$3.43 level.

Your stop loss on a new short entered here would be $4.37, while a move above $4.45 will help wane the strength of the current downtrend.

August 18, 2021

by Rob Zdravevski

rob@karriasset.com.au

It’s only 10%

Context is required

If a 10% correction in the S&P 500 was to occur, we’re only back to March 2021 levels.

Hardly earth-shattering stuff.

In fact, a 12% retracement would see the S&P 500 kiss its 50 week moving average.

All quite healthy and plausible.

Currently, the S&P 500 is exhibiting a bearish outside reversal week.

As mentioned in my recent Macro Extremes note, it’s going to be an interesting week or two. The S&P 500 is also registering a weekly Overbought reading and my other indicators are also increasing probability for a move lower over the next 2 weeks or so.

My target for any decline is 4,022.

My medium term view is that equities move higher and any decline is merely a blip in the larger picture.

If ‘corrections’ concern you, it’s time to consider selling shares so to lower the amount of money exposed and at risk or consider taking out some insurance against ‘market risk’ such as buying put options or shorting the S&P 500 futures.

I bet many won’t do any of that.

August 18, 2021

by Rob Zdravevski

rob@karriasset.com.au

More downside risk in FMG

At the moment, FMG’s stock price is testing an important support line. 
A pending bounce in price is NOT the main game. 
I’m expecting a path to $15 mark into a March-April 2022 timeframe 
to where the 200 week moving average will be at that time.

August 18, 2021
by Rob Zdravevski
rob@karriasset.com.au

cue

Lumber entering a Buy range

A year ago I was writing about the parabolic price move in Lumber and since then I’ve spoken at various events about the importance of ‘honouring’ or respecting that parabolas are followed by a regression to the mean.

Of course, you can always pick the ‘mean’ which suits your story.

Mean reversions following parabolic moves are also good for shaking out the un-natural owners of an asset, commodity or token, perhaps.

Lumber has fallen 72% since its mid-May 2021 high.

Perhaps many should ask their homebuilder if the construction quote is any cheaper now?

Even so, Lumber may be at a price where it’s safer to buy.

Another 2% lower should do it, $461 looks like a good entry point.

August 17, 2021

by Rob Zdravevski

rob@robzdravevski

Macro Extremes (week ending August 13, 2021)

The following assets (on a weekly timeframe) registered an Overbought reading or traded more than 2.5 standard deviations above its rolling mean.

Extremes “above” the Mean (at least 2.5 standard deviations)

Cocoa

Sugar

USD/KRW (meaning a weak Korean Won)

Germany’s DAX

Overbought (RSI > 70)

Tin (for the 16th week)

Hot Rolled Coil Steel (for the 46th consecutive week)

Switzerland’s SMI equity index (for the 10th week)

Australia’s ASX 200 (for the 4th week) 

India’s NIFTY-50 equity index

France’s CAC-40 index

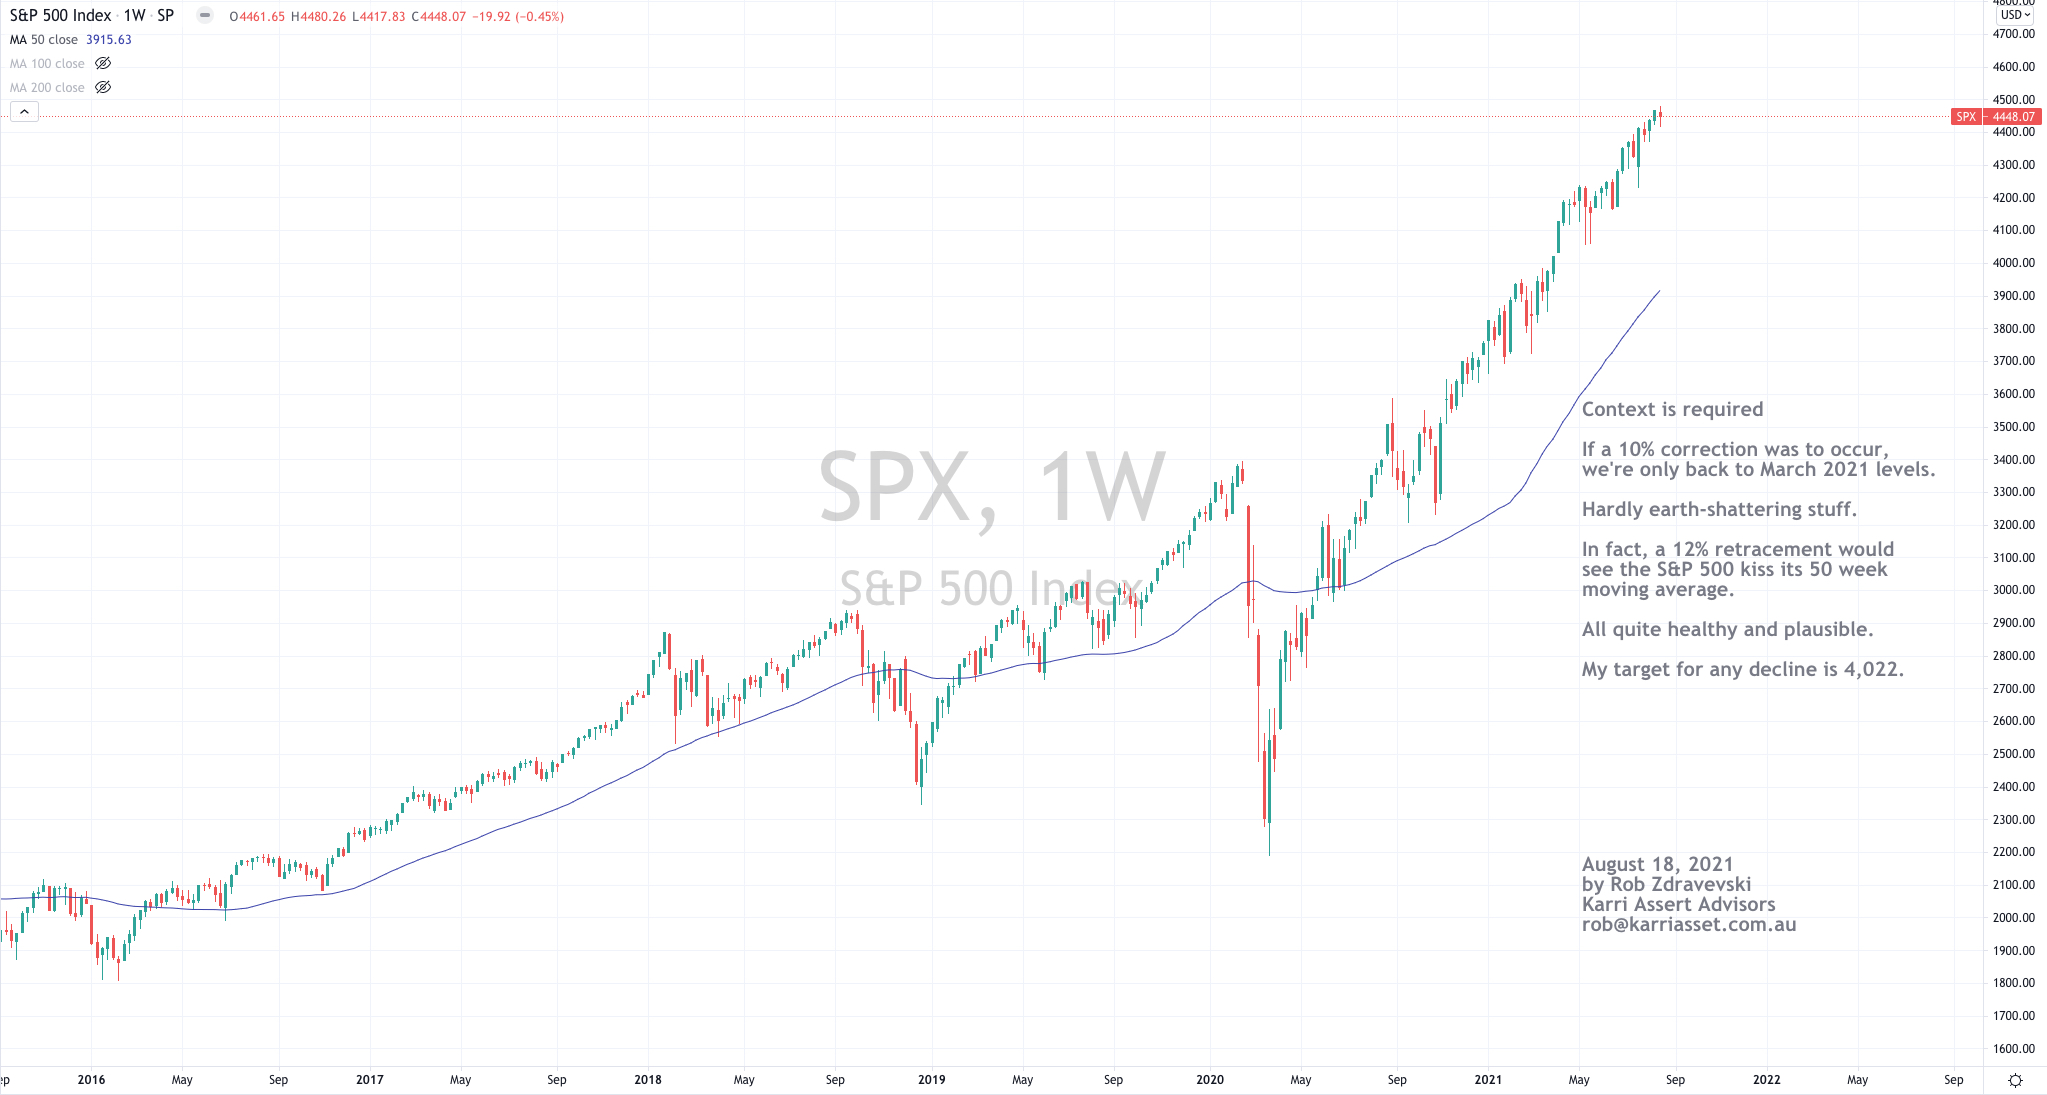
the S&P 500 and Nasdaq 100

and the Oslo, Stockholm, Copenhagen and Helsinki equity indices.

The Overbought Quinella – Both Overbought and Traded at > 2.5 standard deviations above the weekly mean)

Amsterdam’s AEX index

Italy’s MIB equity index

Assets (securities) within my immediate universe which touched the other side of the extreme, being Oversold (where the RSI is < 30) or were at least 2.5 standard deviations below its mean are;

Extremes “below” the Mean (at least 2.5 standard deviations)

Gold, Silver & Platinum (all oversold extremes occurred on Monday, due to a large Gold sell order and the precious metals are reacted suit)

Oversold (RSI < 30)

 Chinese Government 10 year bond yield (suggesting bonds where being bought aggressively)

The Oversold Quinella – Both Oversold and Traded at < 2.5 standard deviations above the weekly mean)

 Nil

Notable deletions from last week’s list include;

a range of Government 10 Year bond yields and Chinese related equity indices from their Oversold extremes.

Notes & Ideas:

Since their recent overbought readings, energy commodities continued to decline and seeming to commence new downtrends.

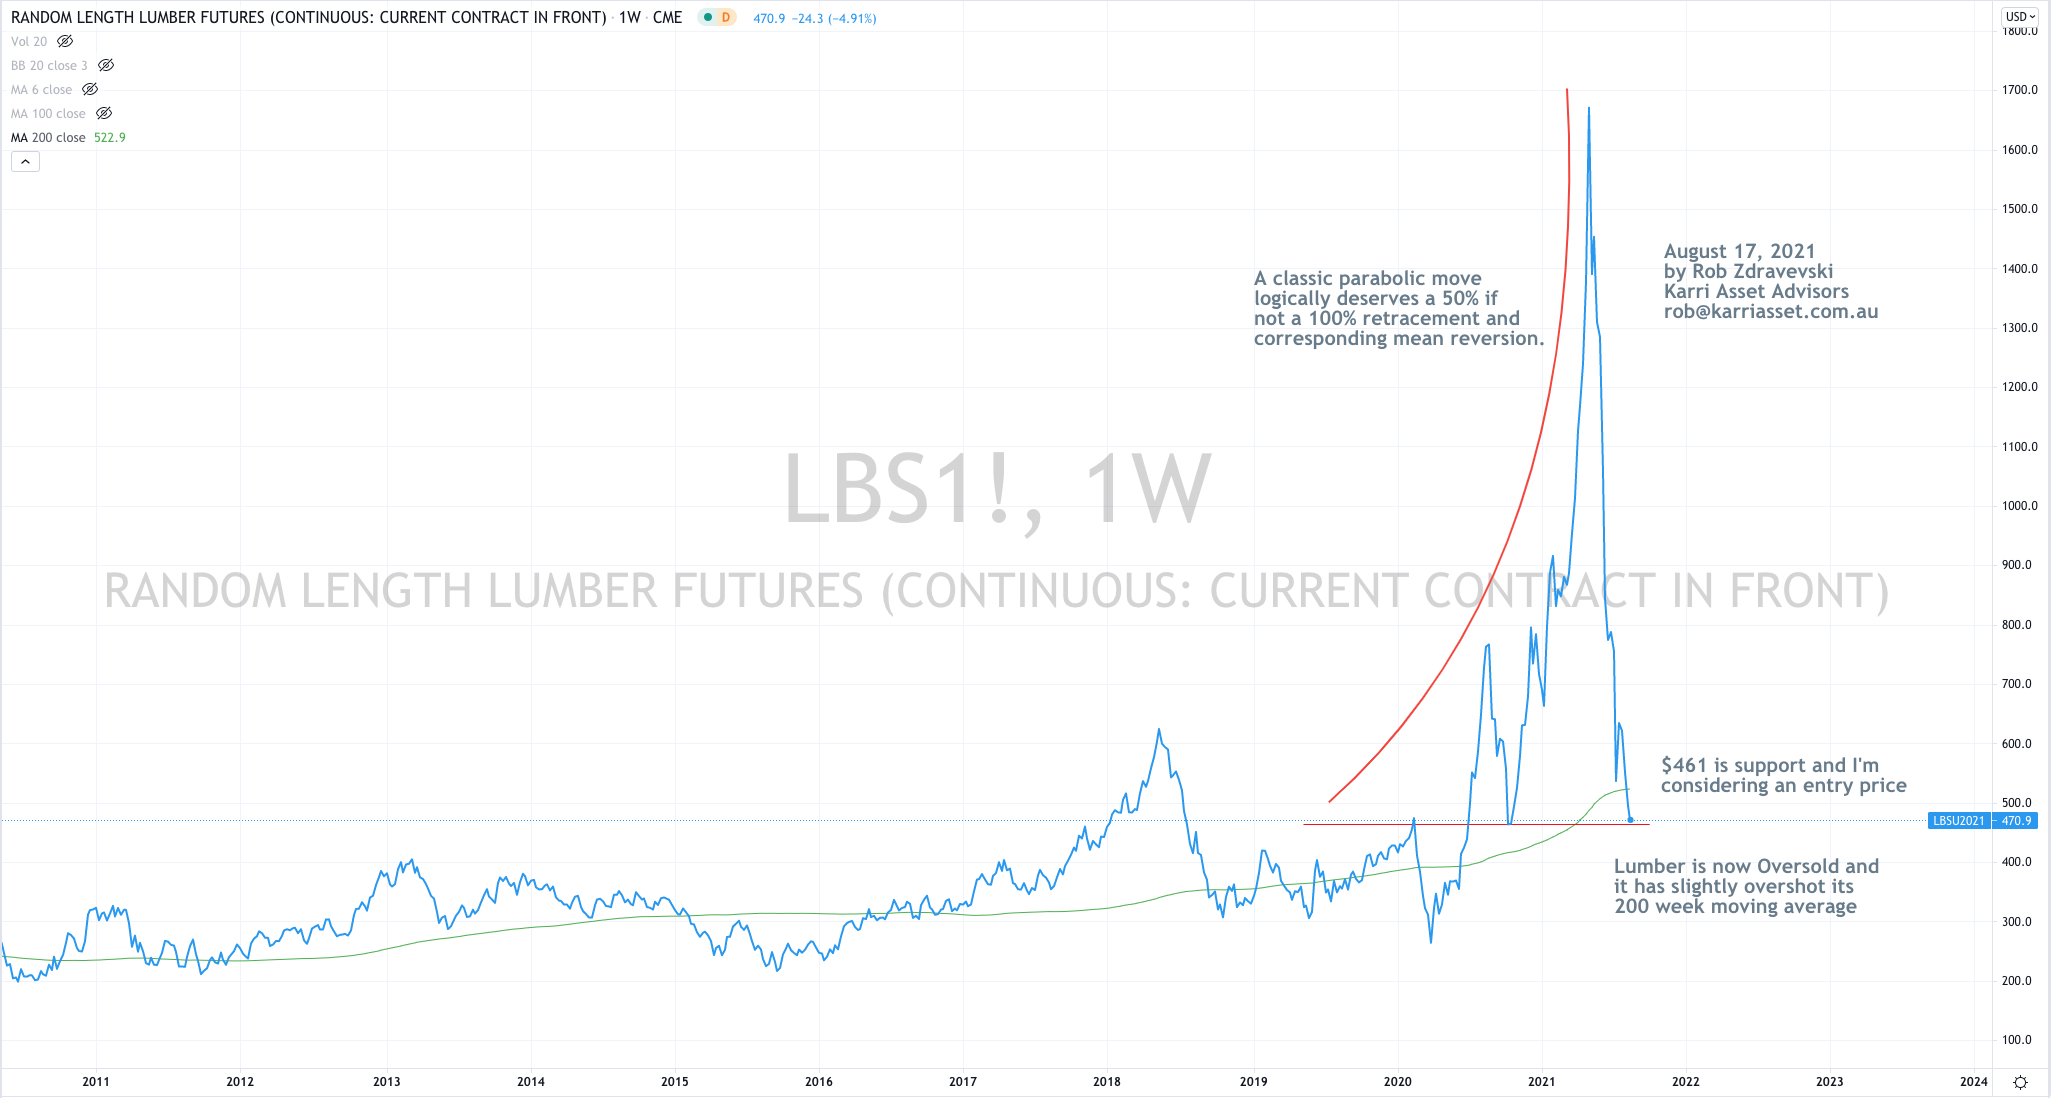
The decliners included Iron Ore (4%), Lumber (10%), Natural Gas (7%), Taiwan’s TAEIX (3%).

Advancers were dominated by soft commodities where Sugar rose 6.8% for the week (adding to last week’s 7%), Wheat climbed 6%, Soybean & Corn advanced 2%, Coffee soared 6%, Platinum bounced 5%, while equity indices such as the Swiss SMI, Italy’s MIB and the U.S. KBW Banks rose 2%.

It’s worth to review two of the major longer term (Lean Hogs and Lumber) Overbought extremes seen in the earlier part of 2021. They are now 30% and 71% below their respective June and May highs, and yet they are not yet ‘Oversold’.

While, this past week saw Wheat close at its contract high since February 2013.

The 10’s remain bound in a larger range but we watch it as broader capital markets could become explosive is the 10’s break decisively either below 1.15% or above 1.45%. They closed on Friday at 1.28%.

The risk of lower commodity prices remains as the U.S. Dollar Index (DXY) strengthens and trends higher, although the DXY needs to break above 93.10 to confirm so.

The Copper/Gold ratio seems to be trending higher, telling us the economy is healthy. A turn lower will change this view and aid the correlation of lower interest rates.

The Australian 10 Year Government bond yield continue to trend lower, although the trend and yields seem close to bottoming. A lower yield will correlate with a weaker AUD while the Kiwi 10 Year bond yields are establishing an early, new upward trend.

This in turn will affect the US 10 year minus Australian 10 year yield spread the most interesting indicator to watch. Last weeks poke higher (to a 2.5 standard deviation extreme) and subsequent reversal suggests a weaker S&P 500 for the next 2 weeks.

Another risk indicator to watch is the AUD/JPY. Whilst it remains below 81.65, the risk of lower equity prices also remains, especially the divergence currently being seen against the S&P 500. 

And I continue to watch the Japanese 10 Year bond yield which needs to stay above 0.00% to assist a bullish equities case. It’s currently 0.009%.

What a week coming up !

No cryptocurrencies registered any Extreme readings.

And lastly, Bitcoin is trading 215% above its 200 Week Moving Average, which is higher than last week’s 200% reading and notably higher than the reading of 140% seen 2 weeks ago, while certainly lower when compared to its 466% peak in mid-April 2021.

August 13, 2021

by Rob Zdravevski

rob@karriasset.com.au

Mexico raises interest rates

To curb inflation, Mexico has also raised interest rates by a quarter point to 4.5%.

Mexico’s GDP is ranked 15th largest (2 spots behind Australia’s) but the difference amongst its 127 million people is that it’s GDP per Capita is $9,000.

And so it remains, that inflation is a tax that the poor can’t afford to pay.

The poor don’t own assets like the rich. The poor are concerned about the cost of living, not amassing or owning assets.

But in ‘rich’ Australia (where the GDP per capita is $55,000), the larger concern is how rising interest rates will affect the servicing of its world leading 124% Household Debt to GDP ratio.

Mexico’s Household Debt to GDP is only 17%.

Recently Russia, Hungary, Czech Republic, Brazil have hiked rates.

https://www.global-rates.com/en/interest-rates/central-banks/central-banks.aspx

All of these nations have a Household Debt to GDP ratio below 37%.

Interest Rate policy in ‘rich’ countries may be behind the curve due to risk that rising rates will cause a decline in assets.

In the meantime, the rich will carry on paying for a higher cost of living, so to protect the value of their assets, ironically fuelled by cheaper debt.

August 15, 2021

by Rob Zdravevski

rob@robzdravevski

Nothing is certain

In the context of investor concern about equity markets hitting new all-time highs, this week I was asked;

“but we live in uncertain times, Rob”.

In the context of investor concern about equity markets hitting new all-time highs, this week I was asked;

“but we live in uncertain times, Rob”.

I responded with….”times are always uncertain…..in the past 30 years, when have we felt ‘certain’?”

I continued to say, that even your bank cash deposits aren’t certain.

Forgetting the creditworthiness of the bank (which was tested in 2007-2008), my deposit rate was 4% in 1997.. today, a 3 months term deposit at an Australian bank is 0.10% p.a..

Hardly something to have counted as being ‘certain’.

Such financial illiteracy continues to baffle me.

Managing and being aware of risk is one thing, but being tainted by the media and what “doomsday” pundits say, can be damaging to your wealth.

Uncertainty and Volatility are the price an investor pays for longer term capital gains, unless you have bank deposits.

August 15, 2021

by Rob Zdravevski

rob@karriasset.com.au